



Stocks struggle amid trade war concerns and rates outlook
US index futures are pointing to a lower open on Wall Street, mirroring a downbeat start for European equities.
Share this:

US index futures are pointing to a lower open on Wall Street, mirroring a downbeat start for European equities. On a micro level, US index futures have fallen despite the release of mostly better-than-expected company earnings today. Boeing, for example, reported Q2 revenue of $24.3 billion and core EPS of $3.33 and boosted its revenue forecasts, beating expectations of $23.7 billion and $3.27 respectively. Yet its shares fell in pre-market with investors noting the sizeable $418 million blow from additional costs and as its core EPS guidance missed. GM and Fiat Chrysler stocks have dropped sharply in pre-market too despite reporting forecast-beating figures in terms of earnings and revenue. But their shares fell as both carmakers have lowered their outlooks due in part to soaring input costs as a result of surging steel and aluminium costs. On a macro level, sentiment has been hit by ongoing trade war concerns and tariffs pushing up costs for companies. Rising interest rate expectations are also weighing on sentiment. Although so far these concerns have been largely shrugged off, it wouldn’t take much to knock the indices off their perch, especially with stock valuations being so stretched. Meanwhile on a technical level, things could turn really ugly for stocks if the latest chart patterns on the major indices are anything to by.
Russell 2000 creates potential triple top at major resistance zone
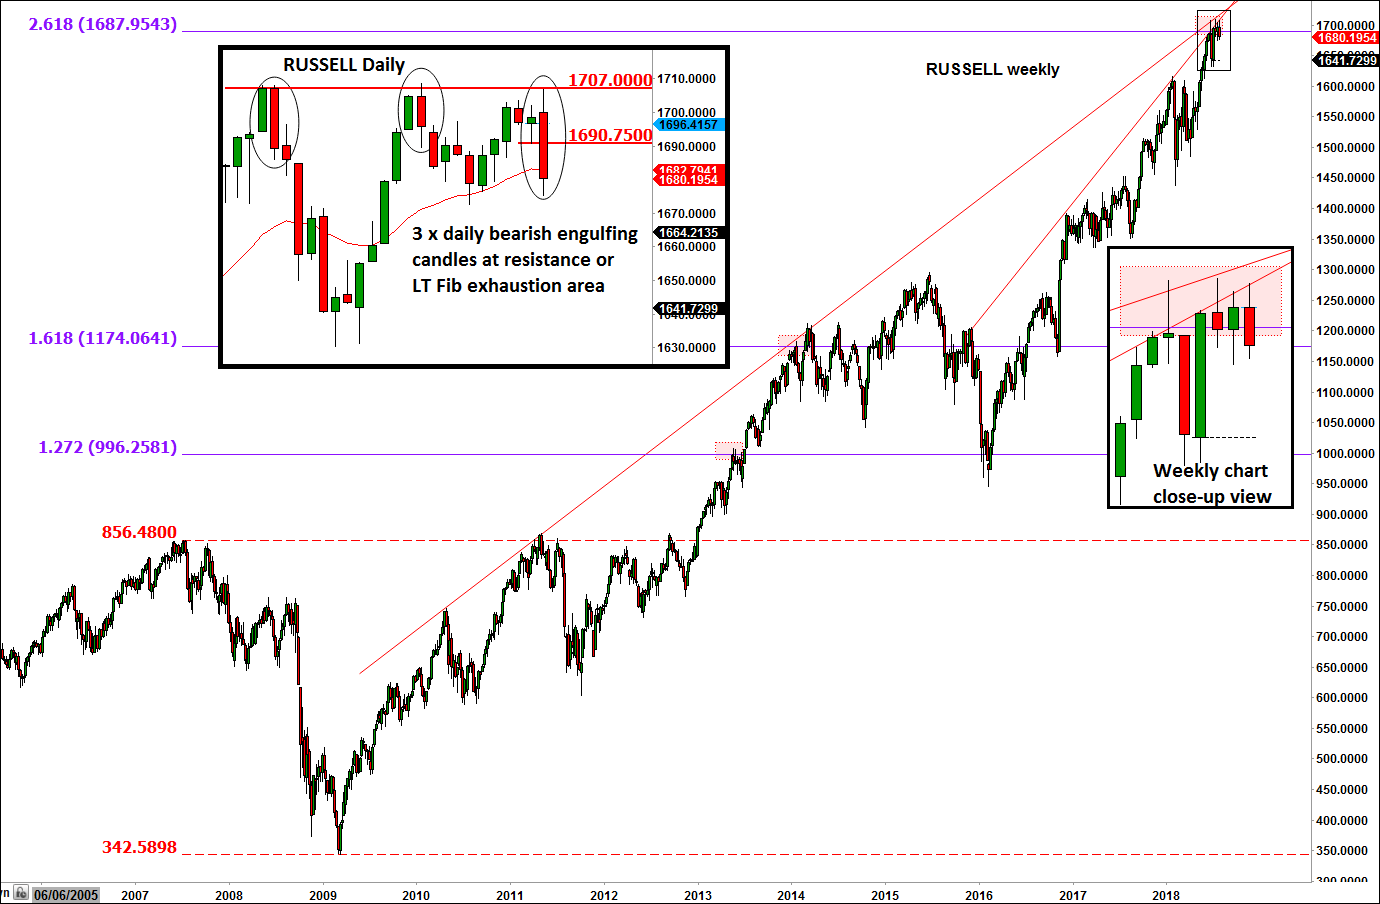
Indeed, the charts of the Russell 2000 index paint a rather bearish picture as it has arrived at a major resistance area. On the lower time frame daily chart (see the inset), one can easily observe the formation of three bearish engulfing candles around the 1700 resistance level. After twice failing to break through this level, it had another attempt yesterday and this time it failed again, forming a potential triple top pattern here. The breakdown this time was more pronounced, but it remains to be seen if there will be any real follow-through to the downside this time around. Looking at the longer term picture and the main weekly shows the Russell arriving and stopping at a major resistance area, comprised of the 261.8% Fibonacci exhaustion of the 2007-2009 melt down converging with the top of the rising trend line.
S&P 500: hanging man
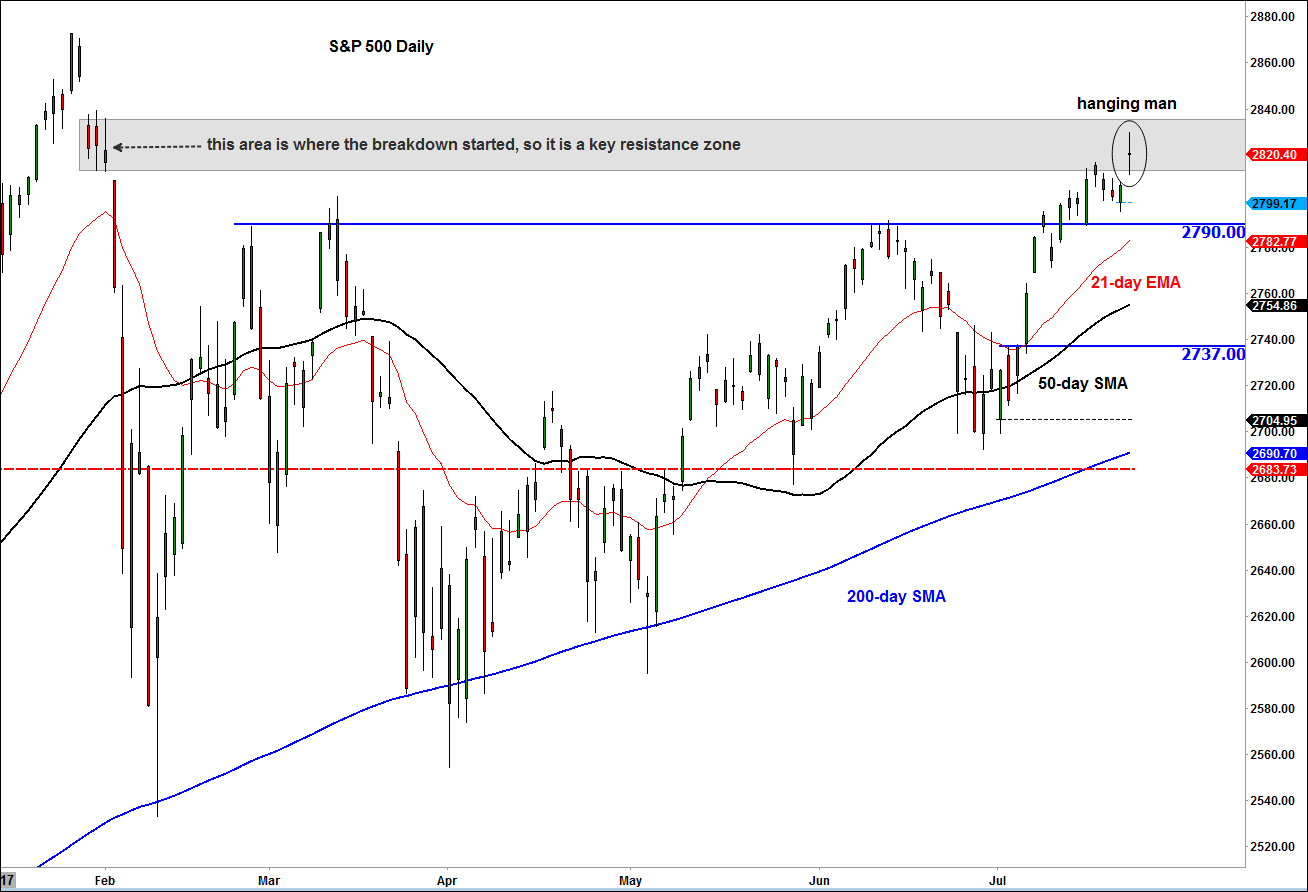
Meanwhile the daily chart of the S&P 500 index shows a so-called hanging-man pattern. The candlestick shape of this pattern often appears at the end of an uptrend. It has a very small body and a long lower wick. This one doesn’t exactly have a long leg, but the rest of the characteristics are similar. It should be noted that unlike the Russell and Nasdaq, the S&P 500 hasn’t made a new record high following its drop in February. If this pattern is indeed a valid bearish reversal pattern then we could potentially see the formation of a lower high in the S&P here.
But before we get too bearish, let’s see if these potentially bearish technical patterns are backed by actual selling pressure. Lots of key support levels come in at lower levels for the major indices which could help support the markets. But one thing is clear: the technical indications are far from painting a bullish outlook.
Source: eSignal and FOREX.com. Please note, this product is not available to US clients
Source: eSignal and FOREX.com. Please note, this product is not available to US clients
Related tags:
Latest market news



Open an account today
Experience award-winning platforms with fast and secure execution.
Economic calendar
Web Trader platform
Our sophisticated web-based platform is packed with features.
Related articles
From time to time, StoneX Financial Pty Ltd (“we”, “our”) website may contain links to other sites and/or resources provided by third parties. These links and/or resources are provided for your information only and we have no control over the contents of those materials, and in no way endorse their content. Any analysis, opinion, commentary or research-based material on our website is for information and educational purposes only and is not, in any circumstances, intended to be an offer, recommendation or solicitation to buy or sell. You should always seek independent advice as to your suitability to speculate in any related markets and your ability to assume the associated risks, if you are at all unsure. No representation or warranty is made, express or implied, that the materials on our website are complete or accurate. We are not under any obligation to update any such material.
As such, we (and/or our associated companies) will not be responsible or liable for any loss or damage incurred by you or any third party arising out of, or in connection with, any use of the information on our website (other than with regards to any duty or liability that we are unable to limit or exclude by law or under the applicable regulatory system) and any such liability is hereby expressly disclaimed.