



Two trades to watch: EUR/USD, Barclays
EUR/USD holds above 1.13 as Russia headlines slow, for now. Barclays jumps as profits more than double.
Share this:

EUR/USD holds above 1.13
EUR/USD is edging higher as risk sentiment improves. With no notable Russian headlines overnight, fears of war have calmed and risk appetite is cautiously higher
The euro is shrugging off weaker German consumer morale after the GFK consumer confidence unexpectedly fell to -8.1 in March, falling from -6.7 in February. Expectations had been for a rise to -6.1.
The fall in consumer morale comes as inflation remains elevated and producer prices sit at 25% suggesting that inflation is unlikely to fall any time soon.
Todays data comes following upbeat German IFO business sentiment data yesterday.
Looking ahead Eurozone CPI inflation is expected to confirm the preliminary reading of 5.1%.
There is no high impacting US data due today.
Where next for EUR/USD?
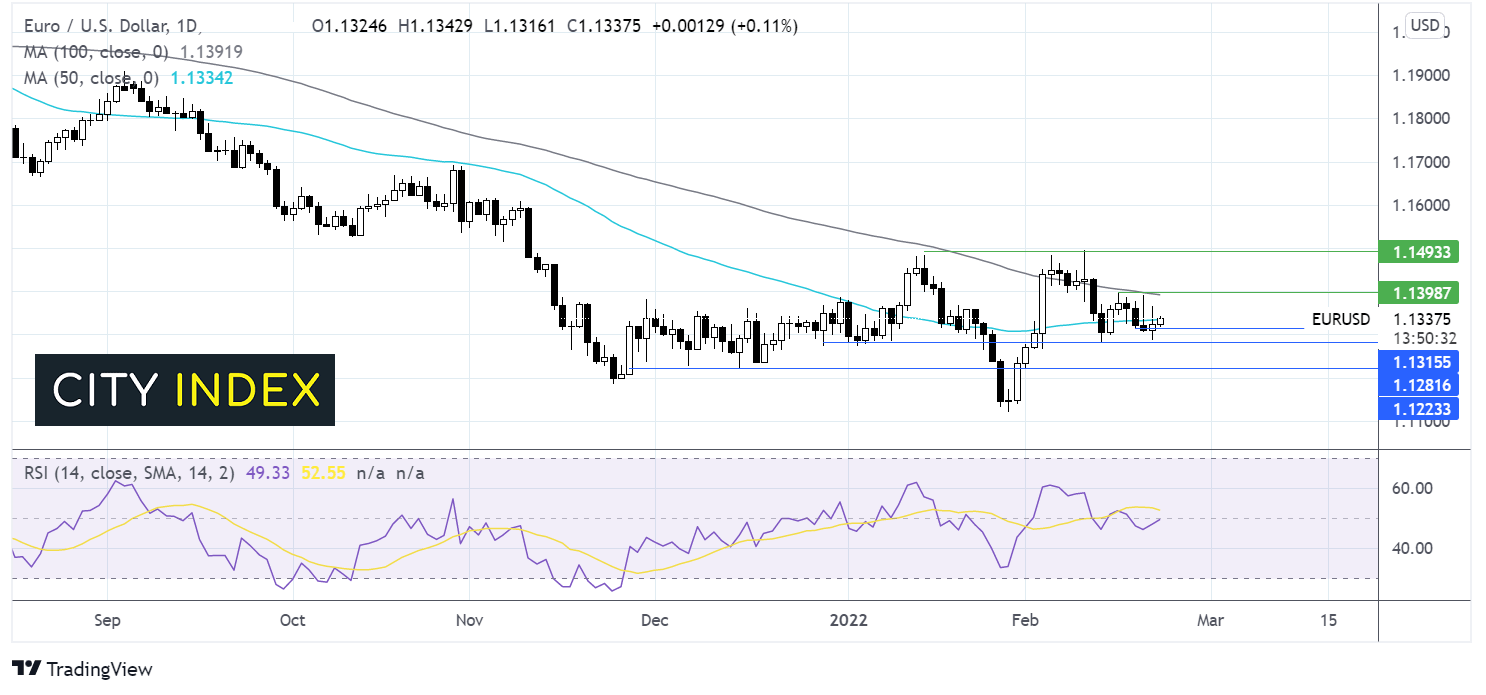
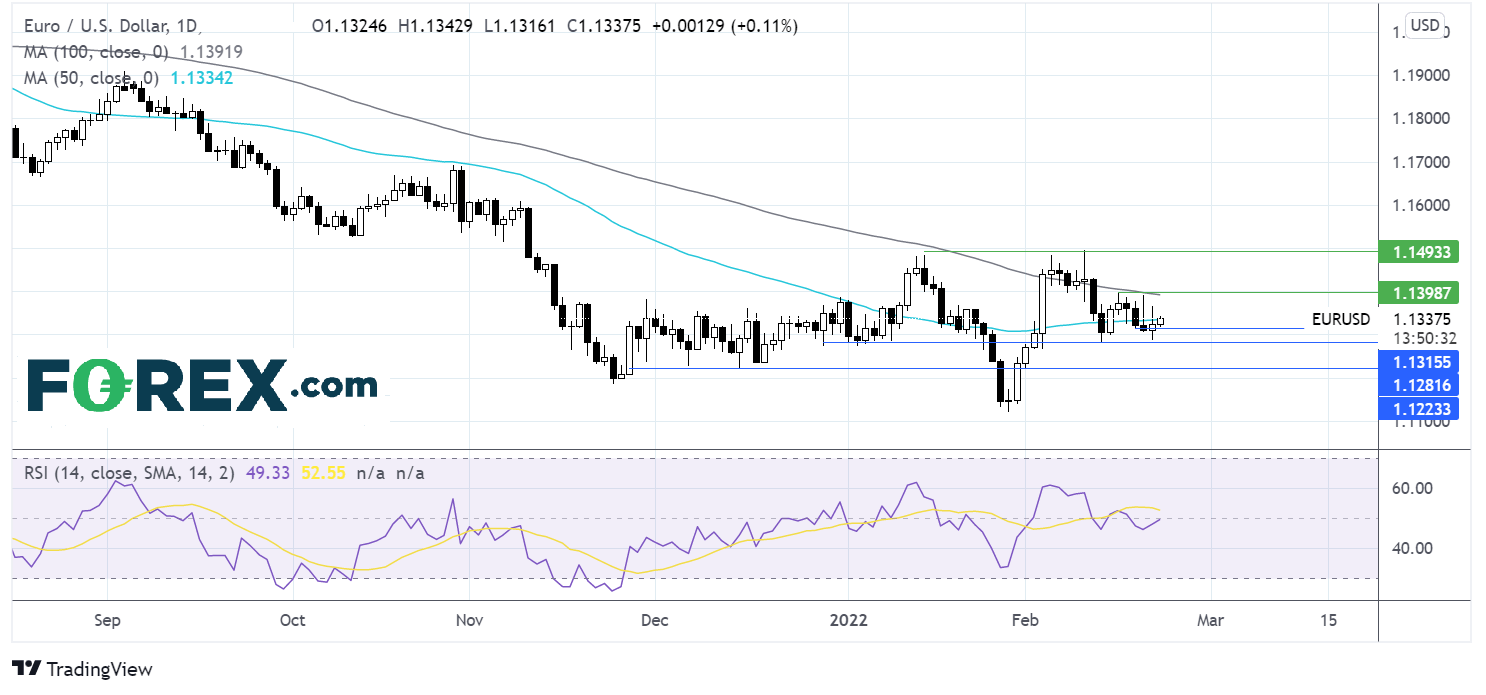
EUR/USD has traded relatively range bound over the past 10 days capped on the upside by the 100 sma a 1.1390 and on the lower band by 1.1290.
The RSI is showing few clues over what to expect. For a breakout trade sellers could look for a move below 1.1290 towards support a 1.1230 the December low and 1.1190 the November low.
Buyers could look for a move over 1.1390 to target 1.1490 the 2022 high.
Barclays jumps as profits more than double
Barclays has jumped higher after reporting a record annual profit and returning £2.5 billion to share holders via dividends and a buyback.
The bank recorded profits of £8.4 billion, above expectations of £8.1 billion and almost triple the £3.1 billion recorded in 2020. The bank said that it would buyback £1 billion and pay out a 4p per share dividend.
The strong numbers came on the back of a strong performance in the investment banking arm as after it released £700 million from bad loan reserves.
Where next for Barclays' share price?
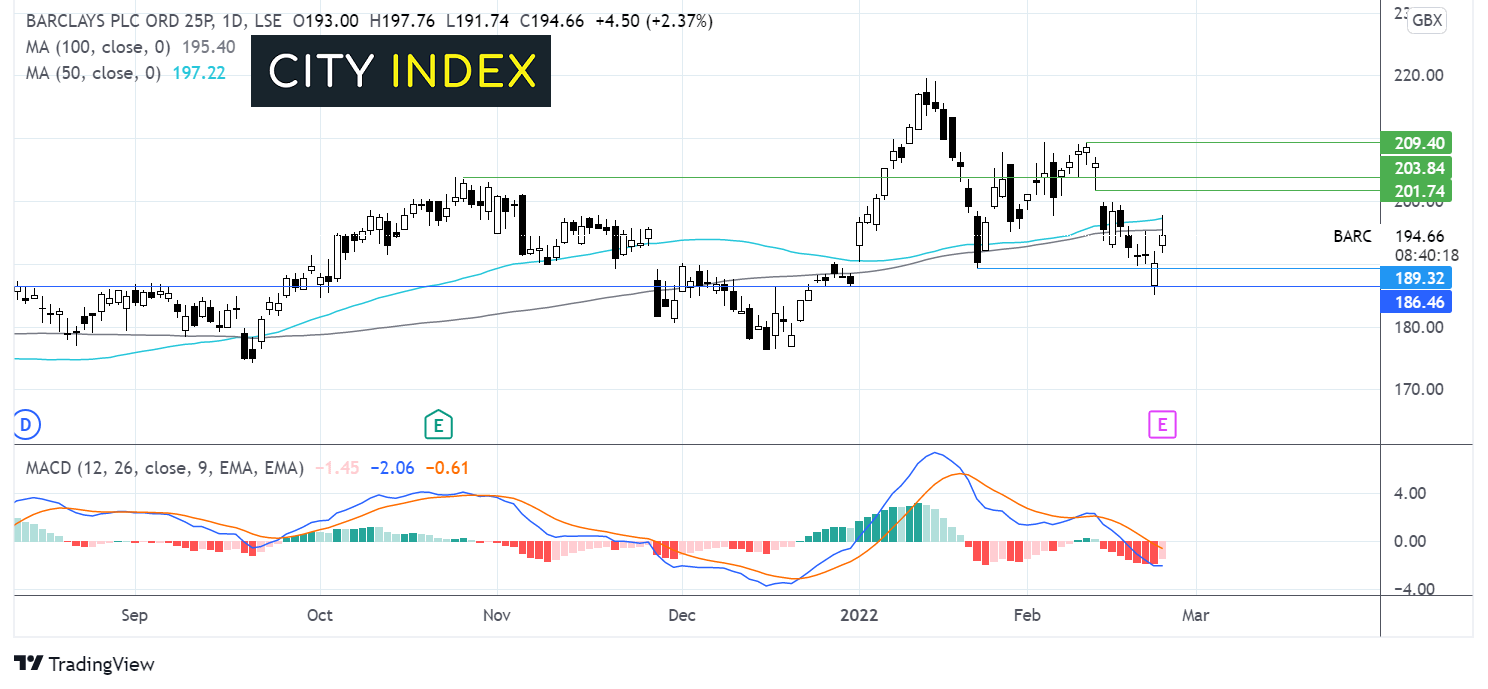
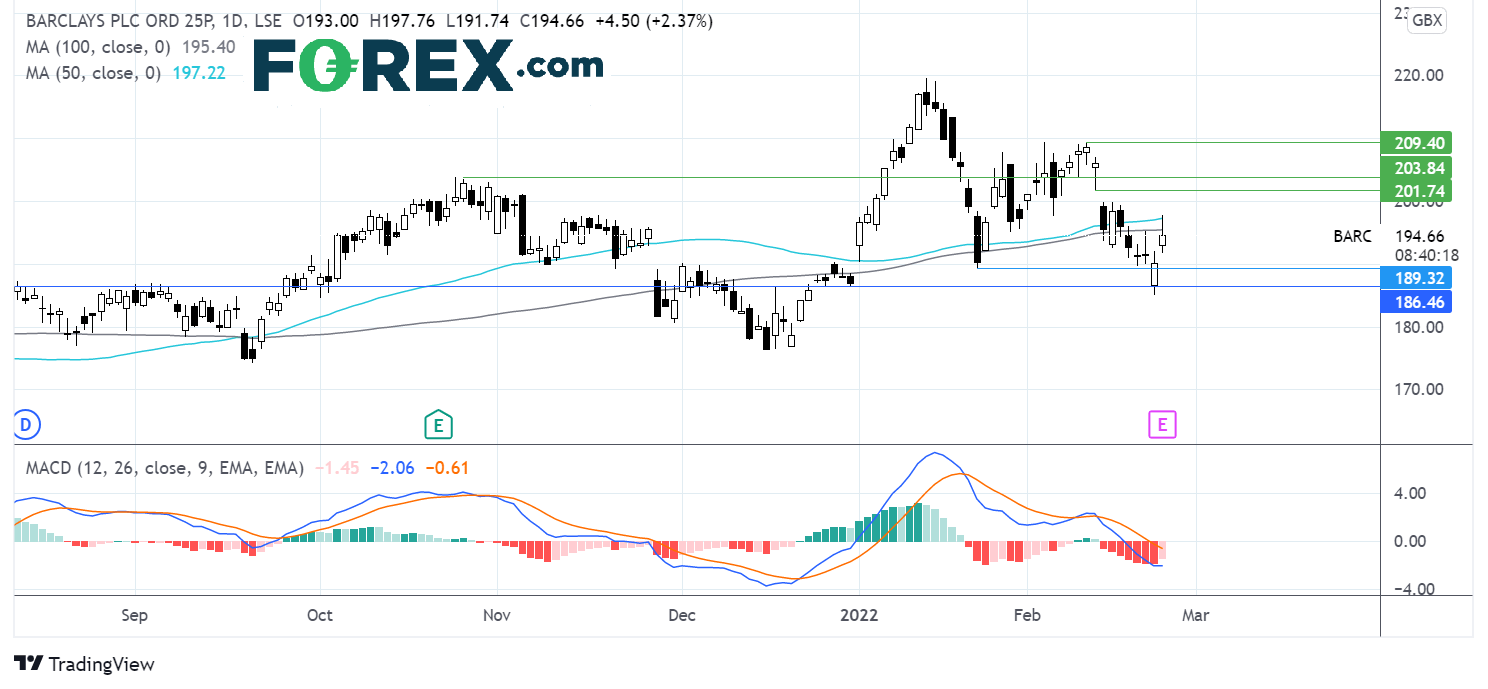
Barclays has been trending lower since mid- January, hitting a two-month low of 185p yesterday. Barclays has rebounded off that low and is attempting to re-take its 50 & 100 sma.
The receding bearish bias on the MACD is giving buyers hope of further gains. However, the long upper wick suggests that the stock failed to find much acceptance at the 198p level.
Failure to re-take the 50 & 100 sma could see the share price fall back towards 190p ahead of yesterday’s low of 185p.
A close above the 50 & 100 sma would be significant and could see buyers look to break above 200p round number and 203p the October high. A move over 209p could see the bias turn bullish.
How to trade with City Index
Follow these easy steps to start trading with City Index today:
- Open a City Index account, or log-in if you’re already a customer.
- Search for the market you want to trade in our award-winning platform.
- Choose your position and size, and your stop and limit levels
- Place the trade.
Latest market news



Open an account today
Experience award-winning platforms with fast and secure execution.
Economic calendar
Web Trader platform
Our sophisticated web-based platform is packed with features.
Related articles
Rates Shock, Metals Rout Leave Aussie Dollar Under the Pump
The global environment is becoming increasingly hostile for the Aussie. With AUD/USD breaking major support and AUD/JPY threatening further downside, today's jobs report faces an uphill battle to change the picture.


Euro Short-term Outlook: EUR/USD Plunges to 19-Month Low—Bears Face Critical Test 11 18 2026
The Euro selloff is now approaching pivotal support, raising the prospect of downside exhaustion as the November decline extends.


Japanese Yen Technical Outlook: USD/JPY Rally Stalls Near 160—Breakout Support in Focus 11 18 2026
USD/JPY has set its weekly range just above former resistance, with a range break likely to determine whether November’s rally has further to run.
From time to time, StoneX Financial Pty Ltd (“we”, “our”) website may contain links to other sites and/or resources provided by third parties. These links and/or resources are provided for your information only and we have no control over the contents of those materials, and in no way endorse their content. Any analysis, opinion, commentary or research-based material on our website is for information and educational purposes only and is not, in any circumstances, intended to be an offer, recommendation or solicitation to buy or sell. You should always seek independent advice as to your suitability to speculate in any related markets and your ability to assume the associated risks, if you are at all unsure. No representation or warranty is made, express or implied, that the materials on our website are complete or accurate. We are not under any obligation to update any such material.
As such, we (and/or our associated companies) will not be responsible or liable for any loss or damage incurred by you or any third party arising out of, or in connection with, any use of the information on our website (other than with regards to any duty or liability that we are unable to limit or exclude by law or under the applicable regulatory system) and any such liability is hereby expressly disclaimed.