u s stock focus bullish breakout seen in citigroup 2693482017
Medium-term technical outlook on Citigroup (C) (Click to enlarge charts) Key technical elements Since its 27 June 2016 low of 38.31, Citigroup has […]

Medium-term technical outlook on Citigroup (C) (Click to enlarge charts) Key technical elements Since its 27 June 2016 low of 38.31, Citigroup has […]

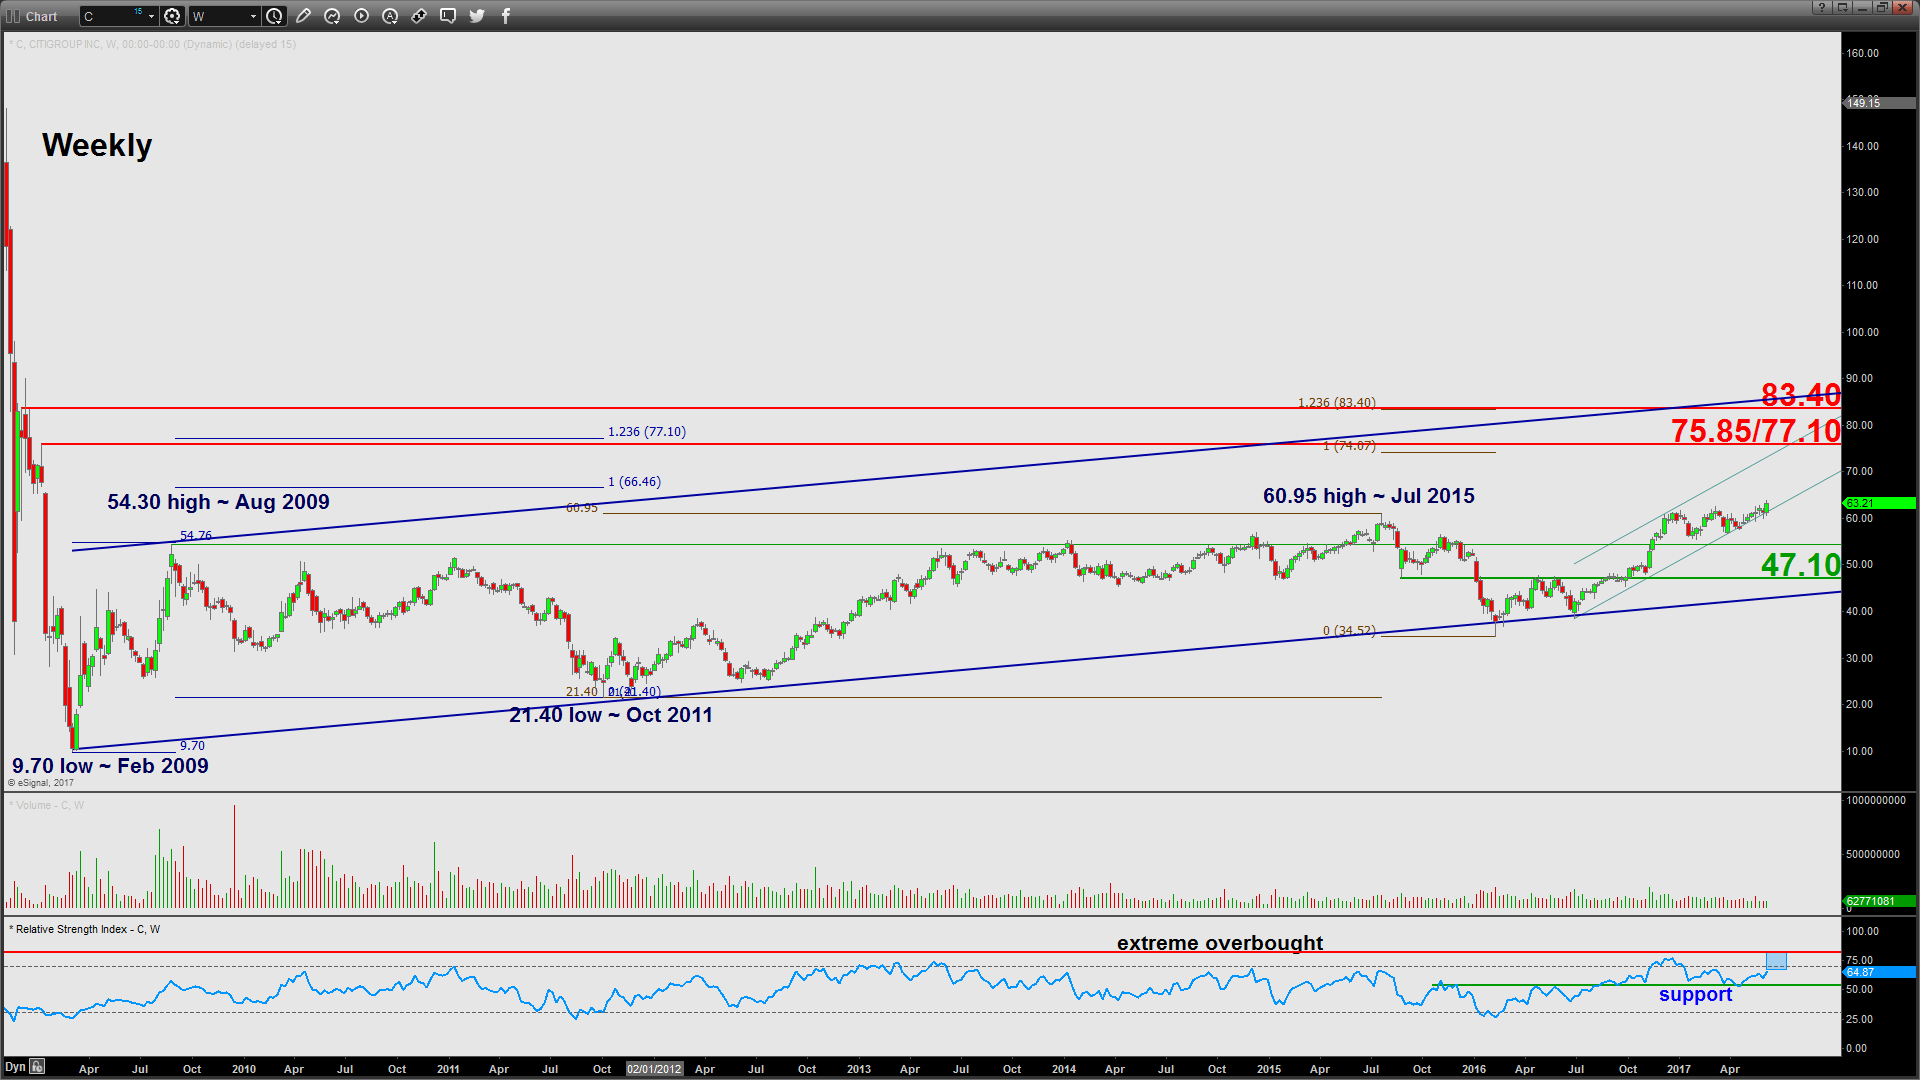
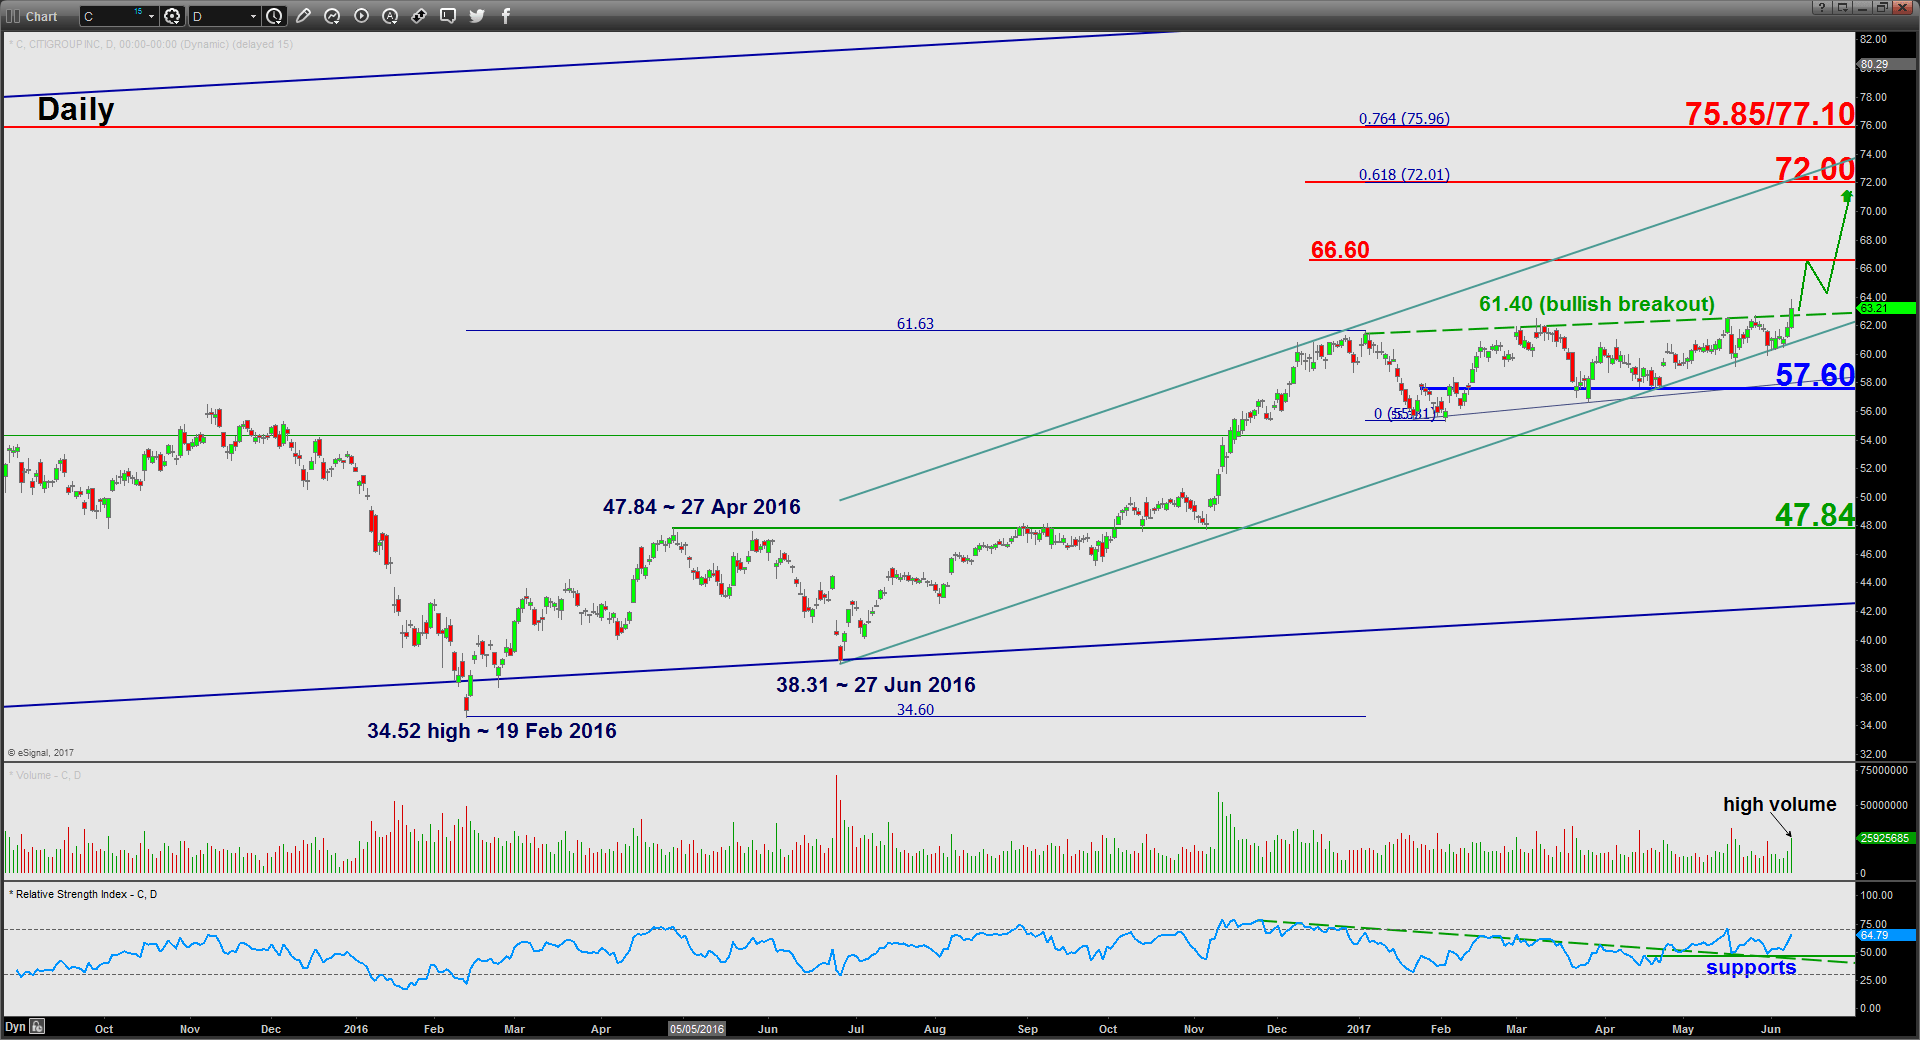
 (Click to enlarge charts)
Intermediate support: 61.40
Pivot (key support): 57.60
Resistances: 66.60, 72.00 & 75.85/77.10
Next support: 47.84
Conclusion
In the last five trading days, the S&P 500 Financials as represented by its ETF (XLF) had started to outperform the benchmark S&P 500 where it recorded a gain of 1.27% versus a meagre return of 0.15% seen in the S&P 500. Thus, upside momentum has started to revive in the Financials (XLF) which is the leading sector since the post U.S. presidential election before it started to shed its outperformance against the S&P 500 from March 2017 due to a potential delay in President Trump’s proposed policies on financial deregulations and a flat yield curve seen in the U.S. Treasuries.
One particular stock to take note will be Citigroup (C) where relative strength analysis continues to advocate further outperformance against its Financials sector benchmark (XLF). Technical elements of the stock also continue to display positive signs of momentum. Thus, as long as the 57.60 pivotal support holds, Citigroup is likely to see a further up move to target the next resistances at 66.60 and 72.00.
On the other hand, failure to hold above 57.60 may invalidate the preferred bullish bias to open up scope for a corrective decline towards the next support at 47.84 (the previous swing high areas of 27 Apr/25 May 2016).
Charts are from eSignal
Disclaimer
The material provided herein is general in nature and does not take into account your objectives, financial situation or needs. While every care has been taken in preparing this material, we do not provide any representation or warranty (express or implied) with respect to its completeness or accuracy. This is not an invitation or an offer to invest nor is it a recommendation to buy or sell investments. City Index recommends you to seek independent financial and legal advice before making any financial investment decision. Trading CFDs and FX on margin carries a higher level of risk, and may not be suitable for all investors. The possibility exists that you could lose more than your initial investment further CFD investors do not own or have any rights to the underlying assets. It is important you consider our Financial Services Guide and Product Disclosure Statement (PDS) available at www.cityindex.com.au, before deciding to acquire or hold our products. As a part of our market risk management, we may take the opposite side of your trade. GAIN Capital Australia Pty Ltd (ACN 141 774 727, AFSL 345646) is the CFD issuer and our products are traded off exchange.





