- US CPI KEY TAKEAWAYS
- When is the US CPI report?
- What are the US CPI Report Expectations?
- US CPI Forecast
- US Dollar Index Technical Analysis – DXY Daily Chart
US CPI KEY TAKEAWAYS:
- US CPI expectations: 2.7% y/y headline inflation, 3.0% y/y core inflation
- The recent trend of “disinflation”, or fading price pressures, is likely to at least partially reverse this month.
- The price action in the US Dollar Index (DXY) could potentially set the stage for the greenback to roll over for another leg lower, especially if inflation comes in below expectations.
When is the US CPI report?
The US CPI report for June will be released at 8:30ET (12:30 GMT) on Tuesday, July 14.
What are the US CPI Report Expectations?
Traders and economists are projecting headline CPI to come in at 2.7% y/y, with the core (ex-food and -energy) reading expected at 3.0% y/y.
US CPI Forecast
US inflation, at least on an annualized basis, has moderated nicely toward the Federal Reserve’s 2% target so far this year. From a starting point of 3.0% y/y, the headline Consumer Price Index (CPI) fell as low as 2.3% two months ago before ticking up again last month. Meanwhile, Core CPI, which filters out more volatile food and energy prices to better show the underlying trend in prices, has receded from 3.3% to hold at a 4-year low of 2.8% y/y in each of the past three months.
That’s the good news for the Fed. The bad news is that that trend of “disinflation”, or fading price pressures, is likely to at least partially reverse this month.
As we noted last week, the culprit is more of a mechanical issue than anything: Every month, the year-over-year inflation rate is recalculated on the basis of the last 12 month-over-month readings as the one-year-ago reading (in this case, last June’s -0.1% print) falls out of the calculation and a new monthly reading is added.
With a -0.1% m/m reading dropping out of the calculation, anything higher than that – even a flat 0.0% m/m print – will drag the annualized inflation reading higher in a so-called “base effect.” This month marks the peak impact of this phenomenon, with four months of 0.2% m/m readings set to replaced after this month.
Of course, the Federal Reserve and other policymakers are well aware of the base effect phenomenon, but with the still looming threat of century-high tariffs on the rest of the world, Jerome Powell and Company can’t afford to be seen cutting interest rates while inflation is “rising.” That’s why traders are pricing in only a sliver of a chance (~5%) of a July reduction in interest rates:

Source: CME FedWatch
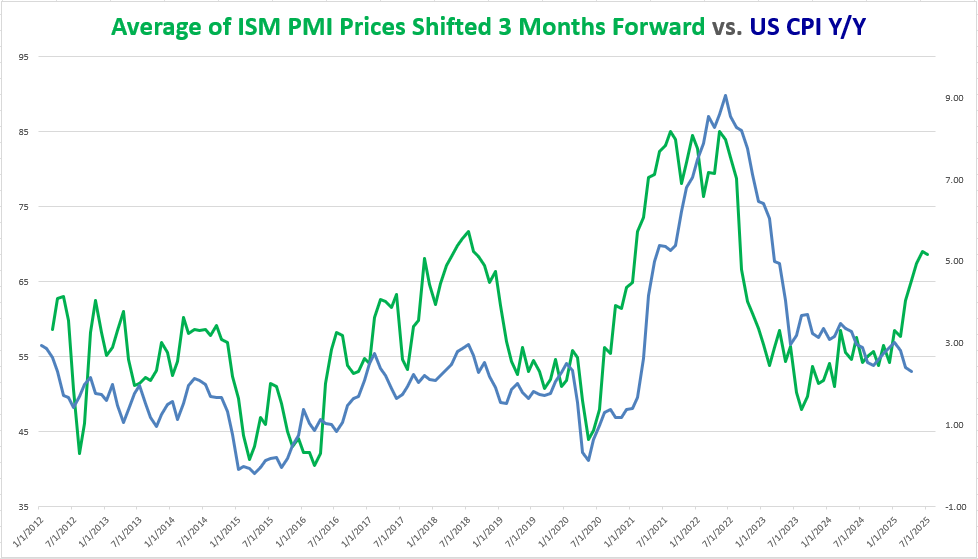
As many readers know, the Fed technically focuses on a different measure of inflation, Core PCE, when setting its policy, but for traders, the CPI report is at least as significant because it’s released weeks earlier. As we noted above, CPI has generally ticked lower so far this year, but it remains stubbornly above the Fed’s 2% target:
Source: TradingView, StoneX
Looking at the chart above, the “Prices” component of the PMI reports has accelerated sharply higher over the last couple of months, and even before the Trump administration’s tariffs were formally announced (and subsequently paused). Despite signs of slowing economic growth, firms are having to pay up for goods and services amidst the ongoing uncertainty around trade policy, likely putting upward pressure on the CPI report in the coming months.
US Dollar Index Technical Analysis – DXY Daily Chart
Source: TradingView, StoneX
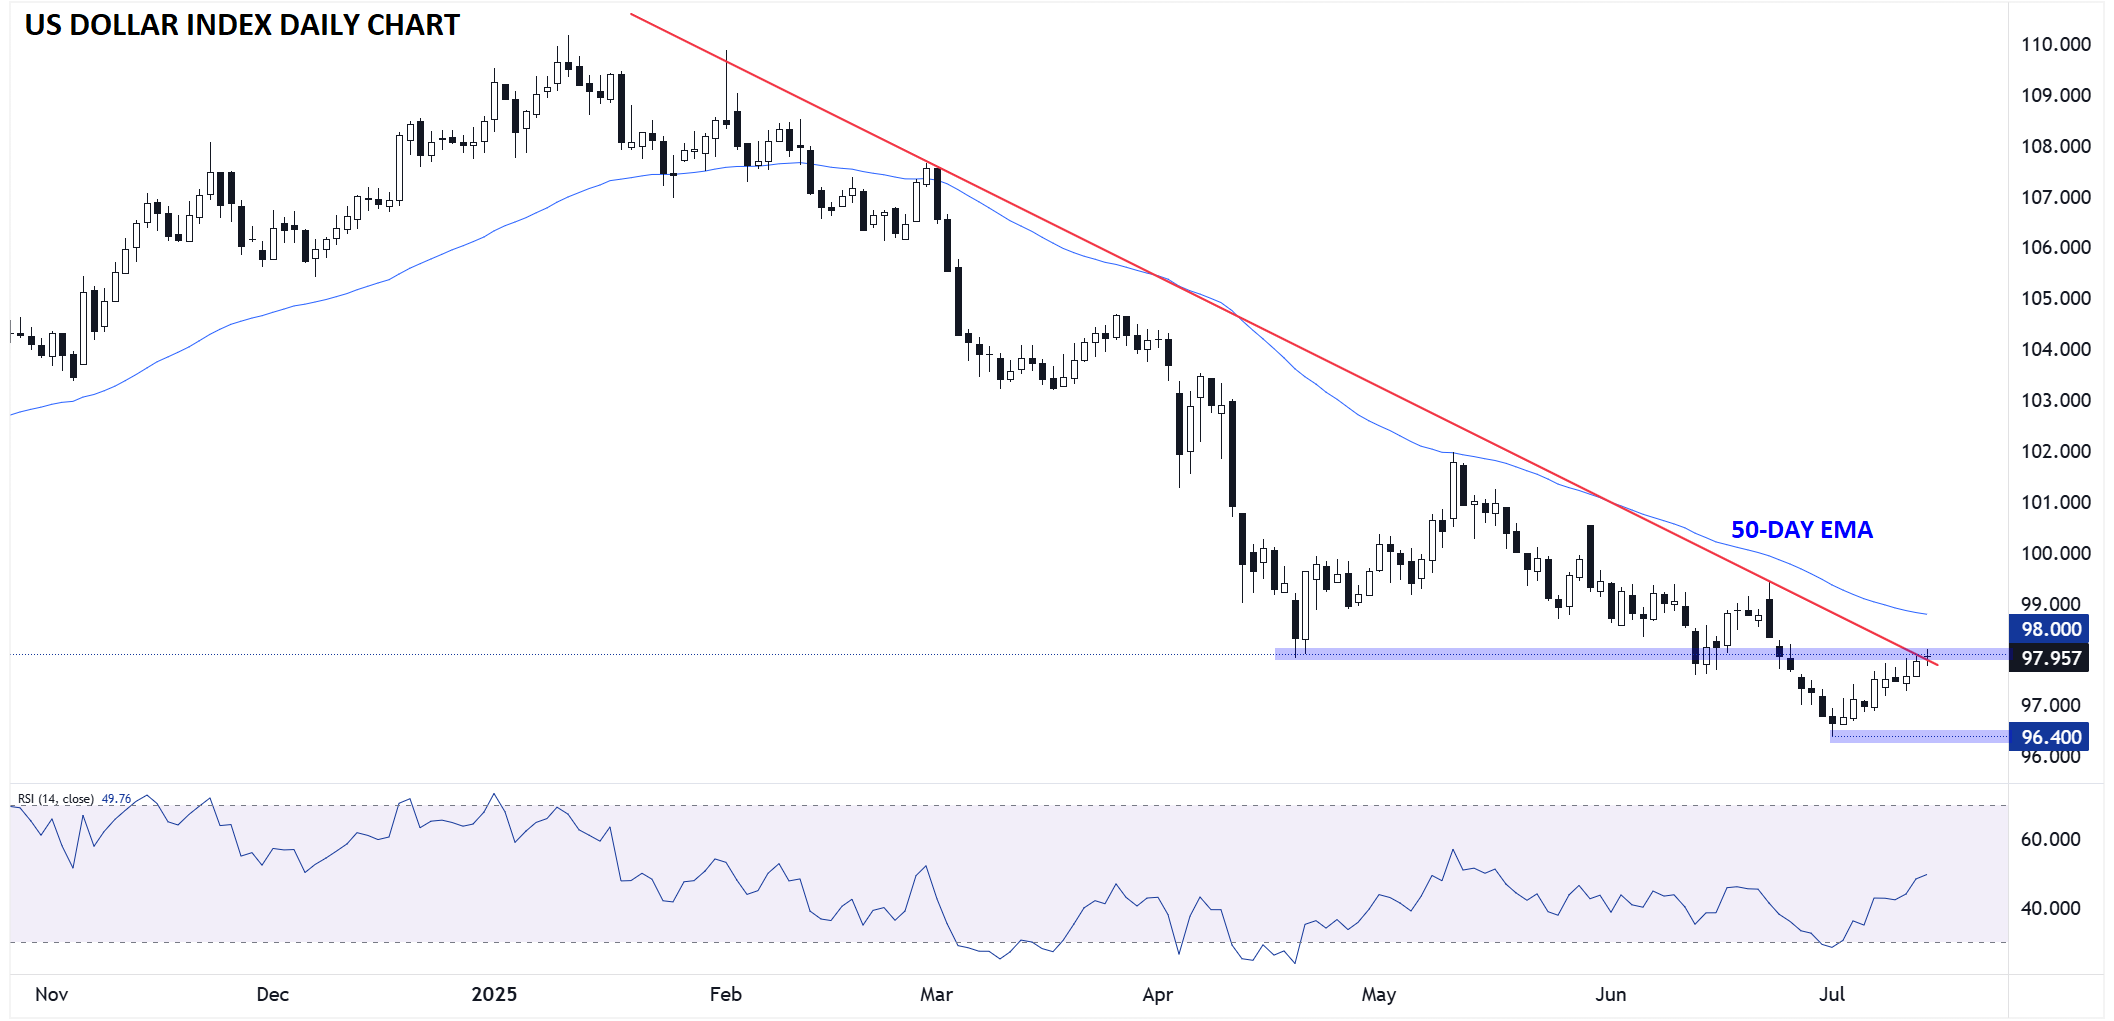
The US Dollar Index (DXY) has been grinding higher throughout the month of July to test the year-to-date bearish trend line near 98.00 as of writing.
So far, the counter-trend bounce has lacked substantial velocity, merely alleviating the oversold condition on the 14-day RSI without breaking the recent range (yet). This price action could potentially set the stage for the greenback to roll over for another leg lower, especially if inflation comes in below expectations.
Technically speaking, the April low around 98.00 is the most important previous-support-turned-resistance level to watch, whereas the nearest clear level of support comes from the early July low at 96.40.
In the current environment with the Fed almost certainly on hold until September, tariff headlines and any potential trade deals (especially with China) may be bigger market movers than this month’s inflation report, so it’s key to monitor developments on those fronts as well.
-- Written by Matt Weller, Global Head of Research
Check out Matt’s Daily Market Update videos on YouTube and be sure to follow Matt on Twitter: @MWellerFX