


Next week is Central Bank week as we hear from the Fed, ECB, BoE, BoJ and Bank of Canada. No actual moves are expected but what is being watched for is the hinting of future moves, particularly around the BoJ and ECB. Given the long built-in carry trade around the Japanese Yen a shifting fundamental backdrop there could have massive impact. And in Europe, the focus is on how impacted the economy might be from higher energy prices, and not just from direct energy prices, but in core inflation which normally strips out energy.
For the US Dollar, the trader’s directional stance is likely going to be dictated by their time frame or point of view. From the weekly we have an inside bar, and this takes on the tone of a spinning top which after a decisive sell-off, keeps the door open for turn potential. This would likely need to see Ueda and the BoJ refrain from any pledges towards near-term rate hikes and a push above the 160.00 handle in USD/JPY could certainly deliver a bullish jolt to the USD.
US Dollar Weekly Chart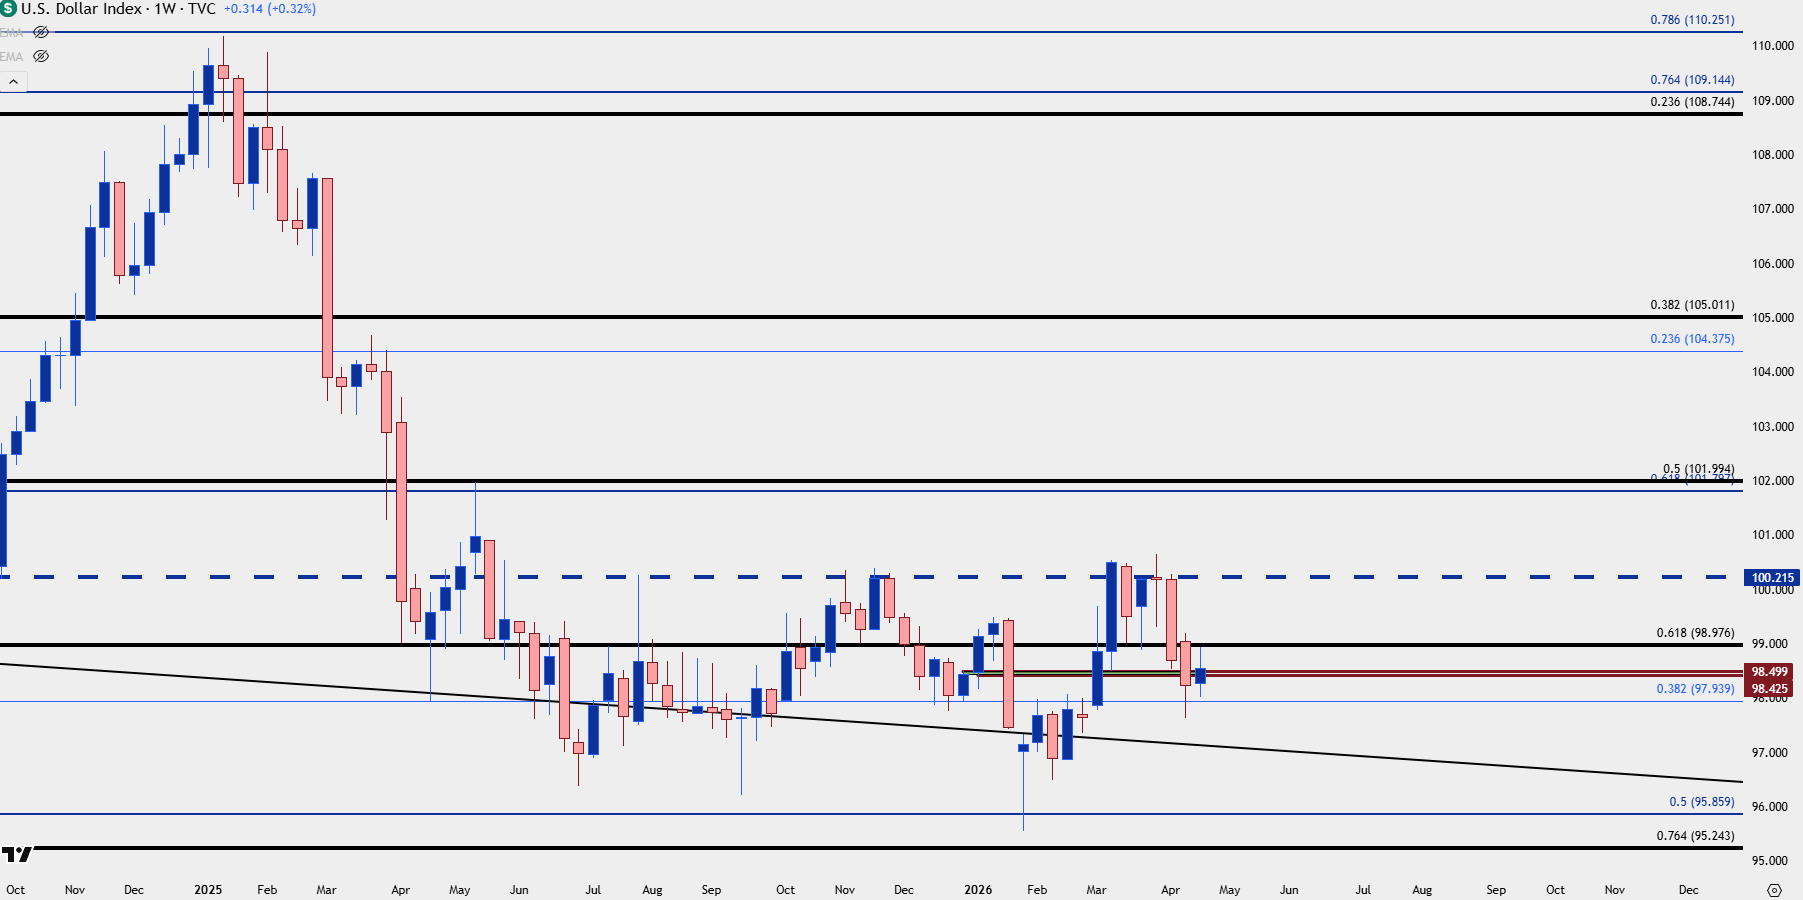
Chart prepared by James Stanley; data derived from Tradingview
US Dollar Daily
From the daily chart the Dollar still retains a bearish look, and that will likely remain the case until we see the gap from the ceasefire announcement encroached upon and that spans from 99.18 up to 99.48.
For USD-weakness, I still think this would need to be USD/JPY derived and if we have a hawkish Ueda, similar to what had showed in January, that could compel unwind in the carry trade that drives with it a decisive move of weakness in the USD. In that scenario, I still think EUR/USD and GBP/USD would be ‘cleaner’ areas to work with that theme as trying to jump on a falling knife in an unwinding carry trade can be challenging from a swing perspective.
US Dollar Daily Price Chart
Chart prepared by James Stanley; data derived from Tradingview
US Dollar Intra-Day
Shorter-term, just as I had shared in the Tuesday webinar, this retains a bullish look as given a series of higher-highs and higher lows following the vigorous defense in the prior week of the 97.94 Fibonacci level.
US Dollar Four-Hour Price Chart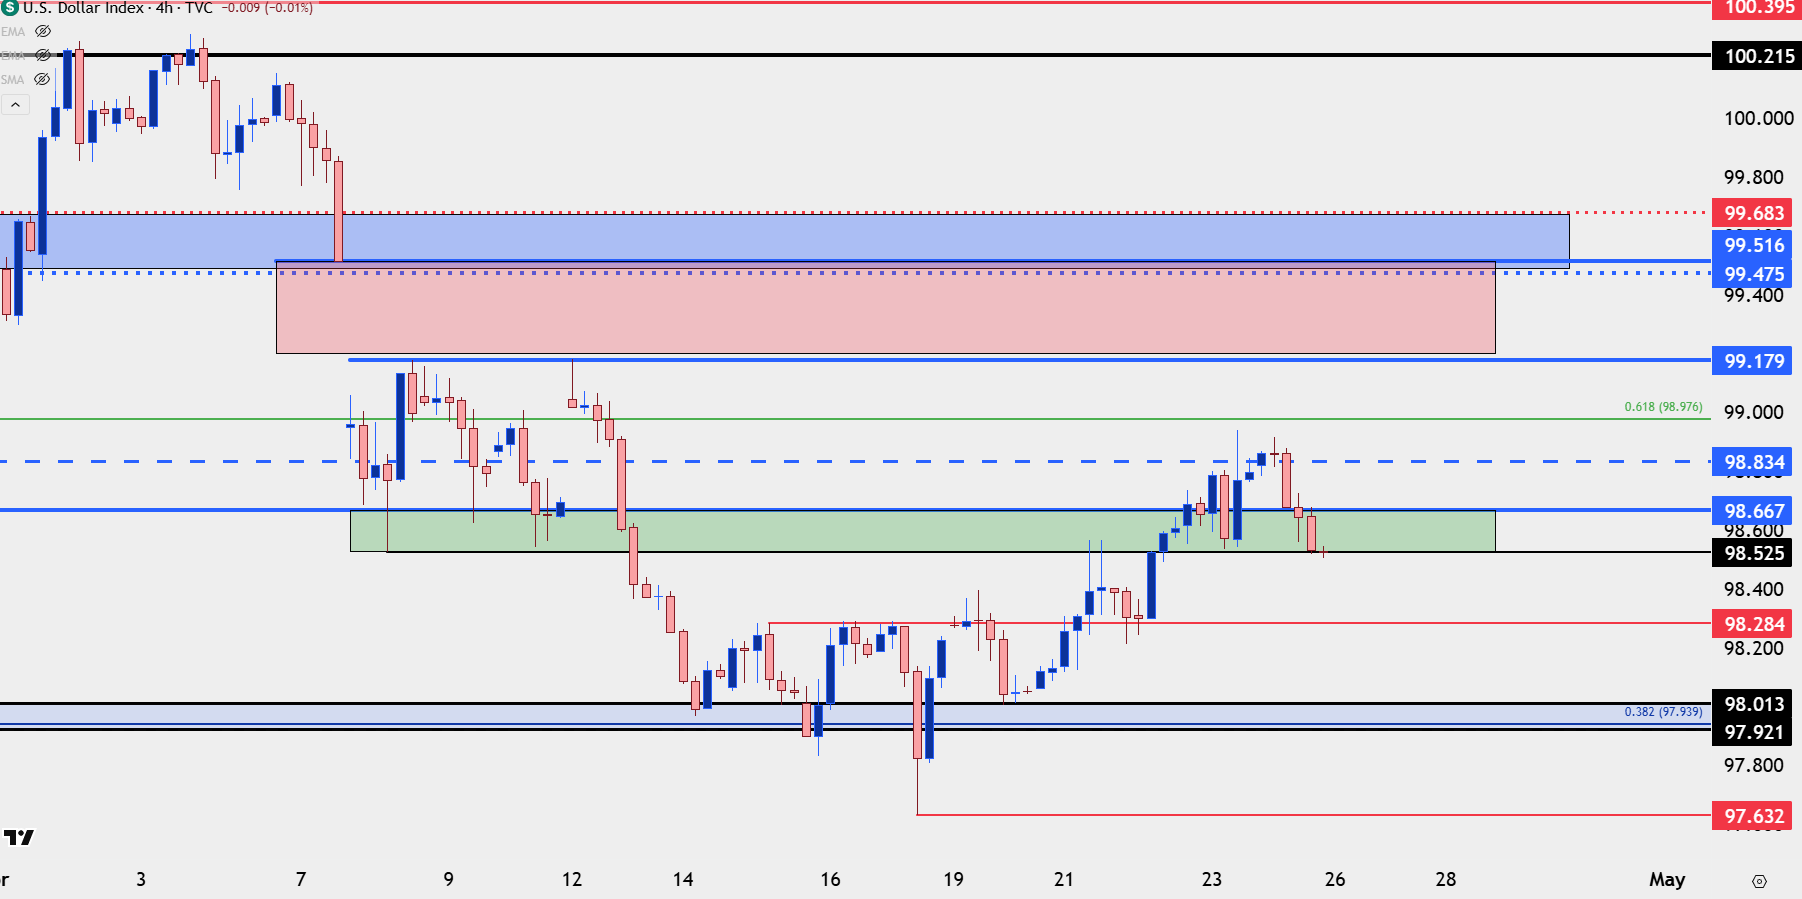
Chart prepared by James Stanley; data derived from Tradingview
EUR/USD
I think EUR/USD is a relatively clean mirror of the USD, at the moment, and like the DXY setup above, I think directional stance would be dictated by time frame and point of view. Bigger picture, I’m keeping this on the bearish side of the USD radar for now as I think there’s more attractive venues for USD-strength, which I’ll look at a bit lower. In EUR/USD, the price helping to produce today’s bounce is a key Fibonacci level from a longer-term setup, the same that I had looked at in last year’s Evergreen article on the topic with the 76.4% retracement plotting at 1.1686.
EUR/USD Daily Price Chart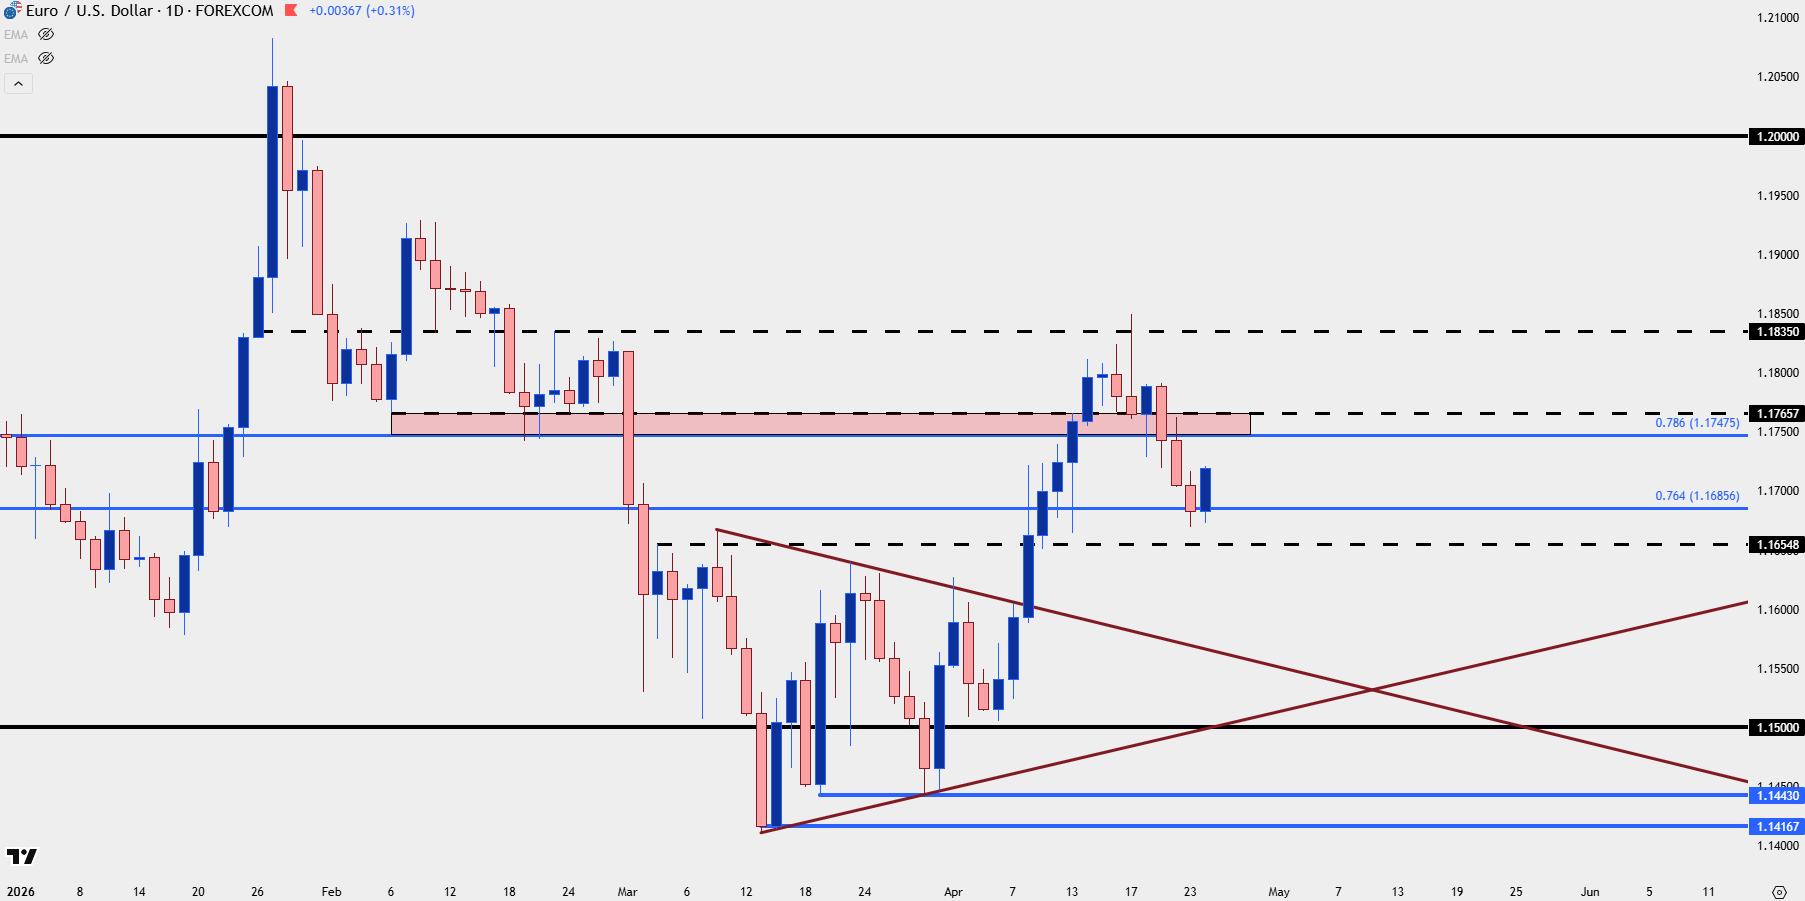
Chart prepared by James Stanley; data derived from Tradingview
GBP/USD
GBP/USD spent most of the week finding horizontal support at 1.3484, but sellers took a shot on Thursday and ended up failing to retain control. But that slowing from the sellers helped for a falling wedge formation to build, very similar to the wider, longer-term backdrop that led into April, and that’s so far led to bullish breakout. I still consider this as a touch more attractive than the above in EUR/USD for USD-weakness setups and for next week, that same zone of 1.3484-1.3500 sets up for higher-low support potential.
GBP/USD Four-Hour Price Chart
Chart prepared by James Stanley; data derived from Tradingview
USD/JPY
This is where the game is for the US Dollar next week, in my opinion. If Ueda spooks markets that the BoJ is looking at pushing more hawkish in the coming months, particularly if its something that amounts to more than just one rate hike, we can overlay that higher rate backdrop with an expected lower rate backdrop in the US to see a narrowing in the rate differential, which removes motivation for longs to hold on. This would be unlike Ueda, however, as he’s traditionally a conservative central banker that doesn’t seem to want to upset the elected officials that were put in power on a pro-growth platform.
If he does side step the issue, we could see that next test above the 160.00 handle and I think there’s probably some stops on short positions sitting above that price that, when triggered, push demand into the market – and that can mean breakout extension.
If the US Dollar is to rally next week I think it will need that scenario behind it, and given the range over the past six weeks, this is a coiled spring that’s ready to pop, in one direction or the other.
USD/JPY Daily Price Chart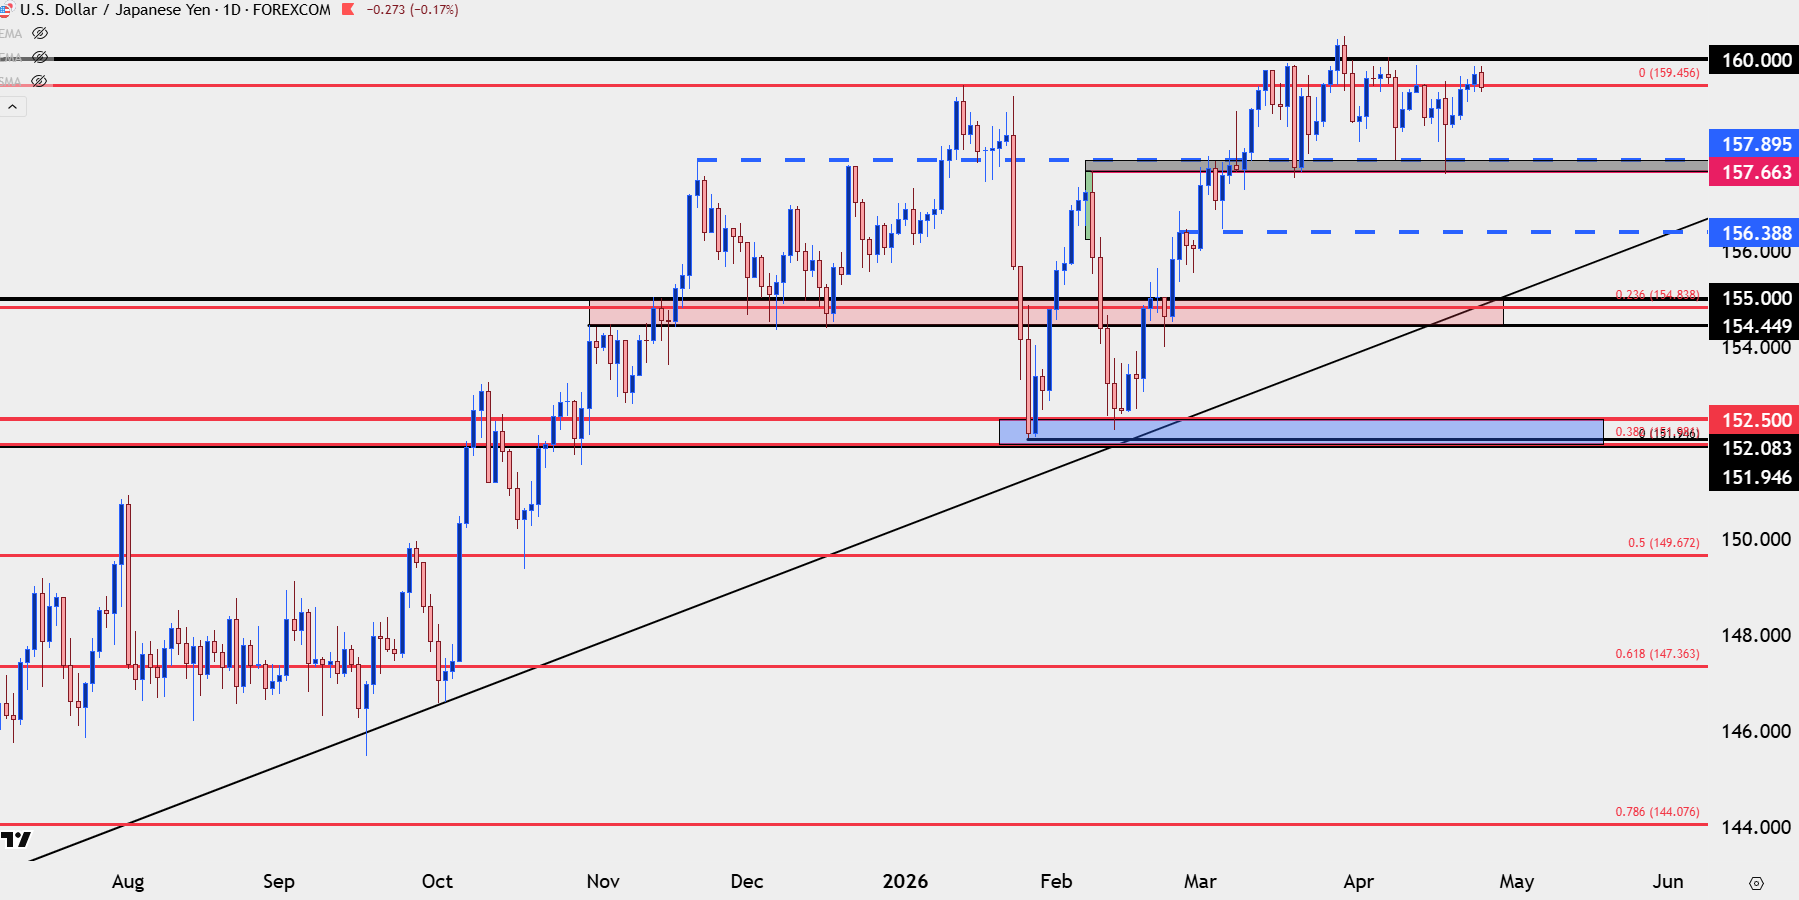
Chart prepared by James Stanley; data derived from Tradingview
USD/CAD
I had looked at this in the Tuesday webinar and, admittedly, it was pretty ugly at the time. The March breakout had quickly snapped back, and the prior support level of 1.3727 was sliced through. On Tuesday we had the deeper support zone in play and this was the same that had produced a bounce back in December. So far, it’s produced a second bounce and from the four-hour, bulls have prodded a higher-high. This keeps the door open for a bigger-picture rally in the pair following a few days of support hold at a key zone as we go into next week, with rate decision from both economies in the pair.
USD/CAD Four-Hour Price Chart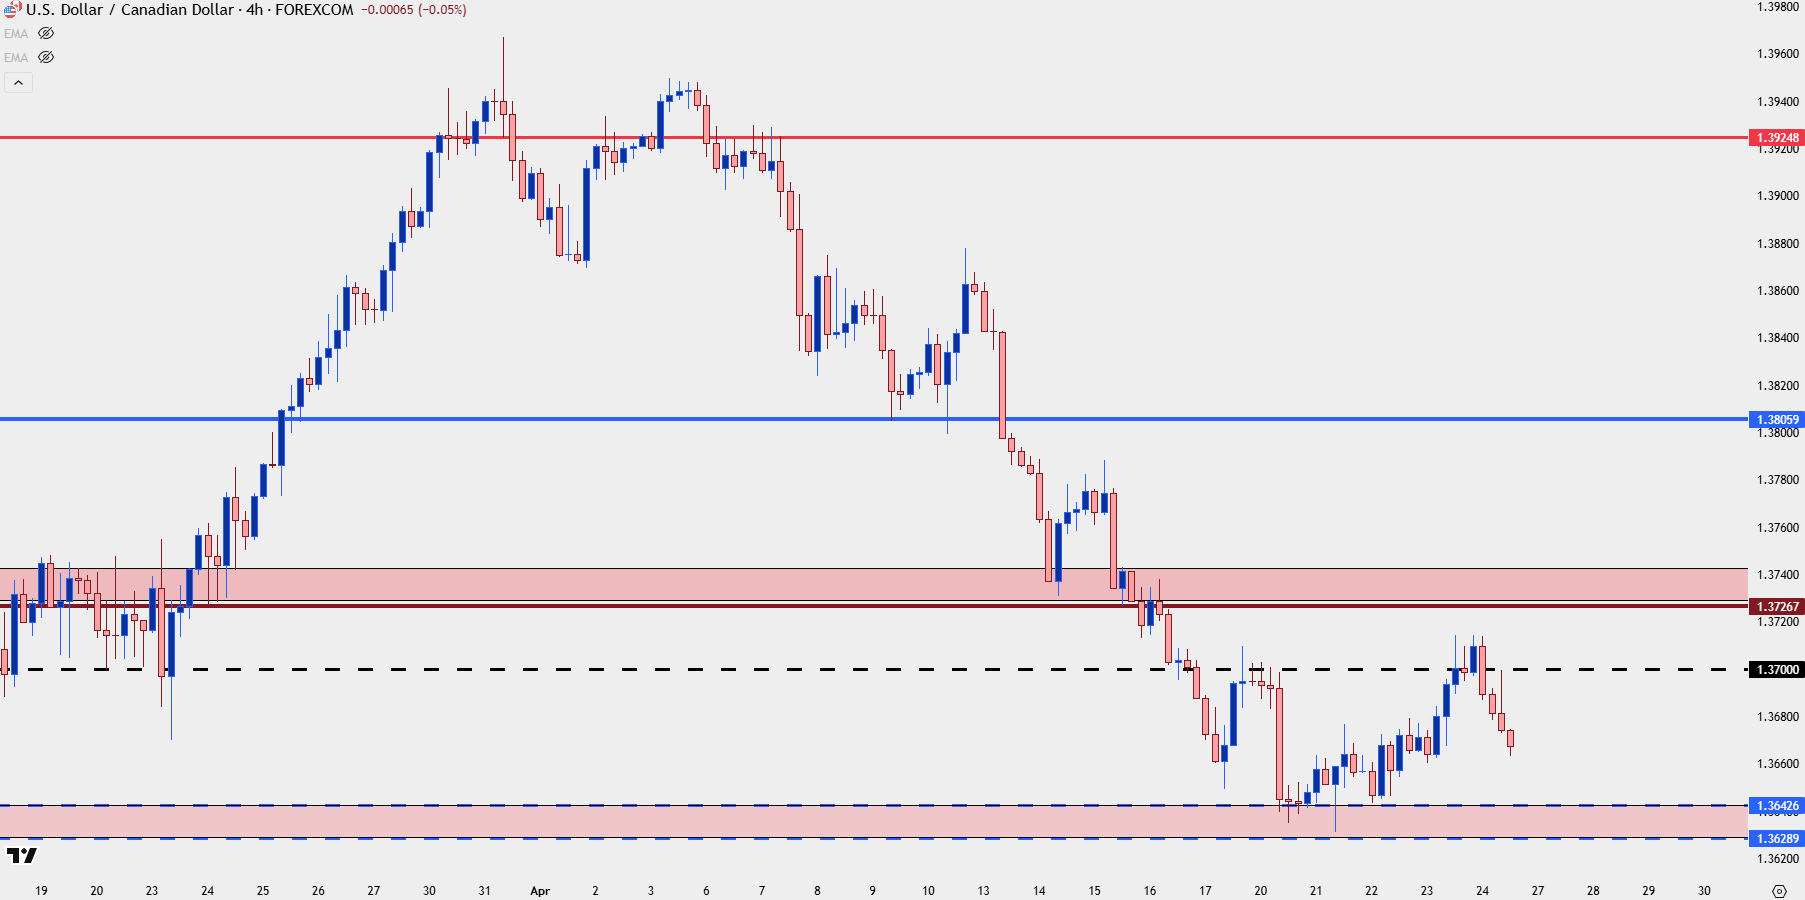
Chart prepared by James Stanley; data derived from Tradingview
--- written by James Stanley, Senior Market Analyst, Global Macro




