
US Dollar Talking Points:
- The US Dollar has so far stuck to a sequence of higher-highs and higher-lows ever since the reversal at the FOMC rate cut announcement two and a half weeks ago.
- The question now is whether USD bulls will be able to push up to fresh highs, and there’s a big spot of resistance nearing around the 99-handle.
- Despite the constant drumbeat of dovish FOMC and bearish USD items, DXY has been coiling into a falling wedge for the past four months, very similar to the shorter-term observation from Q3 of last year.
Can USD bulls finally press into a breakout? That’s the big question around the USD right now as the currency has continued with a series of higher-highs and lows since the reversal around the rate cut announcement in mid-September. On both the daily and weekly chart, a clean falling wedge has formed and this is very similar to the shorter-term formation of the same type from Q3 of last year. These formations are often approached with aim of bullish reversal as sellers’ trepidation at lows is a common first step to a bullish turn. That part has shown so far, but what hasn’t yet is the motivated bullish breakout upon tests of highs and the big line in the sand at the moment in DXY is at the 99-handle.
US Dollar Daily Chart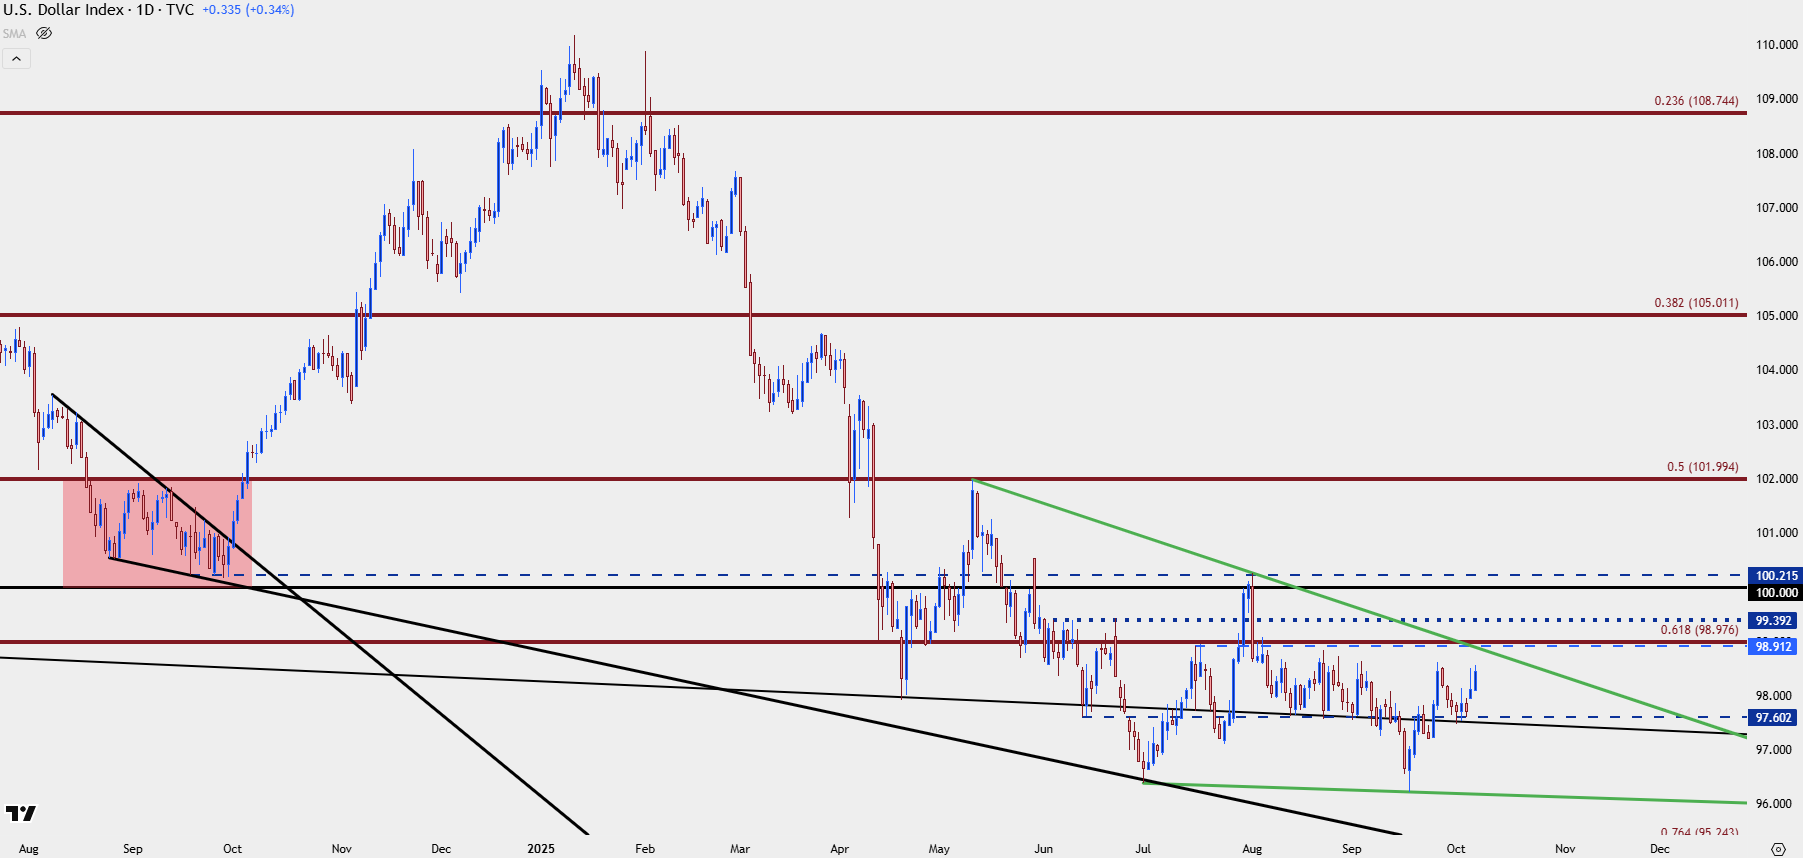
Chart prepared by James Stanley; data derived from Tradingview
USD Weekly
The falling wedge in DXY shows clearly on the weekly chart, which also illustrates the bigger picture move behind the Dollar so far this year. As we came into 2025 the USD was in a massively bullish state, but that soon reversed in Q1 and then Q2 as fears of recession took over. It’s at that point that rate cuts started to get priced in, helping to contribute to the decline. But, since the low in April, USD has largely been treading water, and as a case in point, DXY is currently above that April swing low.
US Dollar Weekly Chart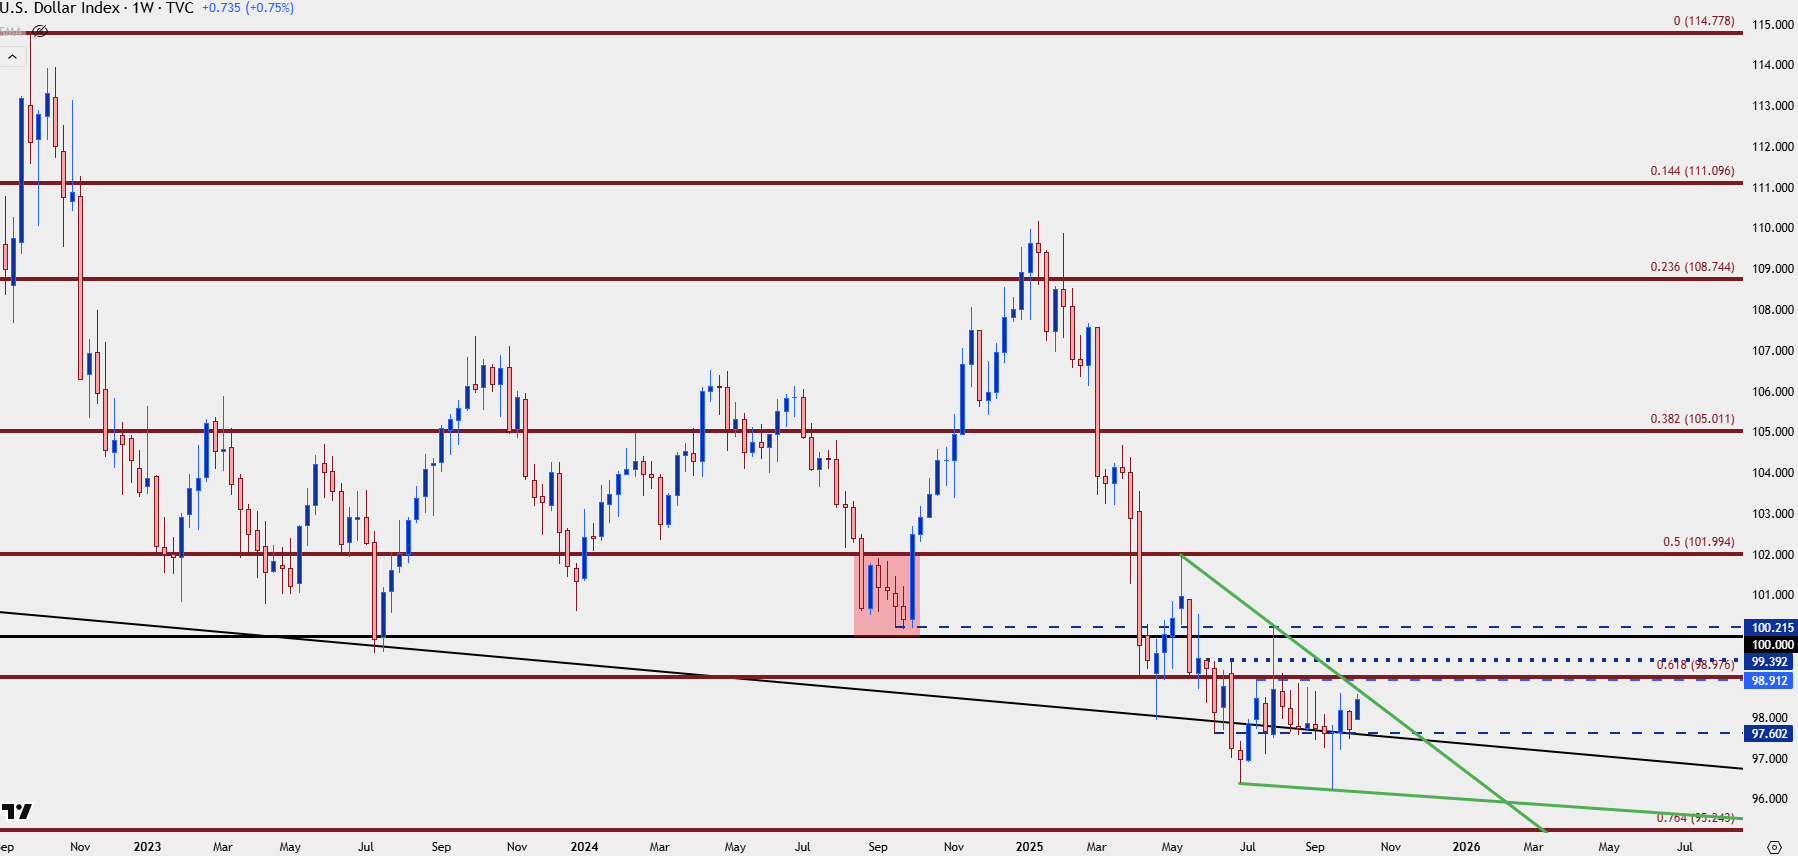
Chart prepared by James Stanley; data derived from Tradingview
EUR/USD
The Euro is a big part of DXY as the single currency is a 57.6% allocation of the Dollar basket. So, if we are to see a breakout in the Dollar we’re likely going to need to see weakness in the Euro; and similar to the mirror image of the DXY move above, sellers have shown trepidation of late.
The current four-year high was set on the rate cut announcement from the FOMC. That then led to a series of lower-lows and lower-highs, with another lower-high arriving last week at the 1.1780-1.1789 zone.
That keeps the door open for sellers but so far they’ve shown stall around the 1.1675-1.1686 support zone. In the webinar, I talked about a few different ways to approach the setup.
EUR/USD Daily Chart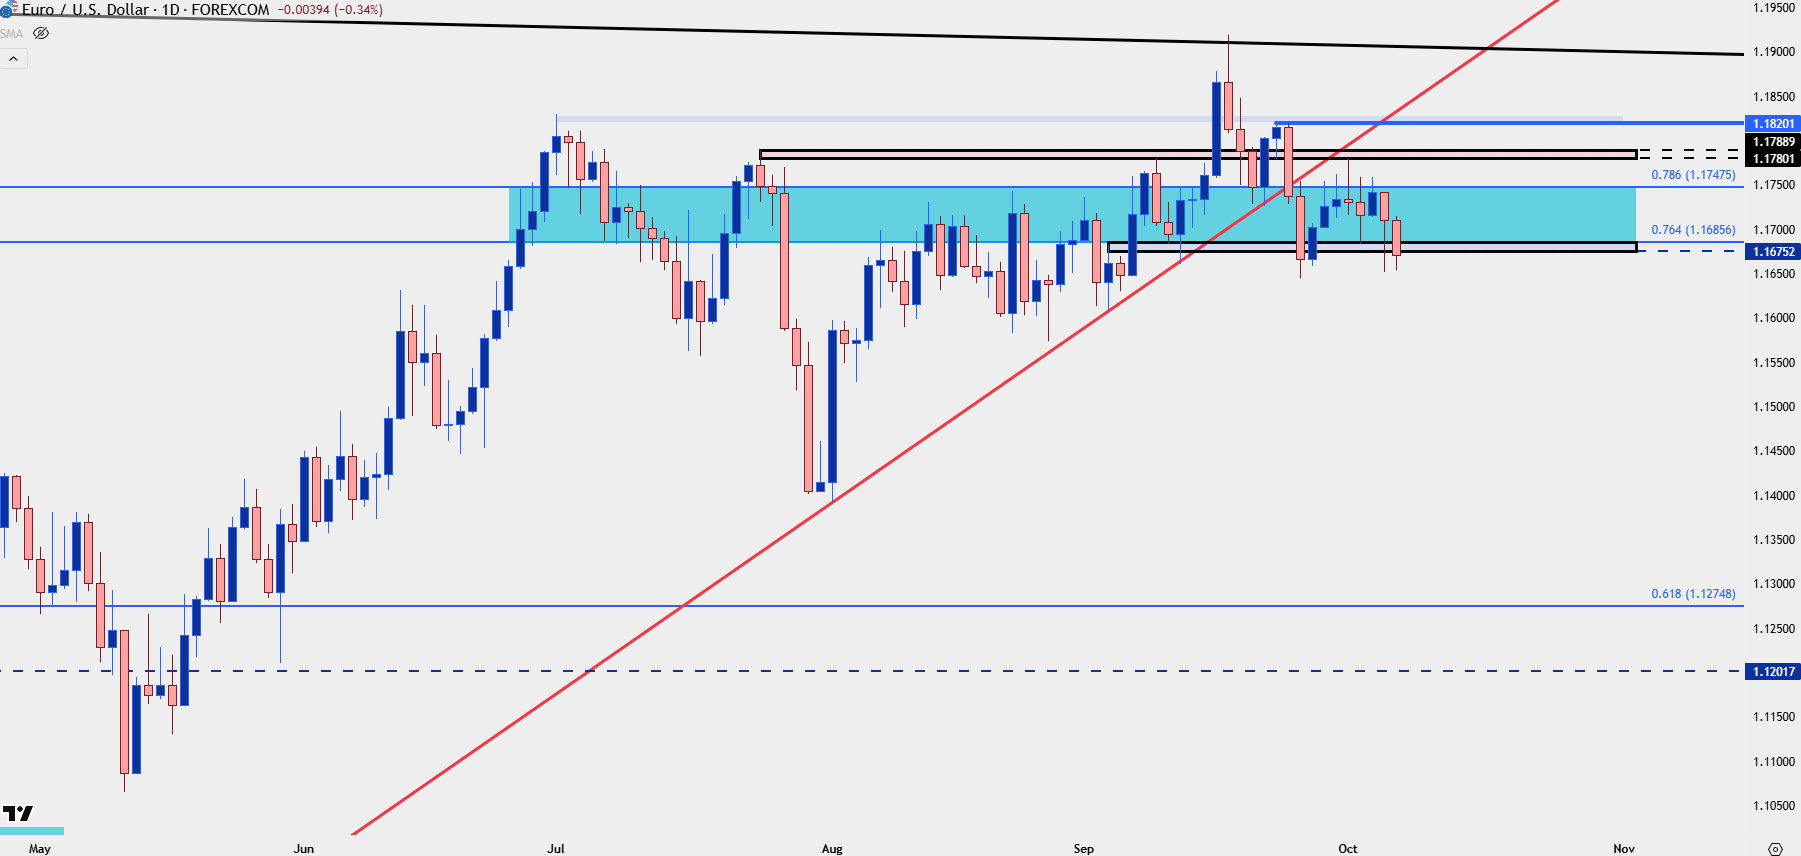
Chart prepared by James Stanley; data derived from Tradingview
GBP/USD
I like GBP/USD a bit more for USD-weakness scenarios and one simple observation helps to explain why. In the above chart EUR/USD is holding resistance and possible lower-highs at the 76.4 and 78.6% Fibonacci retracements of the 2021-2022 major move.
GBP/USD, on the other hand, is holding support at its 76.4 and 78.6% retracements of the 2021-2022 major move. This was also resistance from last year, in Q3 just before the reversal took hold, so there can even be a claim of bullish structure to work with here that isn’t quite as clear in EUR/USD at the moment.
GBP/USD Daily Chart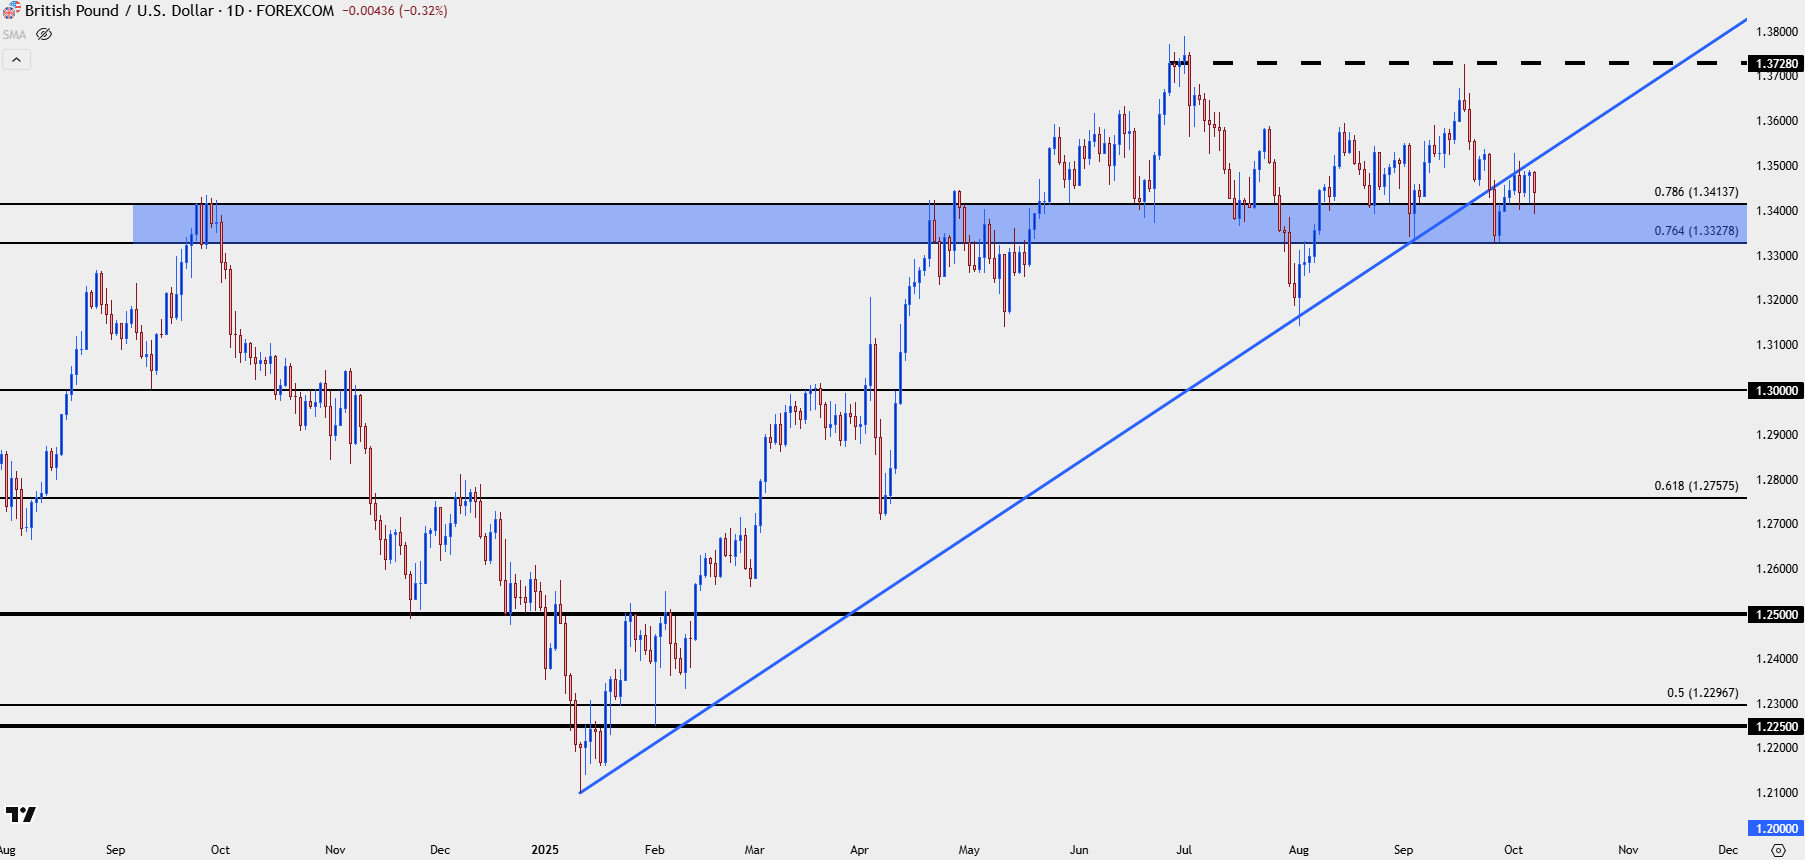
Chart prepared by James Stanley; data derived from Tradingview
USD/CAD
I still consider USD/CAD to be one of the cleaner major pairs for USD-strength scenarios. The pair has so far stalled ahead of a 1.4000 test but the fact that last week’s bar closed green even as DXY finished red further highlights the addition of Canadian Dollar weakness.
In the webinar, I went over a shorter-term way to work with the trend, highlighting a couple of key areas to track for higher-low support potential, similar to what I was looking at back in September when we had support at prior resistance around the 1.3750 area.
USD/CAD Daily Chart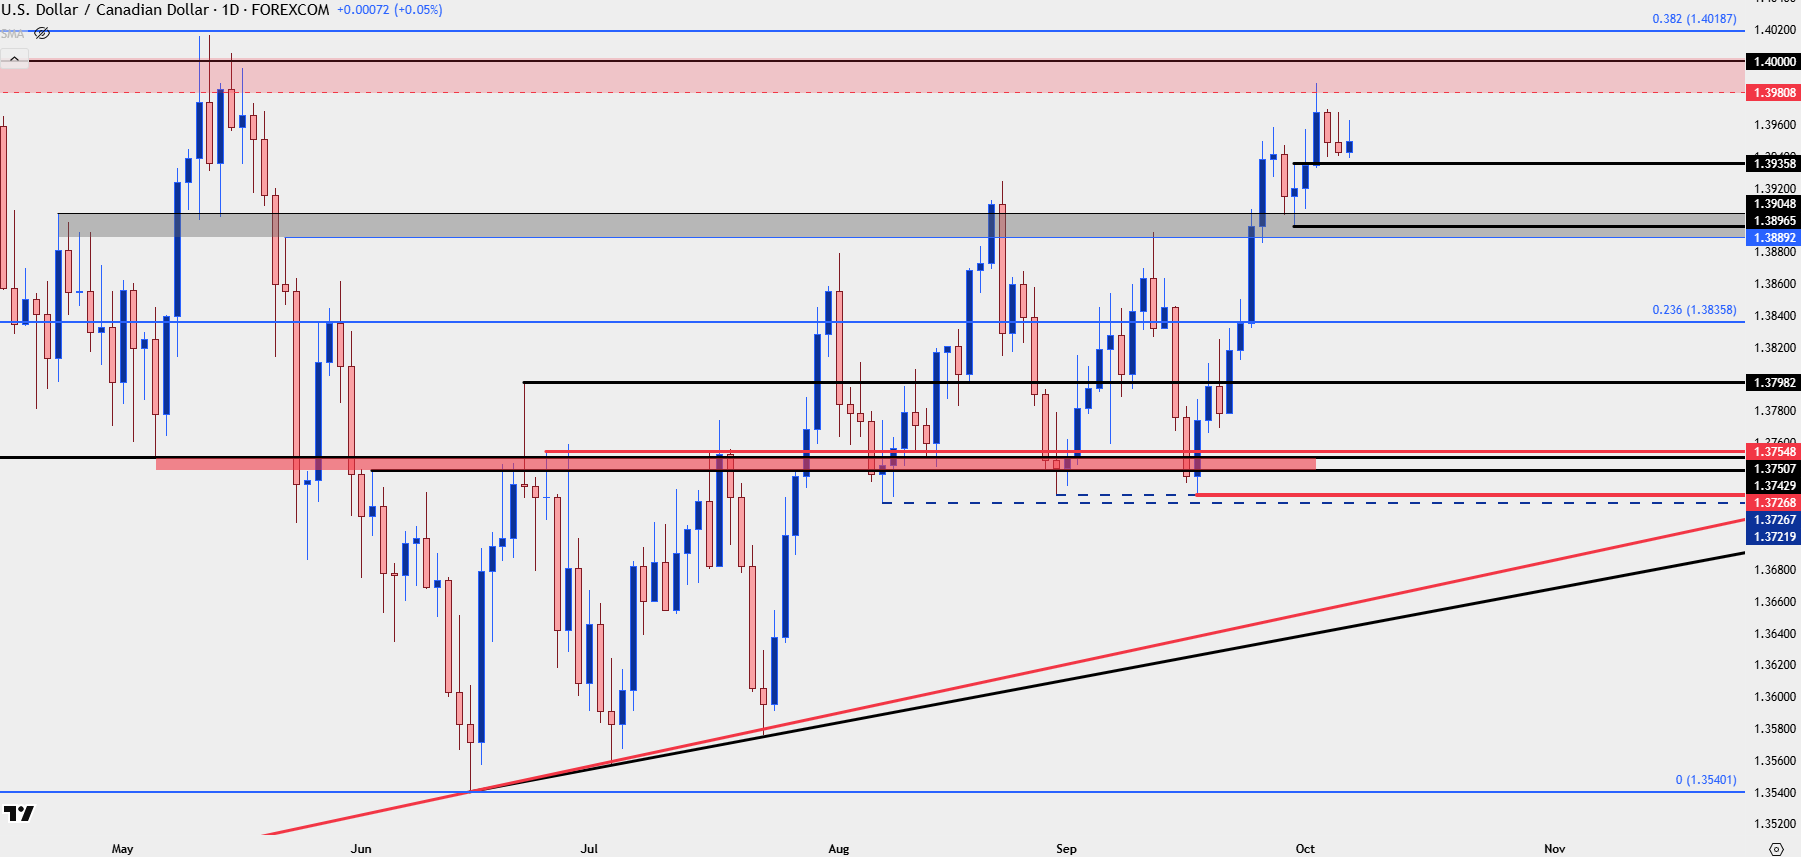
Chart prepared by James Stanley; data derived from Tradingview
USD/JPY
Ever since that April inflection in macro markets there’s been a growing case of divergence between DXY and USD/JPY.
That theme went into another gear this week when USD/JPY broke out and as I’ve been highlighting, that Yen-weakness has been an attractive theme elsewhere, as well. GBP/JPY is showing acceptance over the 200 handle and EUR/JPY over the 175.00 level. In USD/JPY, it’s the 150.00 level that looms larger and this keeps the door open for bulls.
USD/JPY Daily Chart
Chart prepared by James Stanley; data derived from Tradingview
--- written by James Stanley, Senior Strategist