
This webinar covered a wide range of topics and we’re on the eve of the Q2 open which brings an extra element of volatility. Many of the trends that have been pushing over the past month have pared back and already a lot of hope has hit the headlines. But, more reasonably, we’re seeing some profit taking ahead of quarter-end on some of the moves that have been most clear, such as the sell-off in stocks or the rally in the US Dollar.
As covered in this webinar, the big push point remains in a bullish stance as US Oil prices have held support at the 100-handle. This is a major deal as WTI was faded hard from those tests coming into this week but, so far for the past couple of days that line in the sand has held the lows indicating that the tensions around the Strait of Hormuz may not yet be on the downswing.
I wrote about this yesterday and since then, the $105 level discussed that piece has held resistance.
WTI Crude Oil Four-Hour Chart, Holding $100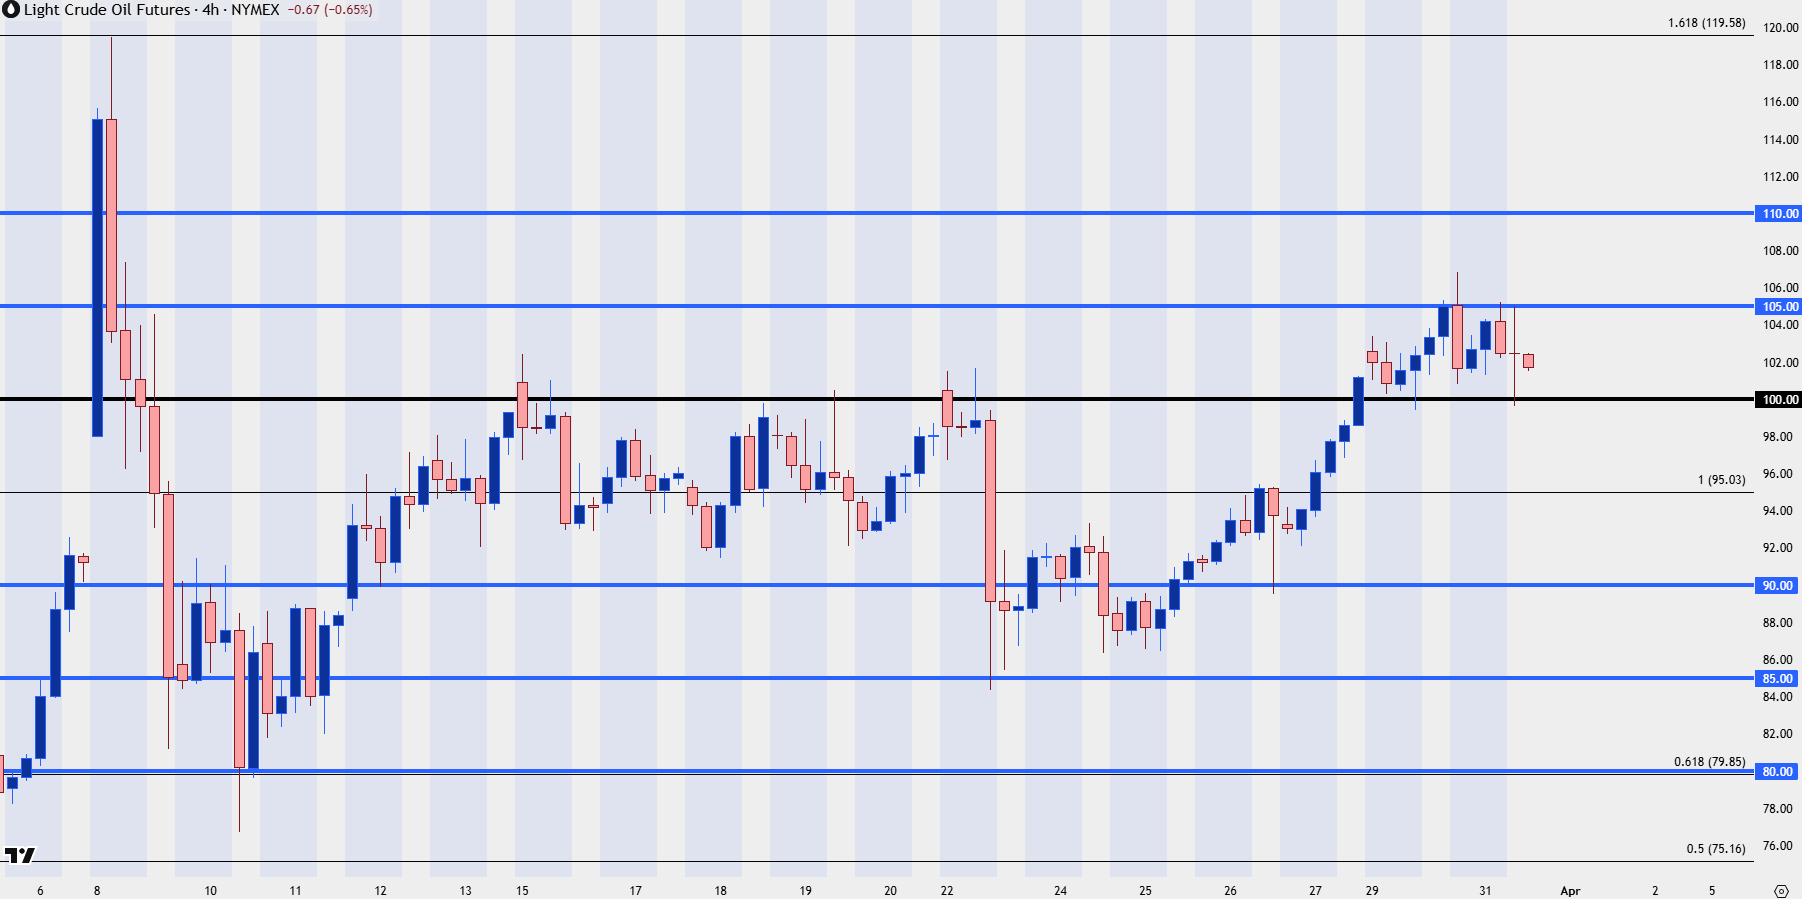
Chart prepared by James Stanley; data derived from Tradingview
Stocks
In equities, this year’s Q2 bears similarity to last year’s Q2, where a strong sell-off developed after indices started to show symptoms of stalling in January and February. And last year, as we came into Q2, it felt a bit like trying to catch a falling knife which is very similar for this Q2, albeit with some difference in the drivers as last year’s Liberation Day tariffs were firmly in President Trump’s control while this year’s military operation in Iran presents a few additional variables.
Gold
As risk aversion hit hard in Q1 gold prices snapped back with aggression. And I saw quite a few proclamations that gold was trading like a risk asset, some even assuming correlation with stock prices. I take issue with that as correlations can be fleeting and in many cases, such as we’re seeing now with oil prices and the US Dollar, more an issue of near-term alignment.
In gold prices, I remain bullish as the trend that started two years ago still retains some level of attraction. To be sure, gold got massively overbought after the parabolic trend continued through the New Year, and as some change showed on the horizon we saw some profit taking appear.
But I doubt that we’re nearing a spot where central bank austerity is going to take over, even if there is a bit of concern around inflation as produced by higher oil prices. As I discussed in the equity forecast, I think we’ll see a strong re-emergence of the risk-on trade in Q2 and I think that’s a theme that can be shared with gold, as central banks leaning on dovish policy and lower rates is more of a necessity to a US government dependent on issuing more and more debt. And with President Trump’s chosen pick set to take over atop the Fed in Q2, it’s difficult to imagine that the bank’s commitment to ‘the wealth effect’ will have any negative changes, near-term.
From the chart setup in gold, last week finished with a doji and as we go into Q2 tomorrow, there’s an ascending triangle formation that I had discussed at-length in the webinar.
Gold Four-Hour Chart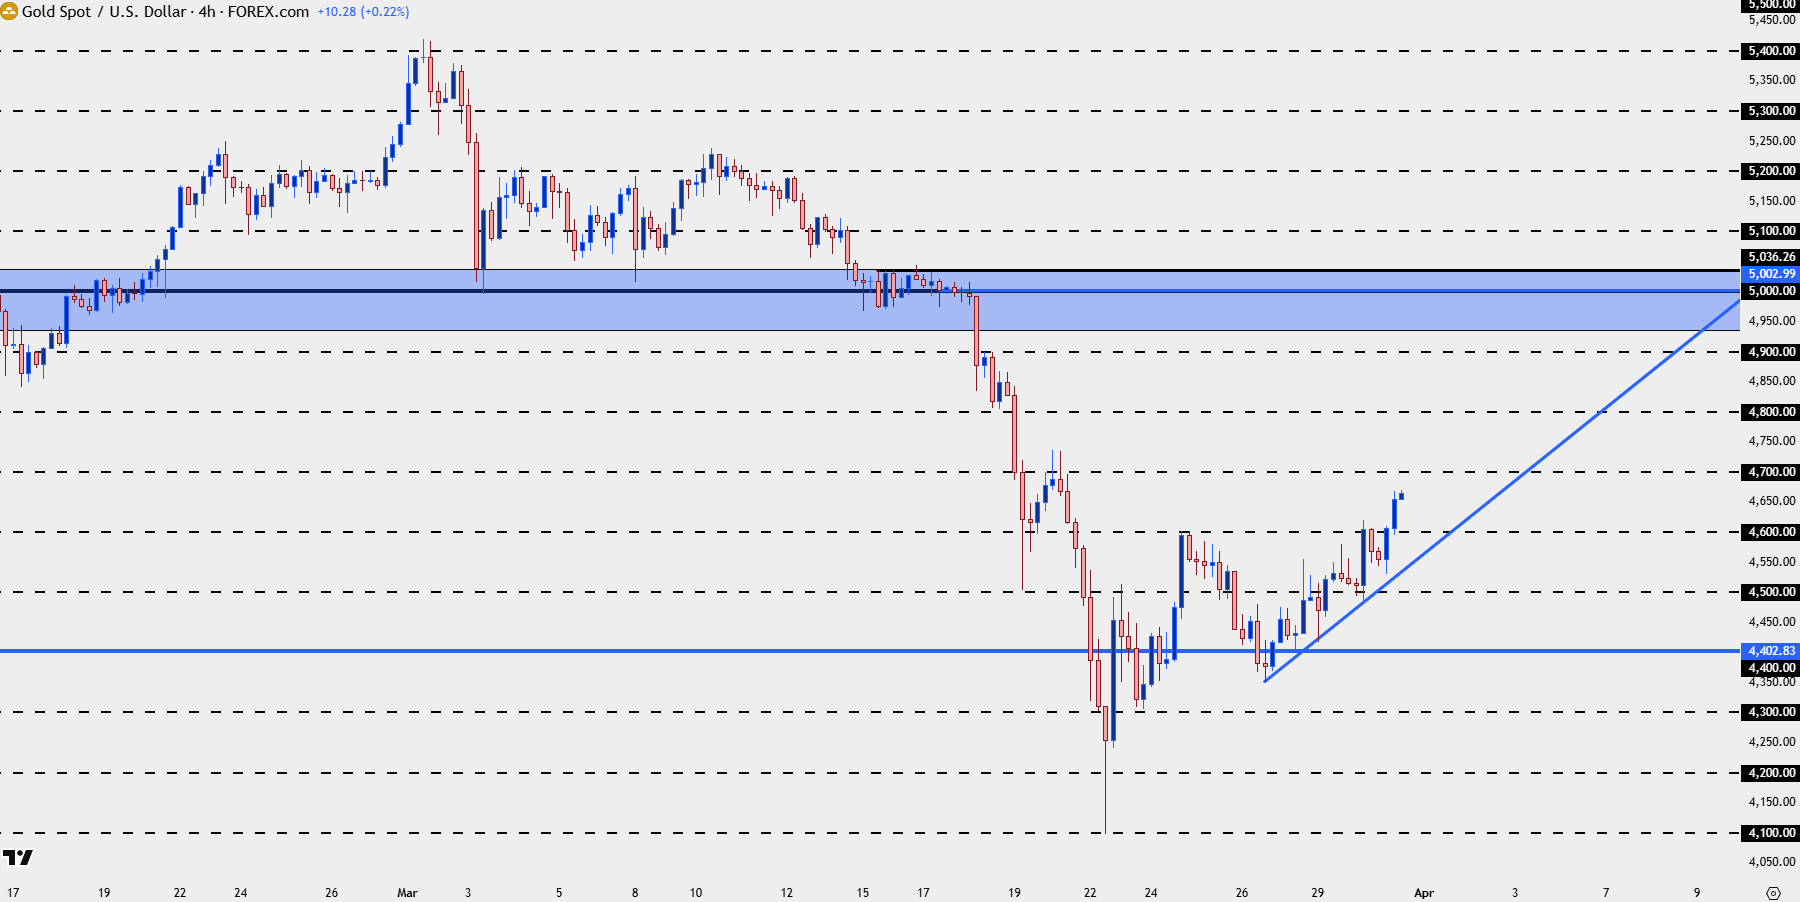
Chart prepared by James Stanley; data derived from Tradingview
US Dollar
The USD went deep into oversold status on the daily chart in January, and that led to the build of an ascending triangle formation in February. That formation led to bullish breakout in March and as we go into Q2, there’s another ascending triangle formation that’s still in-play with resistance at the familiar level around the 100-handle, which was support in Q3 of 2024 and has since come in as resistance multiple times since the second-half of last year.
For this to lead to strong breakout it would seem that we would need both increased tensions around Iran and the Bank of Japan to step back from intervention around the 160.00 handle. Both of these items remain major themes as we go into next quarter.
The daily chart is currently showing a bearish engulf and that keeps the door open for a deeper move down towards the 99.48-99.68 zone of prior resistance.
US Dollar Daily Chart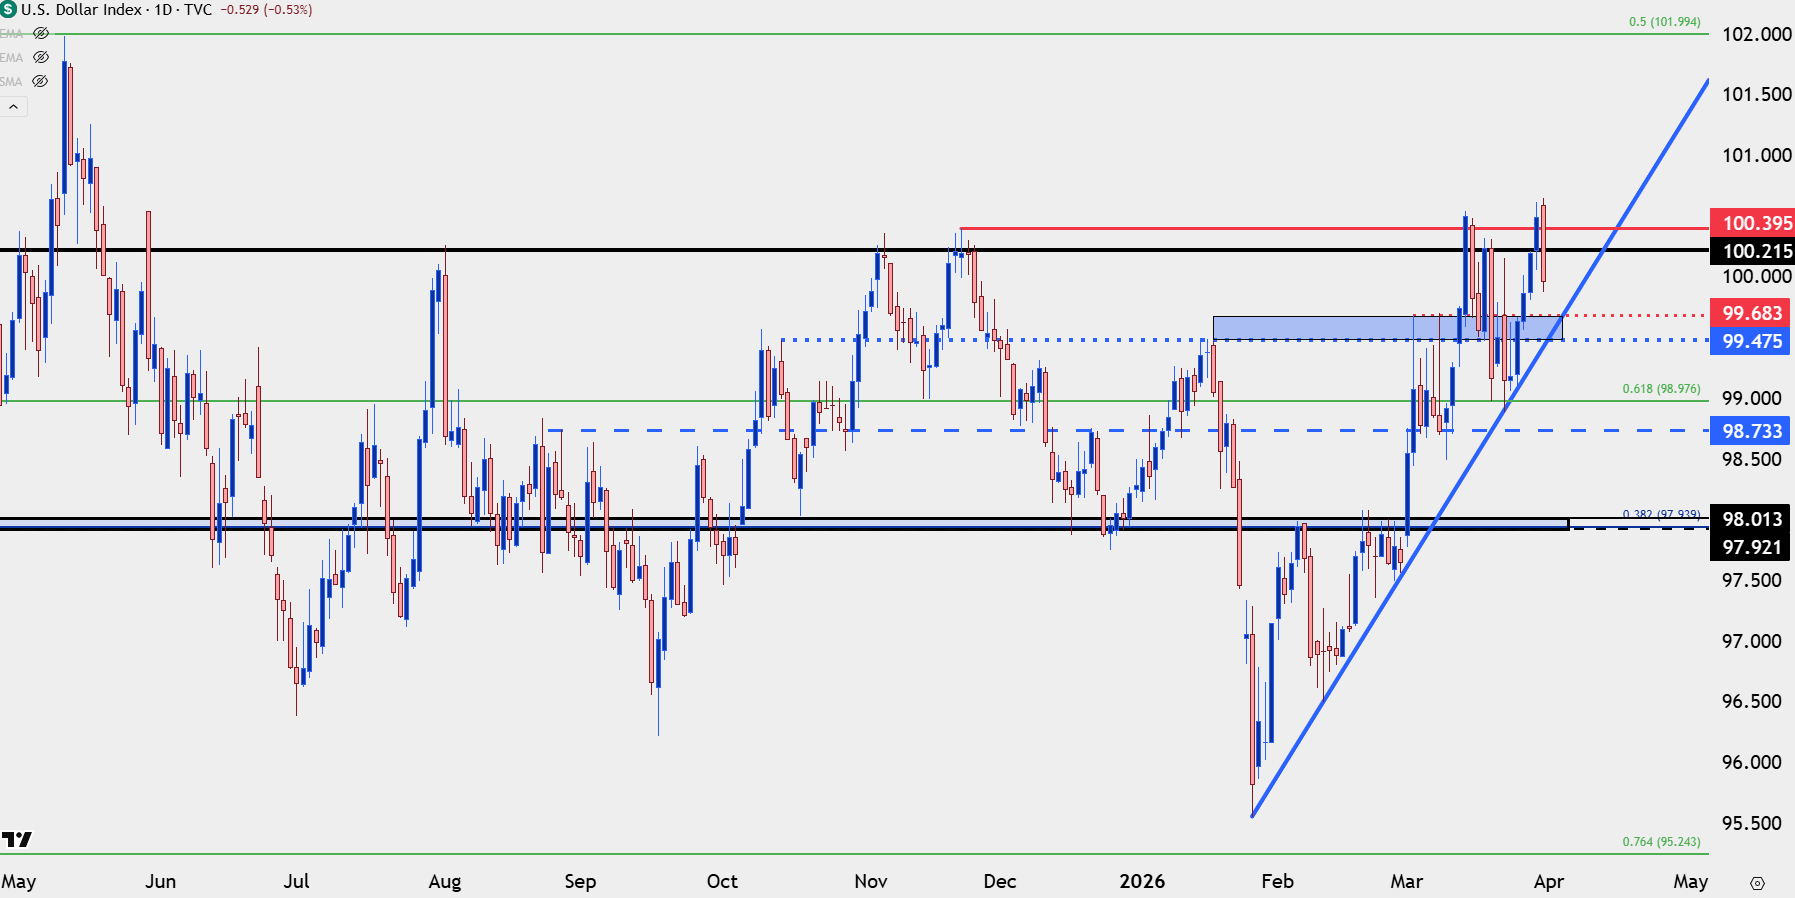
Chart prepared by James Stanley; data derived from Tradingview
EUR/USD
So far, EUR/USD is putting in a fairly vigorous bounce from the ‘s2’ level I had looked at in the weekend write-up and video. This retains potential for higher-low structuring on the daily chart and at this point, ideally for bulls, the 1.1500 level would come back into play to hold support on pullbacks.
This remains one of the more attractive venues for USD-weakness, in my opinion, as we go into Q2.
EUR/USD Four-Hour Chart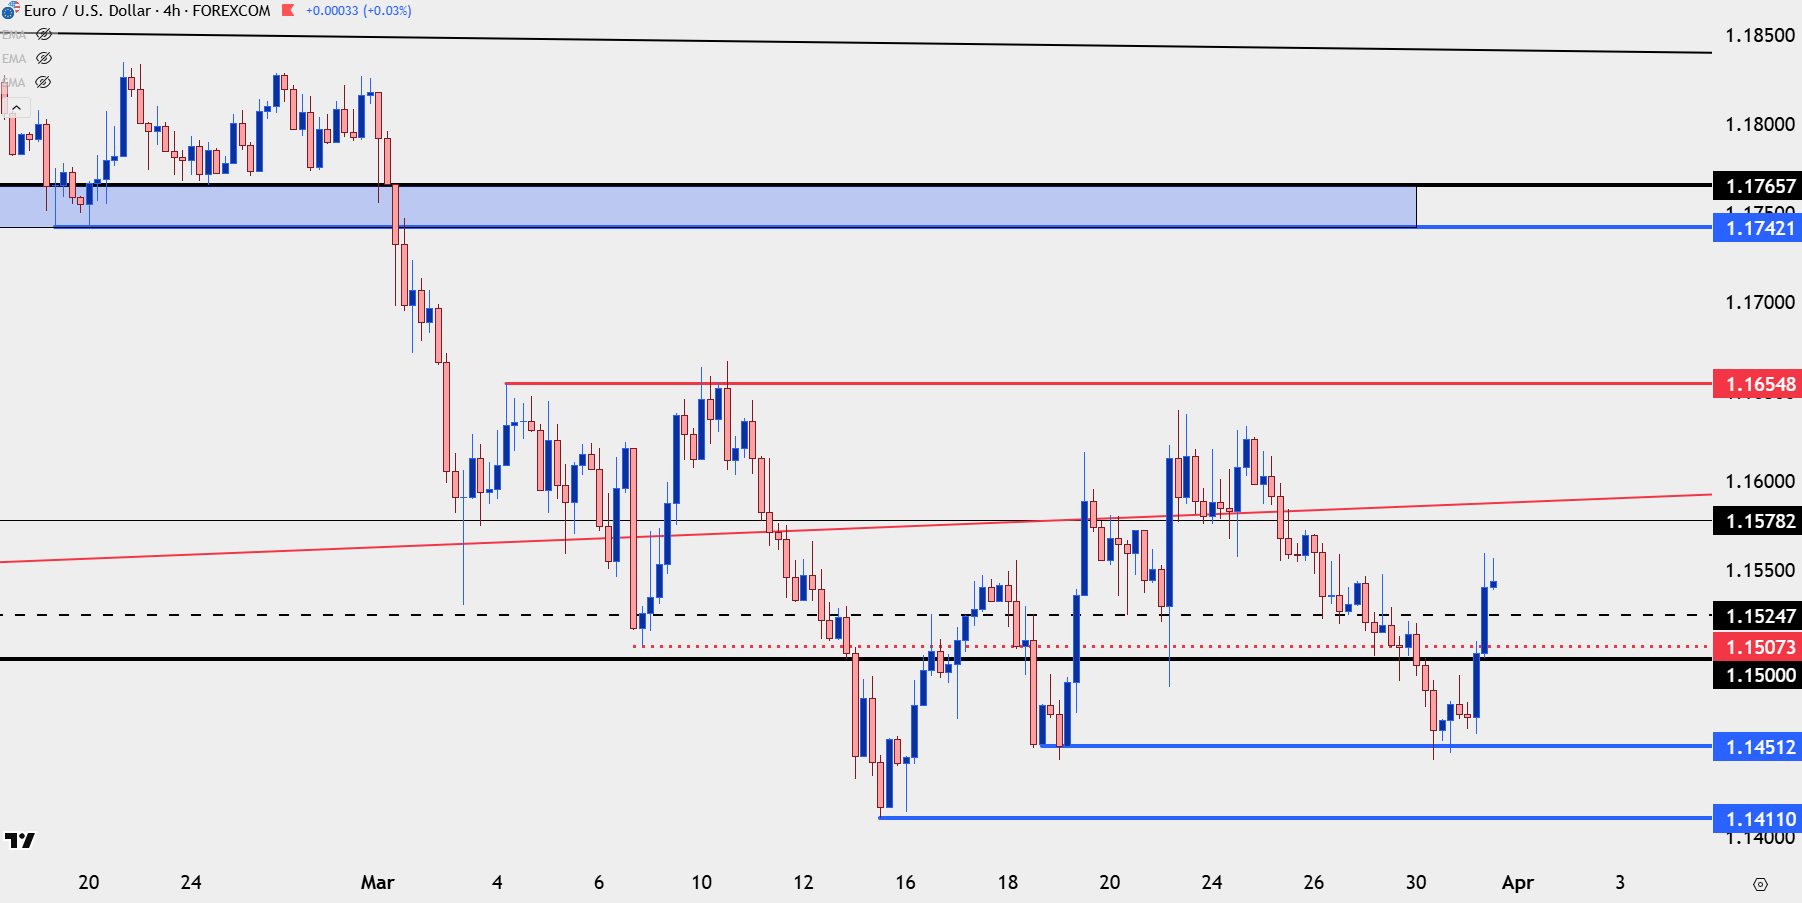
Chart prepared by James Stanley; data derived from Tradingview
USD/JPY
USD/JPY closed last week above 160.00 and while the initial move after the weekly open was higher, the pair has been in a consistent and persistent sell-off ever since. I think this is what’s pulling the USD lower and given that both Japan and the US side want to see the spot price lower, I wouldn’t doubt that there might be something going on behind the scenes there. That said, I have no proof of such and if you look at social media there’s many social media experts who are also doubling as Middle East and geopolitical experts and share a history in pandemic experts. But, the reality is these situations are small sample size and we won’t know whether there was an intervention or not until it’s far after the fact.
Nonetheless, I think it’s dynamics in USD/JPY that will continue to drive the USD and, in-turn, the USD complex.
For now, there’s a few spots for bulls to defend on the way down, with the next zone at 157.50-157.97 and then 156.76 followed by 155.54.
USD/JPY Four-Hour Chart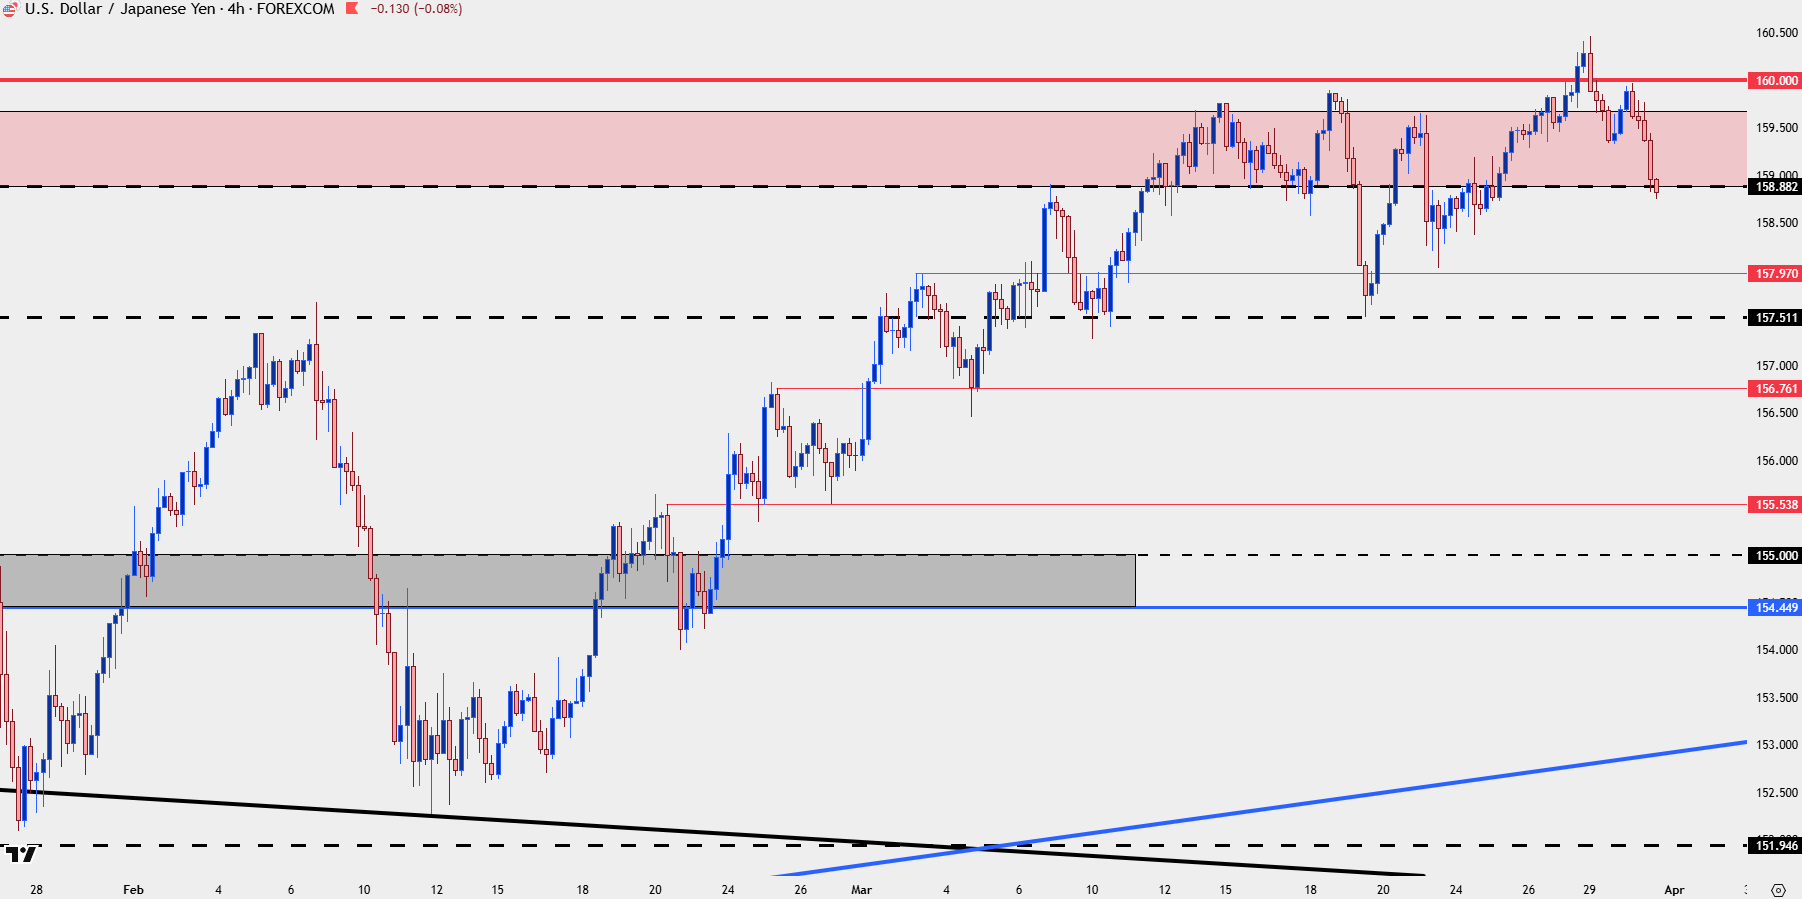
Chart prepared by James Stanley; data derived from Tradingview
USD/CAD
Despite the fireworks elsewhere USD/CAD has actually been a cleaner setup for USD-strength. I’ve been tracking this one for months as it initially started as a 1.3500 defense, and then a build of higher-lows.
Of late, bulls have been taking over and that’s pushing a move very close to the 1.4000 psychological level. A test there makes chasing a challenge but, until that happens, there’s pullback potential for higher-lows at prior resistance such as the 1.3800 level or perhaps even prior resistance (from previous support) at 1.3727.
USD/CAD Daily Price Chart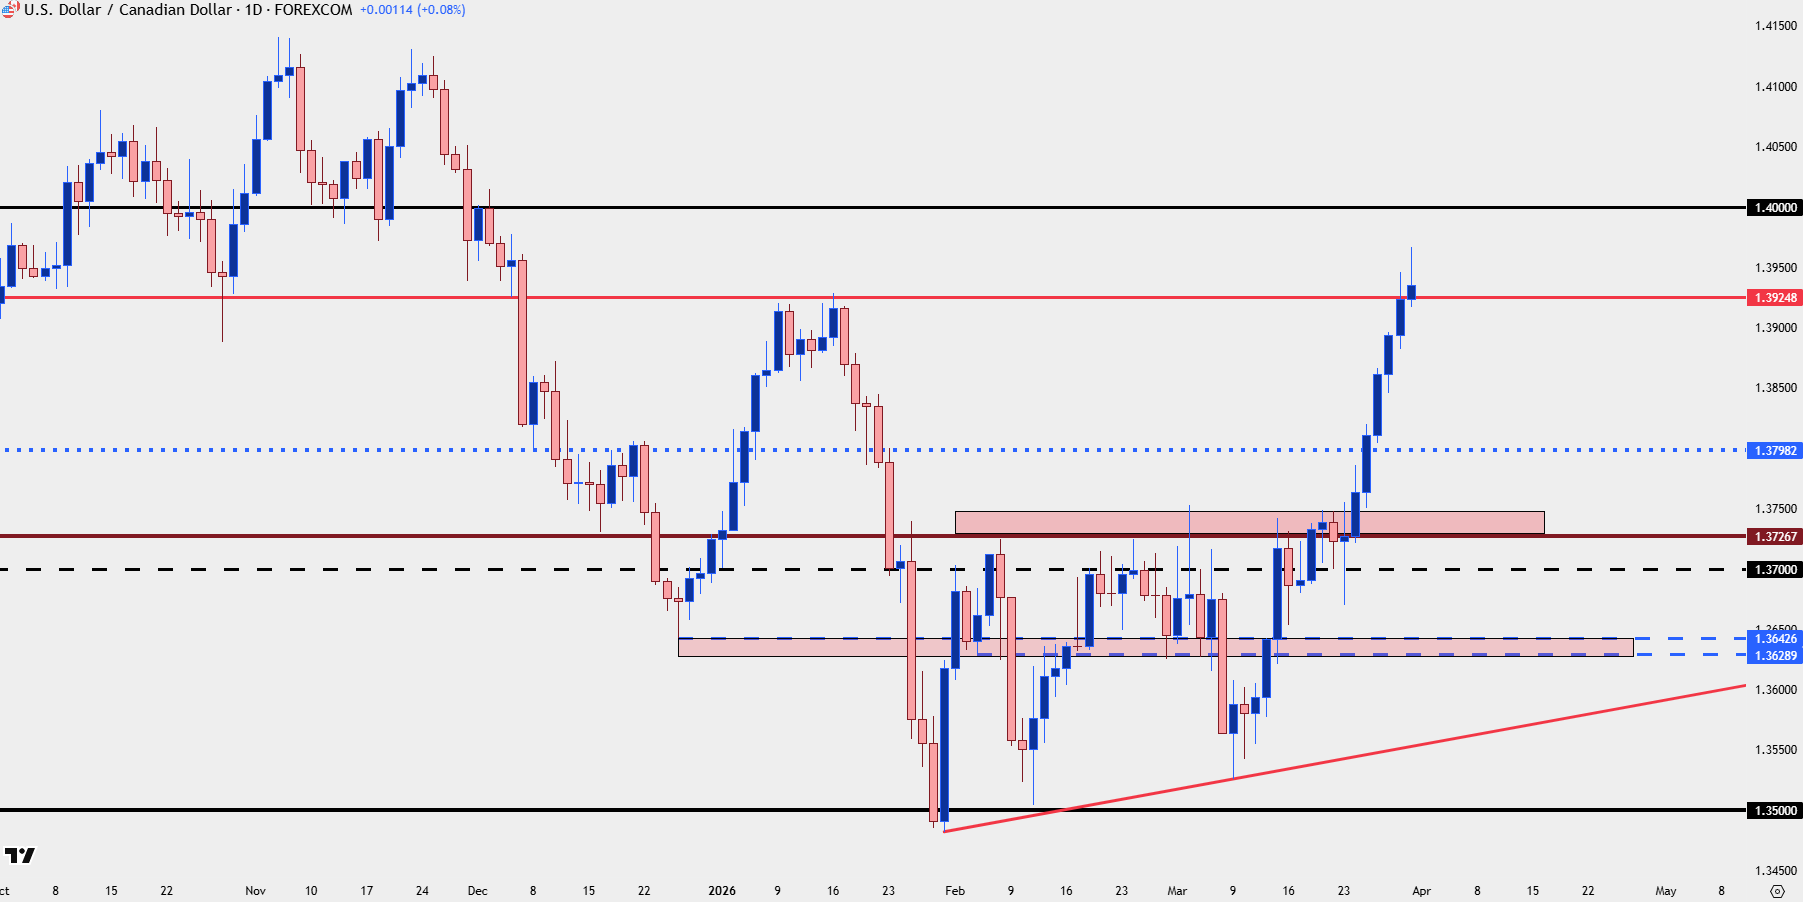
Chart prepared by James Stanley; data derived from Tradingview
--- written by James Stanley, Senior Market Analyst, Global Macro