


US Dollar Talking Points:
- The US Dollar broke out after the hawkish lean from Kevin Warsh at the Jackson Hole Economic Symposium.
- This produced a pullback in EUR/USD and for those looking to fade the USD-strength, that setup could be of interest.

USD/JPY is heading into the weekly close above the 160.00 handle and this begs the question as to whether we’ll see a response from either the BoJ and/or the US Treasury Department next week.
Of late, the US Dollar has been heavily driven by dynamics in USD/JPY and the Friday breakout illustrates that well, with both DXY and USD/JPY pushing up to fresh August highs on the back of Kevin Warsh’s speech at Jackson Hole.
US Dollar Four-Hour Chart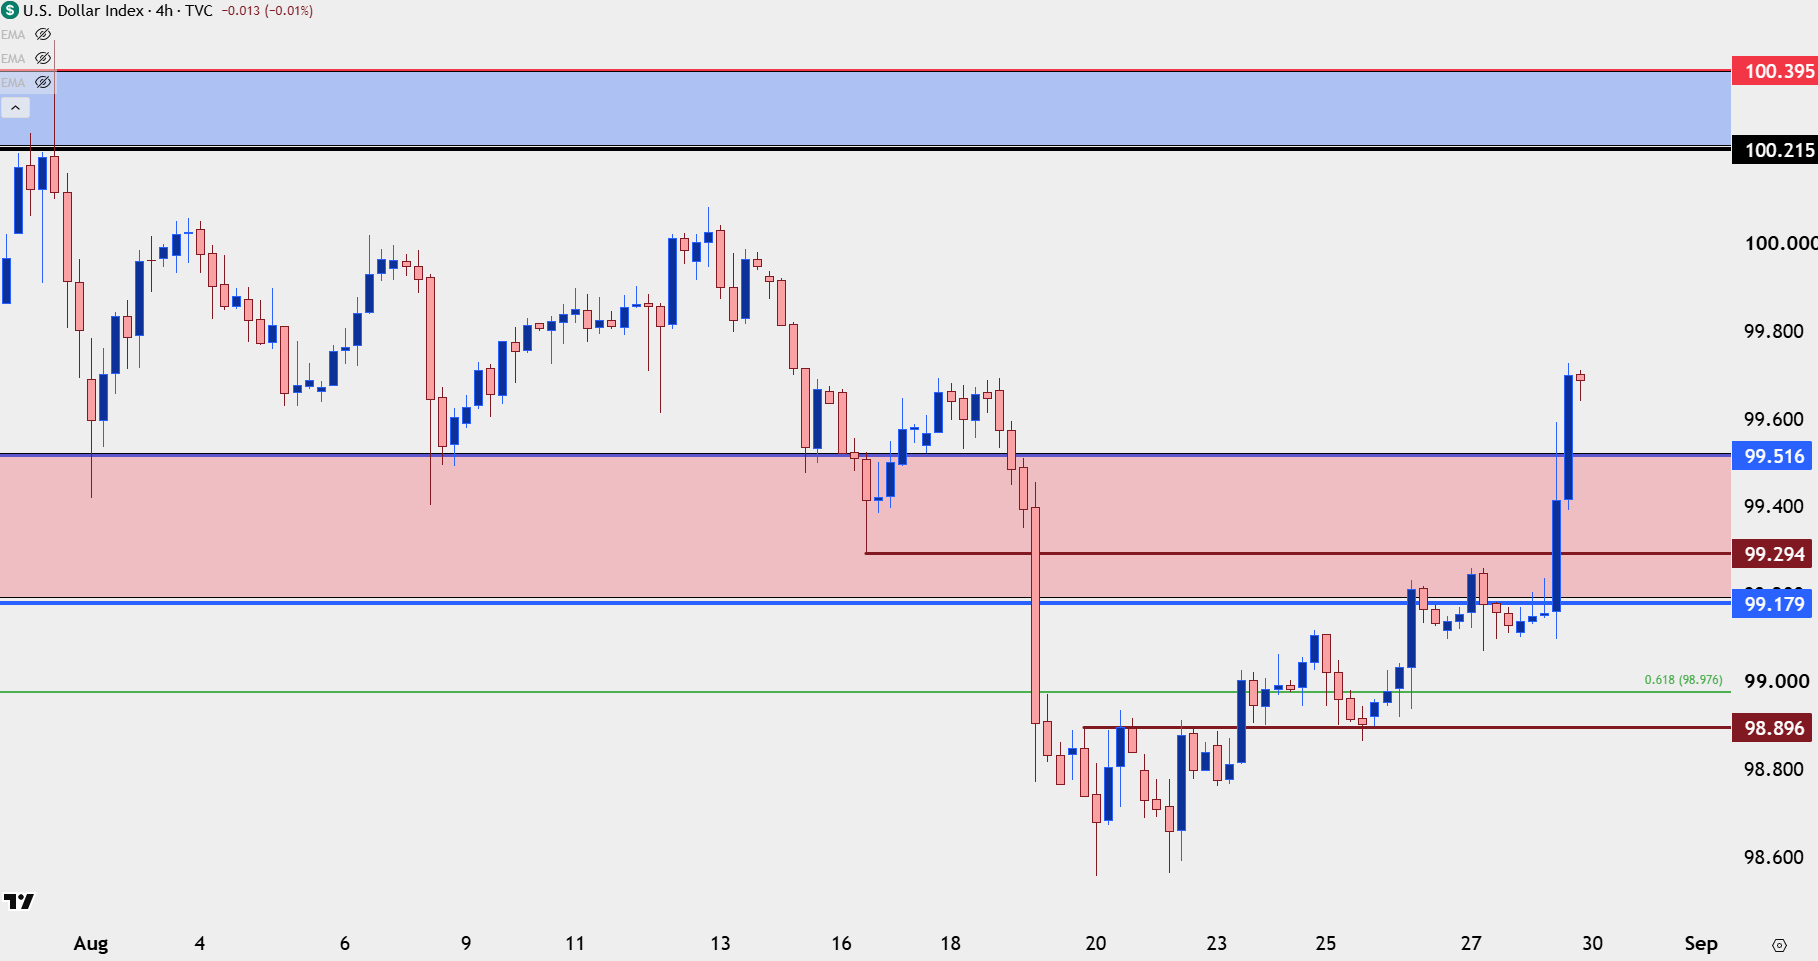
Chart prepared by James Stanley; data derived from Tradingview
USD/JPY
While 160.00 wasn’t a specific line in the sand set by policymakers, it was thought to be an important level that could possibly produce a response. Given the backdrop on Friday, with Kevin Warsh’s hawkish take at Jackson Hole driving a move of USD-strength, bulls finally mustered the motivation to test above the big figure despite posturing just below it for the prior two-and-a-half weeks.
As I had said in the Tuesday webinar, the pair was exhibiting continued higher-lows and that showed how buyers were continuing to respond to dips or pullbacks, and until there was a break in the fundamental backdrop, or a larger response from policymakers, that pace was likely to continue.
Friday marks a big test in that sequence as it’s the first push above the 160.00 level since the dual intervention. And like we’ve seen in prior episodes, now that bulls have broken through the seal the big question is for how long might they go until there is a response. The levels that I’ve been tracking are 160.64 and then 161.95, and above that is the same 164.00 that stalled the move ahead of the July FOMC and BoJ rate decisions and that’s what actually elicited a response.
USD/JPY Daily Chart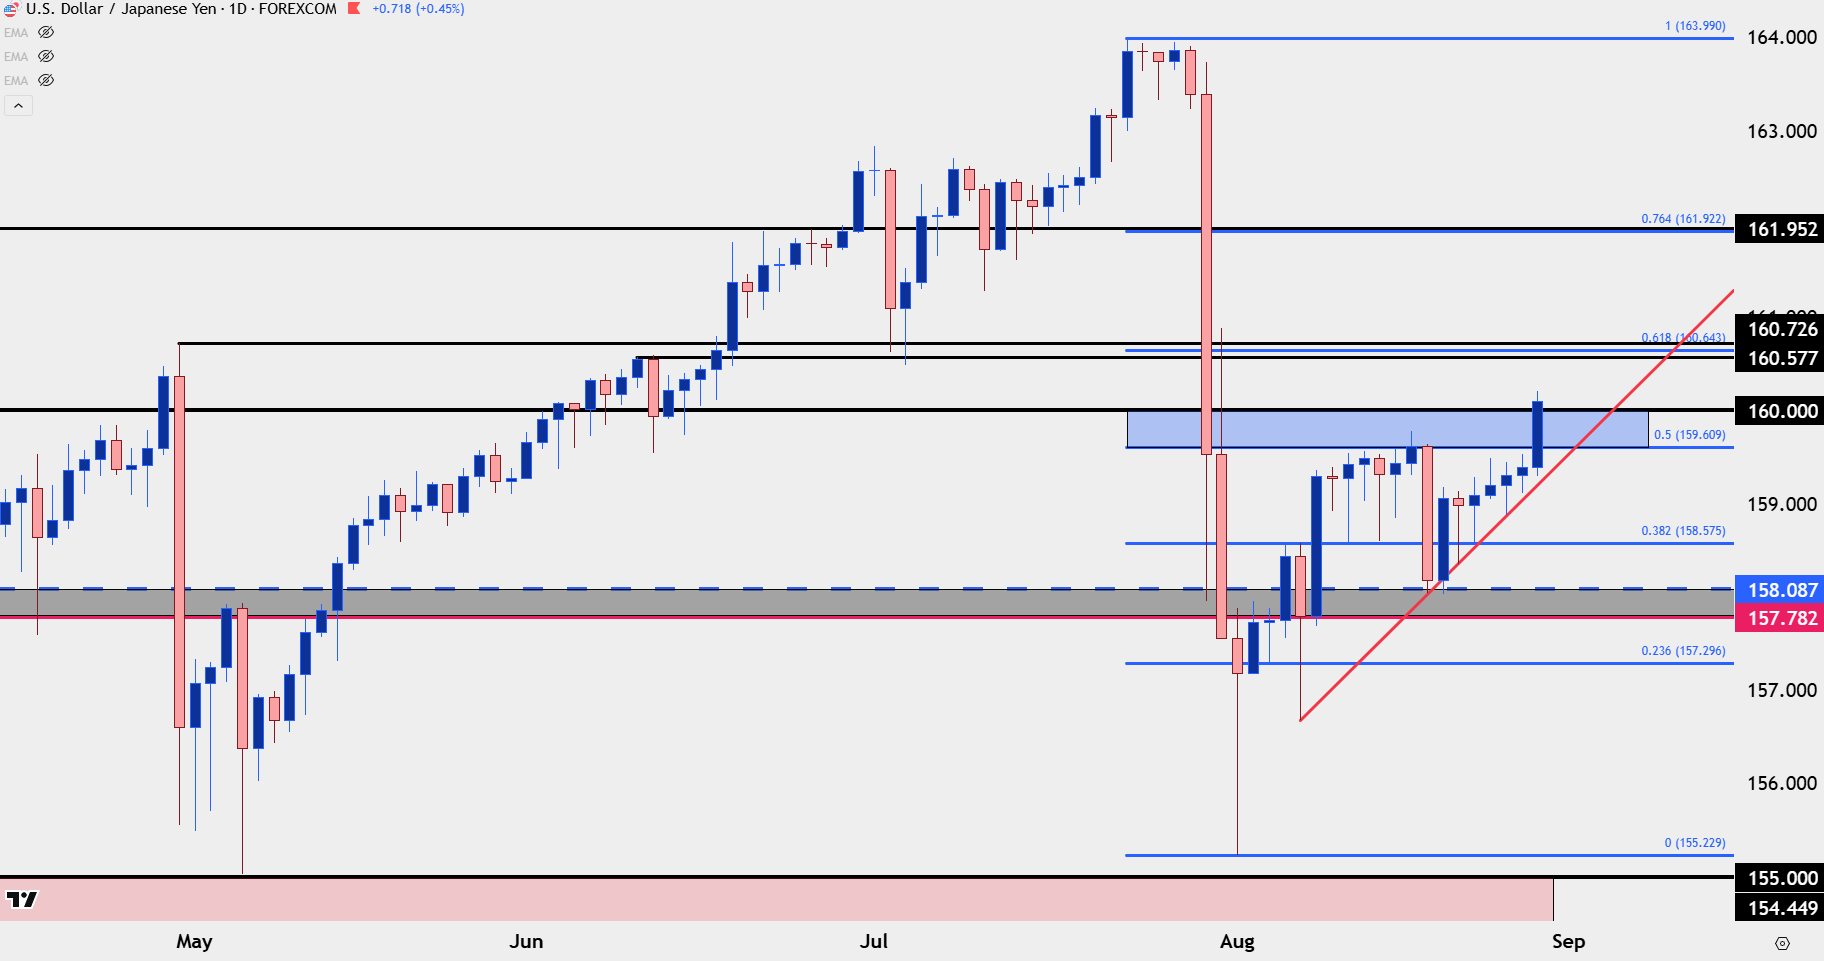
Chart prepared by James Stanley; data derived from Tradingview
EUR/USD
The move in EUR/USD has so far remained clean, with the 1.1576 support level holding the lows into the end of the week. This was resistance earlier in August before a breakout pushed a test of the 1.1700 handle, and for traders looking for USD-weakness that does not involve the hope of policy intervention, this could make for a compelling setup provided that support can hold through next week’s open.
EUR/USD Daily Price Chart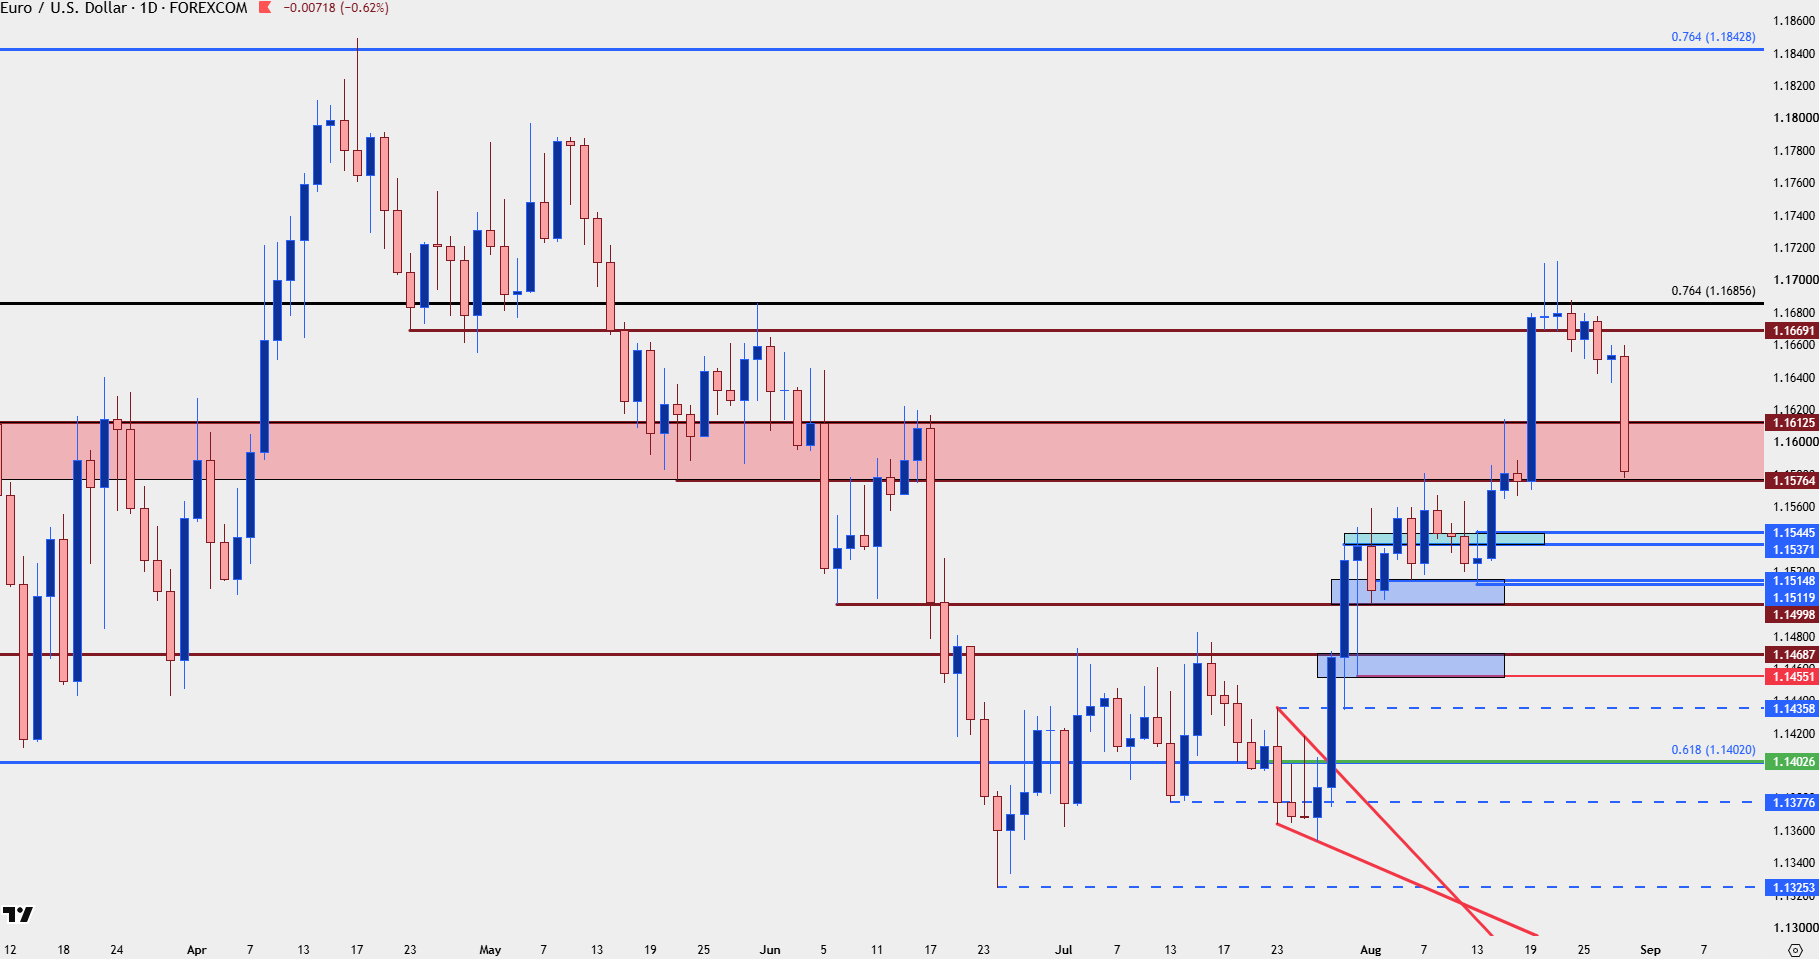
Chart prepared by James Stanley; data derived from Tradingview
--- written by James Stanley, Senior Market Analyst, Global Macro




