



US Dollar Short-term Outlook: USD Rejected at Resistance- Key Test Ahead
The US Dollar reversed sharply off pivotal resistance into the November open, threatening the multi-month uptrend in DXY. Battle lines drawn on the USD technical charts.
Share this:

US Dollar Index Technical Outlook: USD Short-term Trade Levels
- U.S. Dollar reverses sharply off key technical resistance into November open
- End of government shutdown offers little solace as DXY threatens September uptrend
- Risk is for deeper setback with key support in view- Flurry of Fed speak on tap
- DXY Resistance 99.62, 99.75, 100.16/35 (key)- Support 99.14, 98.68/78 (key), 98.03
The US Dollar reversed sharply off pivotal resistance into the November open with DXY poised to mark a second consecutive weekly loss. The focus is now on whether the pullback marks the start of a larger correction or a brief pause within the broader uptrend. Battle lines drawn on the USD short-term technical charts.
Review my latest Weekly Strategy Webinar for an in-depth breakdown of this US Dollar technical setup and more. Join live on Monday’s at 8:30am EST.
US Dollar Index Price Chart – USD Daily
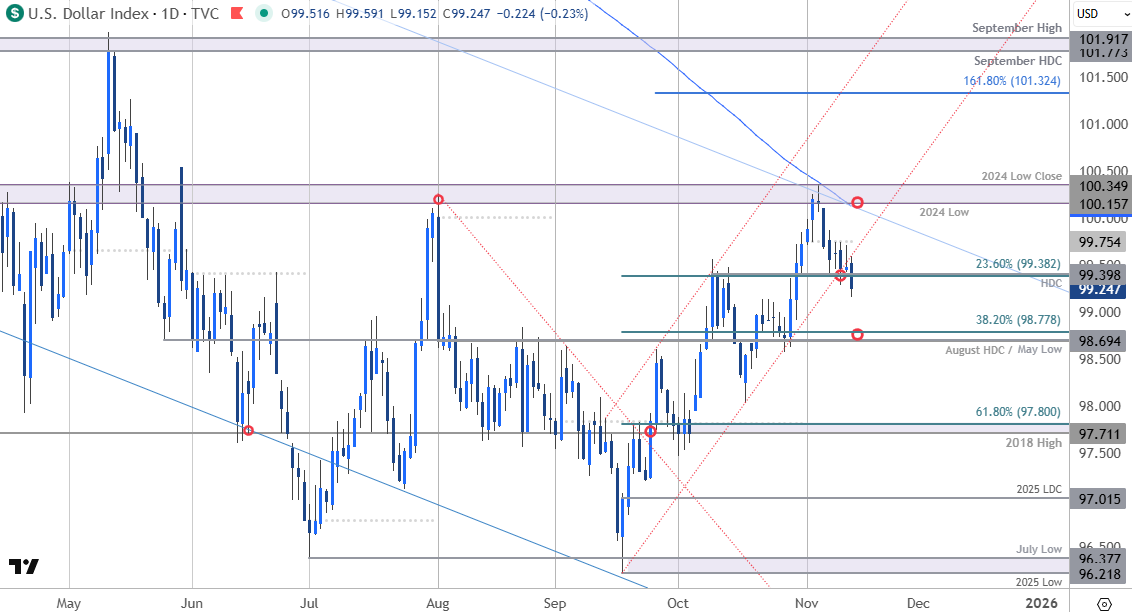
Chart Prepared by Michael Boutros, Sr. Technical Strategist; DXY on TradingView
Technical Outlook: In last month’s US Dollar Short-term Outlook we noted that the DXY was approaching the October highs and that, “From a trading standpoint, losses would need to be limited to 98.56 IF price is heading higher on this stretch – look to reduce portions of long-exposure / raise protective stops on a rally towards the upper parallels with a breach above 100.35 needed to suggest a larger trend reversal is underway.” The index pushed higher in the days that followed, with DXY briefly hitting an intraday high of 100.36 before reversing sharply into November. The Dollar has now fallen more than 1.2% off the monthly high with the decline attempting to break below the September uptrend today- watch the close with respect to the 23.6% retracement at 99.38 for guidance here.
US Dollar Index Price Chart – USD 240min
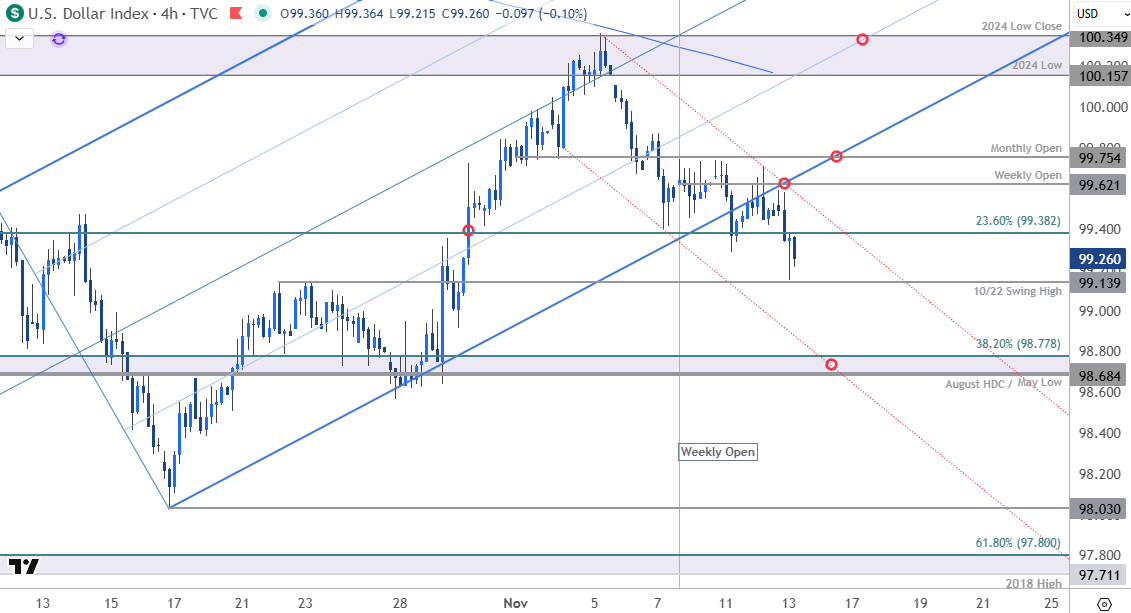
Chart Prepared by Michael Boutros, Sr. Technical Strategist; DXY on TradingView
Notes: A closer look at USD price action shows DXY breaking below the ascending pitchfork extending off the yearly low with a simple channel extending off the monthly high guiding this decline. Initial support rests with the 10/22 swing high at 99.14 and is backed by 99.68/78- a region defined by the August high-day close, the May low and the 38.2% retracement. Look for a larger reaction there IF reached with a break / close below needed to suggest a more significant high is in place and a larger trend reversal is underway. Subsequent support rests at 98.03 and the 2018 high / 61.8% retracement at 97.71/80.
Weekly open resistance is eyed at 99.62 and is backed closely by the November open at 99.75. A break / close above this threshold would threaten resumption of the September uptrend with key resistance steady at 100.15/35- a region defined by the 2024 low, the 200-day moving average and the 2024 low close. Strength beyond this pivot zone is needed to fuel the next major leg of the US Dollar advance. The next major technical consideration is eyed at the 1.618% extension of the September advance at 101.32.

Bottom line: DXY reversed from key resistance into the monthly open with a break below then September upslope threatening a deeper setback- be on the lookout for a possible exhaustion low in the days ahead. From a trading standpoint, losses would need to be limited to 98.68 IF this is a simple correction with a break above 100.35 needed to mark uptrend resumption.
Keep in mind that the economic docket remains light this week with, yet another key inflation read (CPI) delayed on account of the government shutdown. Although the government has now officially reopened, it will take time for key data releases to catch up after such a prolonged pause. In the meantime, a continued flurry of Fed speakers are scheduled over the next few days, and traders will look for insight into how policymakers view the rate path into year-end after weeks of limited data. Stay nimble until the monthly range clears and watch the weekly closes for guidance. Review my latest US Dollar Weekly Forecast for a closer look at the longer-term DXY technical trade levels.
Key US Economic Data Releases
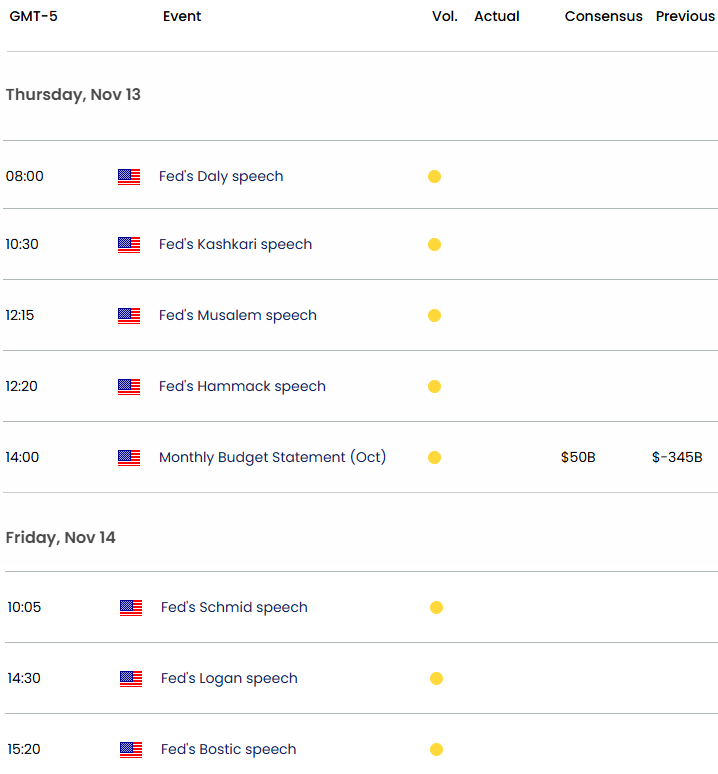
Economic Calendar - latest economic developments and upcoming event risk.
Active Short-term Technical Charts
- Gold Price Outlook: XAU/USD Bulls Roar Back- Rebound Testing Pivotal Resistance
- Canadian Dollar Short-term Outlook: USD/CAD Rally Stalls at Trend Resistance
- Euro Short-term Outlook: EUR/USD Snaps 1.15- Recovery Risk Rises
- Japanese Yen Short-term Outlook: USD/JPY Coils as Breakout Setup Builds
- British Pound Short-term Outlook: GBP/USD Plunge Pauses at Support Ahead of BoE
- Australian Dollar Outlook: AUD/USD Drop Deepens- Exhaustion Risk Rises
- Swiss Franc Short-term Outlook: USD/CHF Coiled for November Breakout
Written by Michael Boutros, Sr Technical Strategist
Follow Michael on X @MBForex



Open an account today
Experience award-winning platforms with fast and secure execution.
Economic calendar
Web Trader platform
Our sophisticated web-based platform is packed with features.
Related articles

Rates Shock, Metals Rout Leave Aussie Dollar Under the Pump
The global environment is becoming increasingly hostile for the Aussie. With AUD/USD breaking major support and AUD/JPY threatening further downside, today's jobs report faces an uphill battle to change the picture.


Euro Short-term Outlook: EUR/USD Plunges to 19-Month Low—Bears Face Critical Test 11 18 2026
The Euro selloff is now approaching pivotal support, raising the prospect of downside exhaustion as the November decline extends.

Copper forecast: risk-off mood and demand worries sink prices below $6
Copper has broken below $6, its 200-day moving average and a trend line dating back to August 2025. With industrial metals under pressure and the dollar firm, $5.50 is now the level to watch.

From time to time, StoneX Financial Pty Ltd (“we”, “our”) website may contain links to other sites and/or resources provided by third parties. These links and/or resources are provided for your information only and we have no control over the contents of those materials, and in no way endorse their content. Any analysis, opinion, commentary or research-based material on our website is for information and educational purposes only and is not, in any circumstances, intended to be an offer, recommendation or solicitation to buy or sell. You should always seek independent advice as to your suitability to speculate in any related markets and your ability to assume the associated risks, if you are at all unsure. No representation or warranty is made, express or implied, that the materials on our website are complete or accurate. We are not under any obligation to update any such material.
As such, we (and/or our associated companies) will not be responsible or liable for any loss or damage incurred by you or any third party arising out of, or in connection with, any use of the information on our website (other than with regards to any duty or liability that we are unable to limit or exclude by law or under the applicable regulatory system) and any such liability is hereby expressly disclaimed.