


JPY Leads the Way Lower
USD/JPY has touched 155 for the first time since February, marking fresh nine-month highs for the major pair. There’s already been veiled threats of intervention which seems to be an early or initial warning sign. When intervention was in-play last year, it was the 160 level that the Finance Ministry was so concerned with. This can make USD/JPY a bit more challenging given the focus on the major pair, along side the tenuous bullish backdrop in the USD at the moment. EUR/JPY on the other hand has established a fresh all-time-high and there’s a clear area of possible support potential. GBP/JPY is bristling up against a big zone of resistance, and this carries breakout potential for those looking to push Yen-weakness more aggressively.
USD/JPY
I’ve been bullish USD/JPY for some time now especially if lining up FX strategy across US Dollar pairs. USD/JPY set a significant swing low in April of this year and even as DXY was setting a fresh low on day one of Q3 or on the September 17th rate cut from the FOMC, USD/JPY was holding at higher lows.
That all came to a head in early-October on the back of Japanese elections, when pro-growth fiscal policy took over and finally allowed for a break of the 150 big figure in USD/JPY. But, as we’ve been accustomed to, that rapid sell-off in JPY sparked grumblings from the Finance Ministry, with veiled threats of intervention.
Matt Weller talked about that topic this morning, and we’ve seen this play out in varying ways over the past three years as the Finance Ministry’s concern over controlling the currency is at odds with the government’s concern about bringing growth (and remaining in power).
Psychological levels are particularly important to this theme. It was the 145 level that got the Finance Minister grumbling in 2022 but ultimately, it was the break of the 150 level that brought upon the order for intervention. That crafted a high at 151.95 and then in November, driven by weaker US CPI, the pair finally pulled back.
USD/JPY Weekly Chart
Chart prepared by James Stanley; data derived from Tradingview
That 151.95 level was back in-play in 2023 and this time, bulls stalled just before the level traded and then another below-expected CPI report in November sparked a pullback – but this time it was a mere 23.6% retracement.
In 2024, as US inflation remained high and doubt began to grow around the Fed’s ability to cut rates, that 151.95 level held resistance in March and into April, until a breakout sparked on the back of CPI. This time, price ran right through 155 and jumped up to 160.00, at which point another intervention was ordered.
The reaction from that lasted for about a week, but it was 151.95 that marked support at which point bulls began to load up again, driving back up to the 160.00 handle.
But what happened after the next intervention probably continues to serve as a cautionary tale…
In July, USD/JPY was back above the 160 handle and the capital reserves that the BoJ spent to buy down the rate in April-May were essentially lit on fire. This time, they wanted to go big, and they waited for the release of US CPI on the morning of July 11th. This sparked a massive unwind of the USD/JPY carry trade that saw more than 2,000 pips taken out over the next couple of months, but the carnage wasn’t confined to just currency markets, as the leverage that had built in markets like tech stocks in the US quickly came out as those USD/JPY trades unwound.
We had the third highest reading for the VIX index – ever – just a few weeks after that intervention on July 11th. Stocks ultimately recovered, the BoJ backed away from additional rate hikes, and as Q4 came in the US Dollar reversed and USD/JPY marked back above 150 and eventually 155.
USD/JPY Daily Chart
Chart prepared by James Stanley; data derived from Tradingview

USD/JPY Strategy
Interventions are not items to be taken lightly because the capital reserves necessary to fund them are finite, and as we saw last April, they can’t fix the problems driven by the country’s very own monetary policy. And until the BoJ wants to hike rates, which at this point, would be at odds with what their fiscal policy is driving for, that’s going to be a problem.
So, this can keep USD/JPY as an attractive venue for USD-strength, even though the Dollar itself doesn’t necessarily show as all that strong elsewhere. But, that same JPY-weakness could potentially be a more effective theme in other pairs, away from the USD, as I’ll look at below.
From the four hour chart of USD/JPY, there’s a few items of support that remain of interest if we can see some greater profit taking on the back of near-term intervention fears.
The 154.45 level held resistance multiple times, and as yet, hasn’t shown as support. We saw similar at 153.23, a level I looked at in last week’s webinar. That price was traded through but as I talked about in the Friday video, the matched lows on the daily bars on Thursday and Friday highlighted a lack of willingness on the part of sellers, which was deductively a bullish factor.
If we do see a deeper retracement, which I think would need to come from a threat of rate hikes from the BoJ to go along with intervention fears, 151.95 is the next major area of support – and this is the same level that set the highs in 2022 and 2023 and then in March of last year, until ultimately coming in as support after the failed intervention at 160.00.
USD/JPY Four-hour Chart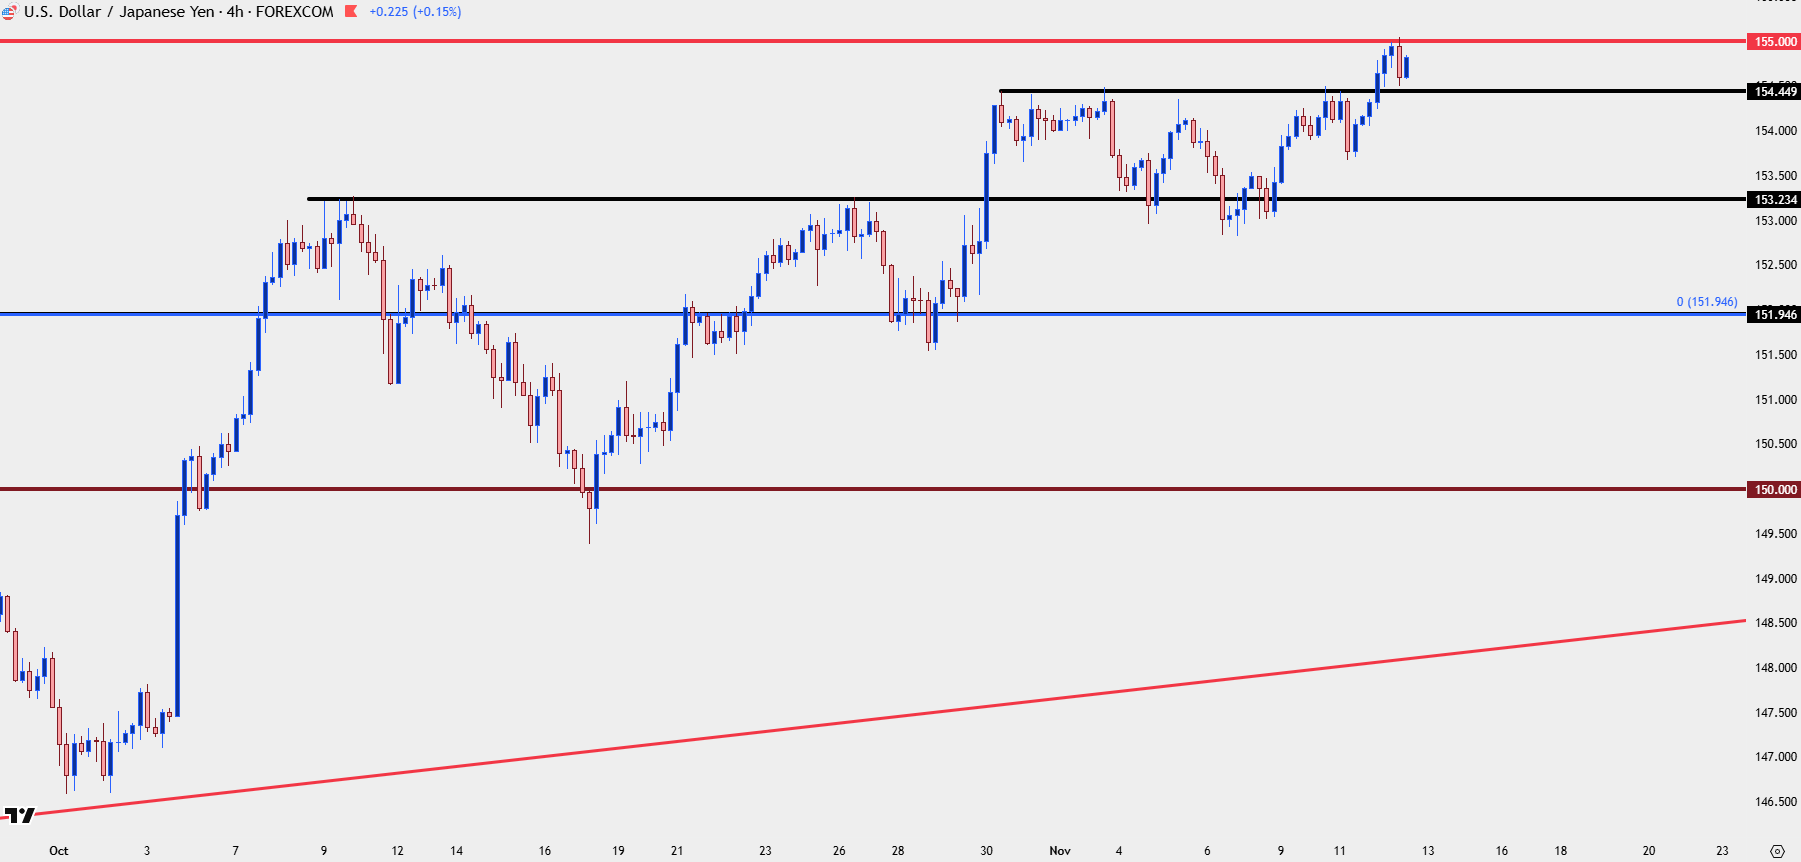
Chart prepared by James Stanley; data derived from Tradingview
EUR/JPY
I’ve been discussing EUR/JPY as a replacement for USD/JPY, in effort of jumping on the Yen-weakness theme, for months now. And the pair set a fresh all-time-high today.
While I still like the pair for JPY-weakness, I’m cautious of chasing while so near that fresh all-time-high, because as we saw in late-July, that can fast push in to a profit taking mode.
That said, the bullish structure has been clear, and prior resistance at 178.57-178.83 represents a spot for possible higher-low support. And below that, 177.86-178.07 sets up as an ‘s2’ zone. I wouldn’t expect a drop to 177.00 unless there was some broader JPY-strength, but I’m tracking 177.00-177.24 as an ‘s3’ zone of support, which could still qualify as a higher-low from the daily chart. It was a prior zone of resistance that hasn’t yet shown support, so that becomes attractive in that deeper pullback scenario.
EUR/JPY Four-Hour Chart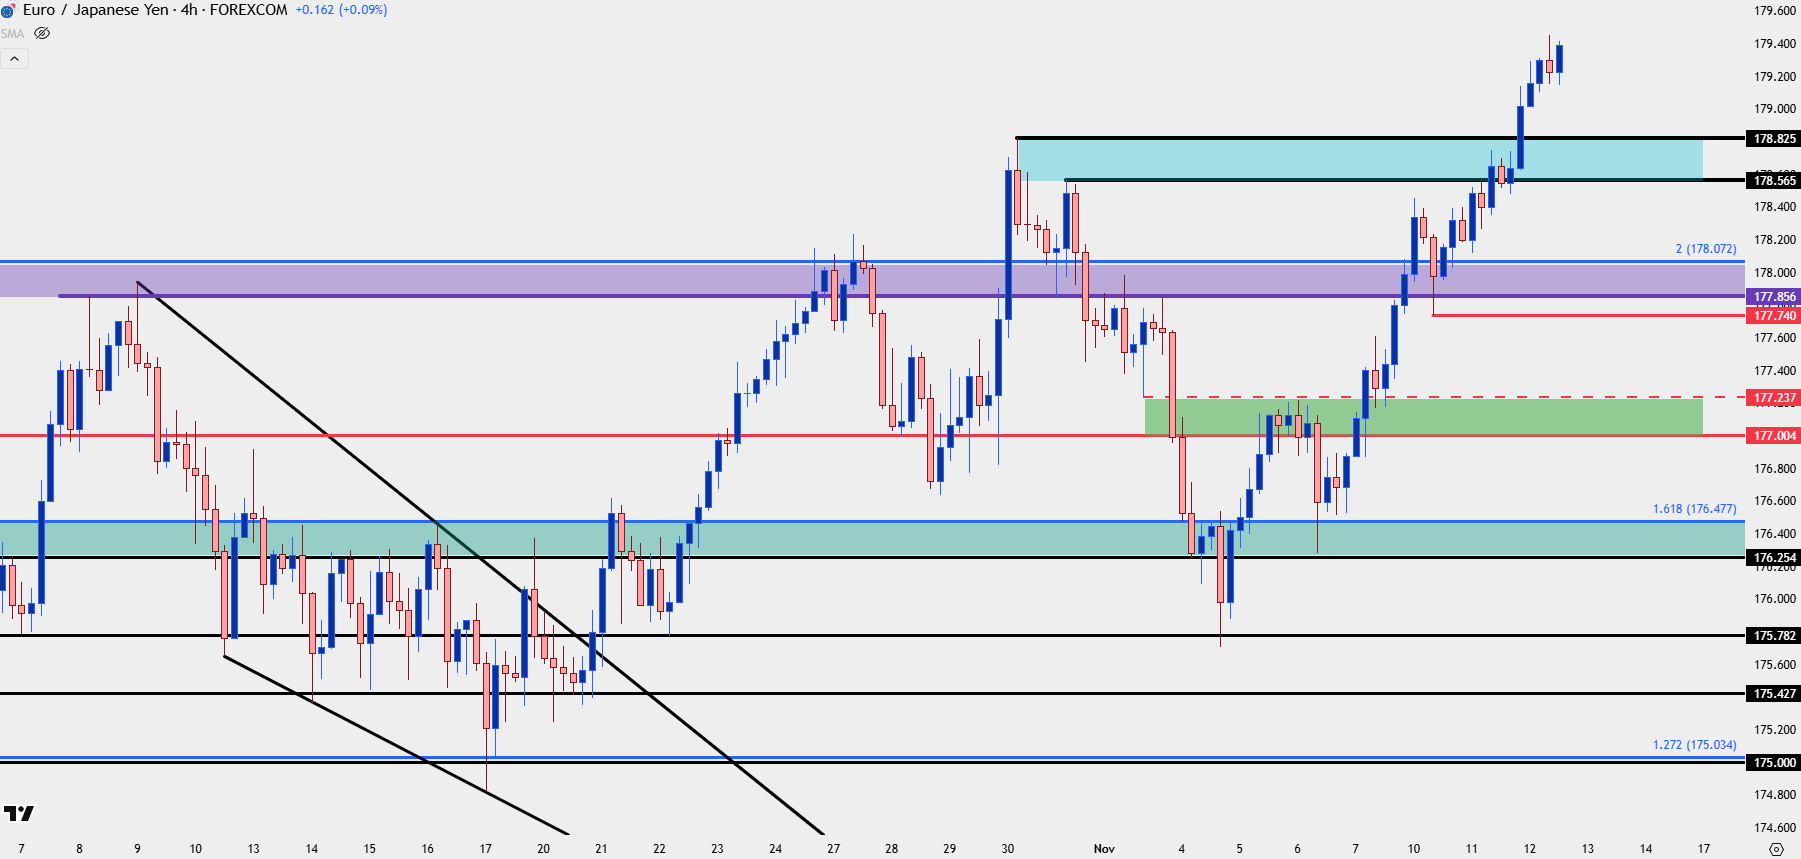
Chart prepared by James Stanley; data derived from Tradingview
GBP/JPY
If looking to press JPY-weakness aggressively right now, GBP/JPY could be attractive. There’s a zone of resistance that’s been in-play in varying ways for more than a month now spanning from 203.06-203.31. There was a v-shaped reversal last week after the pair held above the 199.00 handle, and as GBP has come back to life a bit, GBP/JPY has coiled into that resistance.
That resistance has been holding since Monday of this week but buyers have been pressing a little bit more, with both higher-lows and higher-highs. This gives the appearance of breakout potential at that zone, with the next resistance level around the 204 handle, which held the highs in late-October trade. And then above that, we have the 2025 high at 205.33 which would be the next clear area of resistance.
GBP/JPY Four-Hour Chart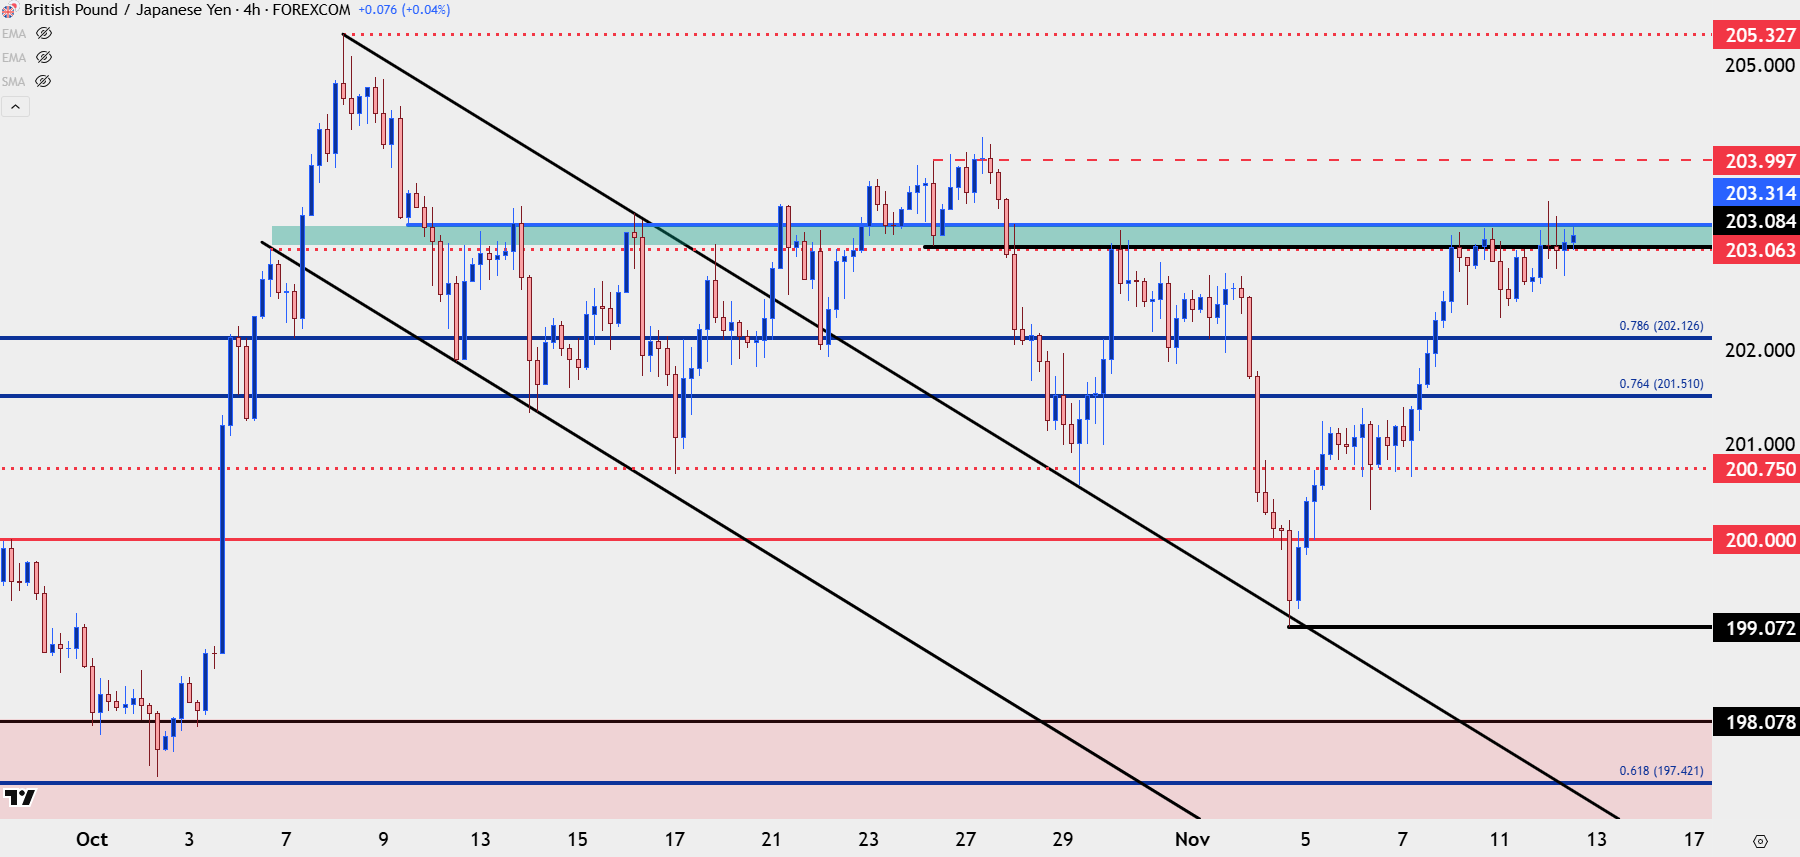
Chart prepared by James Stanley; data derived from Tradingview
--- written by James Stanley, Senior Market Analyst, Global Macro




