


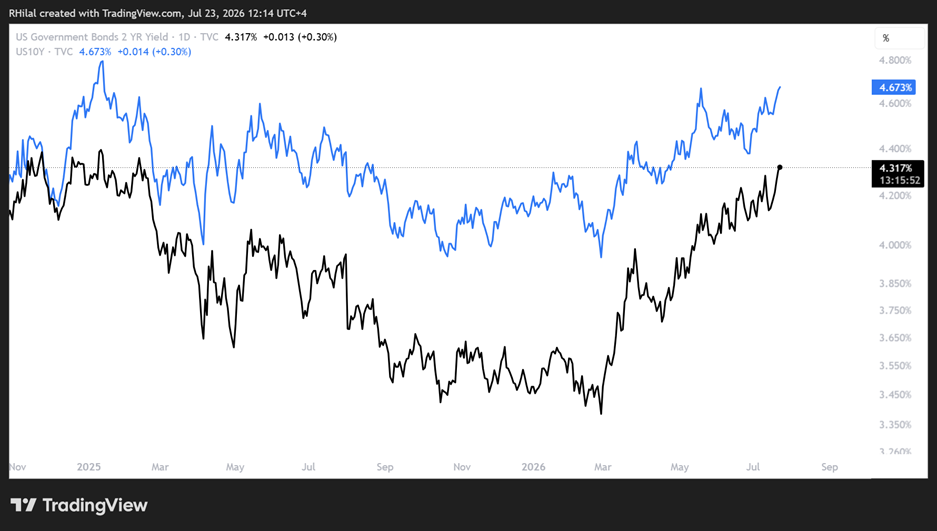
The US dollar remains firm near 101, USD/JPY is testing new yearly highs above 163, and Treasury yields have returned toward their yearly highs. Together, these factors continue to outweigh the latest rebound in precious metals, which still requires further technical confirmation before supporting a sustainable long-term bullish outlook.
US02Y – US10Y Yields – Daily Time Frame – Log Scale
Source: Trading view
According to the CME FedWatch Tool, market expectations for a September rate hike have risen above 55%.
Crude oil’s recovery toward $90 per barrel, combined with persistent inflation risks across the second-half 2026 outlook, is keeping the threat of further monetary tightening elevated. As a result:
- The DXY continues to hold above 100
- USD/JPY remains above 163, near multi-decade highs
- The rebound across precious metals remains unconfirmed
Risk assets continue to consolidate, with Bitcoin near yearly lows and US indices near all-time highs
Regarding when gold’s long-term bullish outlook may resume and what a possible resolution to the current conflict could look like, I recently published an article comparing the outcome of the 1973 oil embargo with the 2026 Strait of Hormuz transit crisis.
The comparison helps reduce short-term market noise and highlights potential historical patterns that may be repeating in the current environment.

While the framework for governing and securing the Strait of Hormuz remains unclear, the timing of any major shift—either higher or lower—can potentially be identified through price action in crude oil and correlated assets.
These include USD/JPY, which is trading near levels last seen in 1980, and gold, which is testing a one-year ascending resistance trendline that has now turned into potential support.
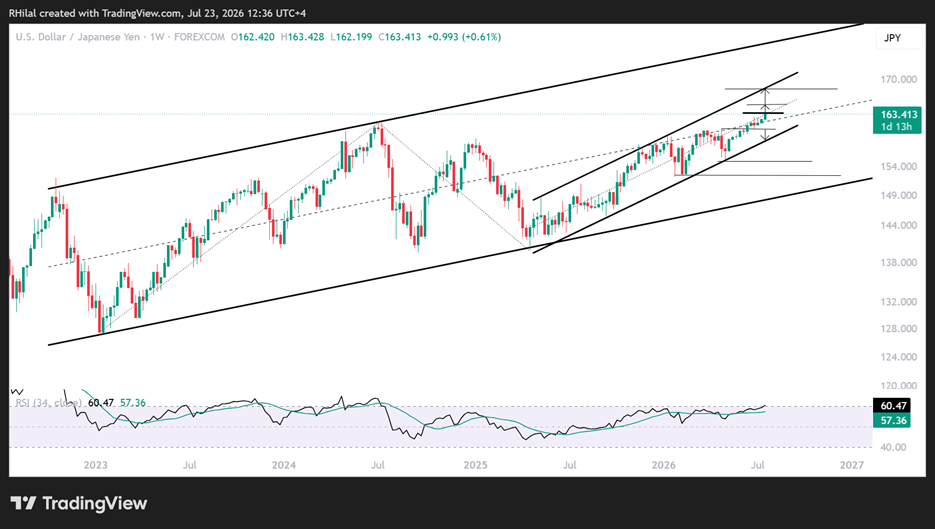
USDJPY Price Outlook: Weekly Time Frame – Log Scale
Source: Trading view
The weekly USD/JPY chart reflects two well-respected ascending channels.
The first has guided price action between April 2025 and April 2026, while the second represents the broader bullish structure that has been in place since 2022.
Price is now attempting to break above the midpoints of both channels. This creates a critical confluence zone that could open the way toward the Fibonacci extensions of the February-April-May 2026 cycle.
The 163.50 level is positioned near the 100% Fibonacci extension, followed by:
- 165: 127.2% Fibonacci extension
- 168: 161.8% Fibonacci extension
- 170: Upper boundary of the shorter-term channel, where pullback risk may increase
- 180: The next major upside zone if the 170 resistance fails to contain the advance, aligning with the broader 2022-2026 channel
USD/JPY Bullish Scenario
The steep upside scenario remains valid as long as the DXY stays firm above the 100.30 zone.
The bullish structure also depends on whether intervention in Japanese markets remains less influential than the impact of yield differentials and geopolitical risk.
As long as US Treasury yields remain elevated relative to Japanese yields, and the dollar continues to attract safe-haven demand, USD/JPY may retain its bullish bias.
USD/JPY Bearish Scenario
On the downside, a break below 162.50, 161.30, and 160.50 would place several previous resistance levels—now acting as potential support—under pressure.
A sustained decline through these levels would expose the lower boundary of the ascending channel near 158.
That area could generate another rebound within the broader bullish trend that has been in place since April 2025. However, a confirmed break below the channel would weaken the bullish bias, particularly if accompanied by a broader decline in the US dollar below 100.30-99.30.
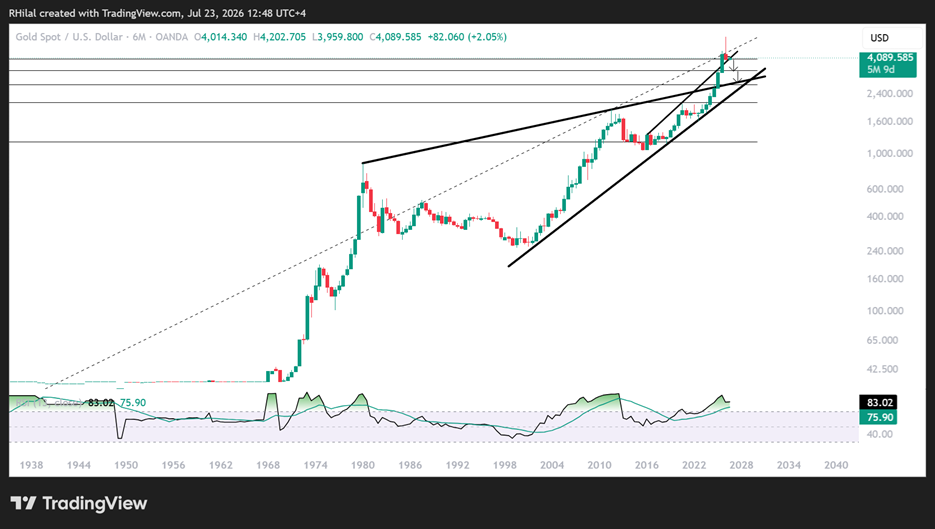
Gold Price Outlook: 6-Month Time Frame – Log Scale
Source: Trading view
From a six-month perspective, gold is testing one of its most significant historical confluence zones.
- Price is attempting to break below the 27.2% Fibonacci retracement of the secular advance from 1920 to 2026. A close below 3,930 would expose the 38.2% Fibonacci retracement around 3,500-3,460, a zone that acted as major resistance throughout much of 2025.
- Gold is also testing the long-term trendline connecting the major highs recorded between 2016 and 2025. This former resistance trendline has now turned into a key long-term support level, reinforcing the importance of the current technical confluence.
Whether gold sustains its rebound from this area or extends its correction will likely depend on developments in crude oil and, more importantly, the evolving US-Iran-Strait of Hormuz conflict.
I covered these levels in my latest webinar
A stronger recovery would require gold to reclaim the 4,200-4,300 zone, which is examined in greater detail on the daily chart below.
A sustained geopolitical resolution could help stabilize inflation expectations, bond yields, and broader market sentiment, supporting a recovery in precious metals. Conversely, a prolonged escalation would likely reinforce inflation concerns, keep Treasury yields elevated, strengthen the US dollar, and increase downside risks for gold.
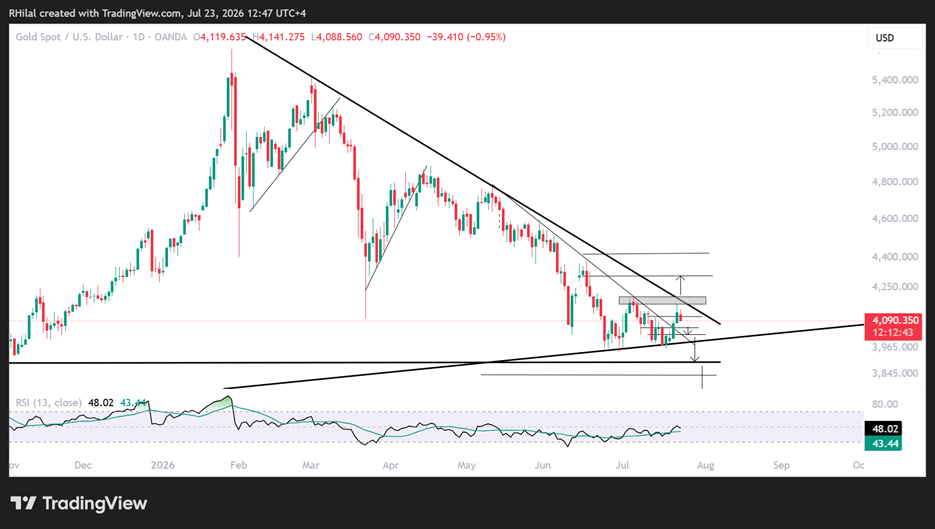
Gold Price Outlook: Daily Time Frame – Log Scale
Source: Trading view
Despite the strength of the high-time-frame support zone and the latest rebounds across gold and silver, price action remains below the descending trendline connecting the lower highs recorded since March 2026.
As a result, the broader short-term bias remains bearish.
The current rebound also remains fragile while gold tests the 27.2% Fibonacci retracement of the April-July decline.
Gold Bullish Scenario
A sustained recovery above 4,160 and 4,200 would shift attention toward the following resistance levels:
- 4,300: 38.2% Fibonacci retracement
- 4,420: 50% Fibonacci retracement
A break above 4,420 would signal a more meaningful shift back toward a bullish trend and would strengthen the case for a broader recovery in precious metals.
Gold Bearish Scenario
On the downside, a decline back below the 4,020-3,960 zone would reactivate the bearish scenario.
- The first major support would stand near 3,880, which corresponds with the October 2025 low.
- A confirmed break below that level could extend the decline toward the next major confluence zone near 3,460, where another significant reversal opportunity could emerge.
As long as the US Dollar Index and crude oil remain firm, downside risks across currencies and precious metals are likely to stay elevated.
Geopolitical developments, Treasury yields, inflation expectations, and the direction of the Strait of Hormuz conflict will continue to shape the broader macroeconomic outlook.
Written by Razan Hilal, CMT
Follow on X: @Rh_waves




