While the USD/JPY backdrop was treacherous in late-January and early-February, bulls came back in a big way over the past month and have continued to flirt with a massive line in the sand at the 160.00 handle.
That’s been an area of drama in the pair over the past two years, as it was twice defended in 2024 before a strong reversal took over in July of that year. In 2025, bulls didn’t even want to test that line in the sand, holding highs at 158.88 and then in early trade this year, price got 55 pips away from that level before putting in a strong reversal that was widely rumored or accused to have been intervention.
But it was around the 152.00 level that buyers jumped back in and with the carry still being positive on the long side of the pair and negative on the short side, bulls were able to take back over and drive another push up towards the 160.00 level, with the most recent iteration coming within 10 pips of that level before selling took over last Thursday.
USD/JPY Daily Chart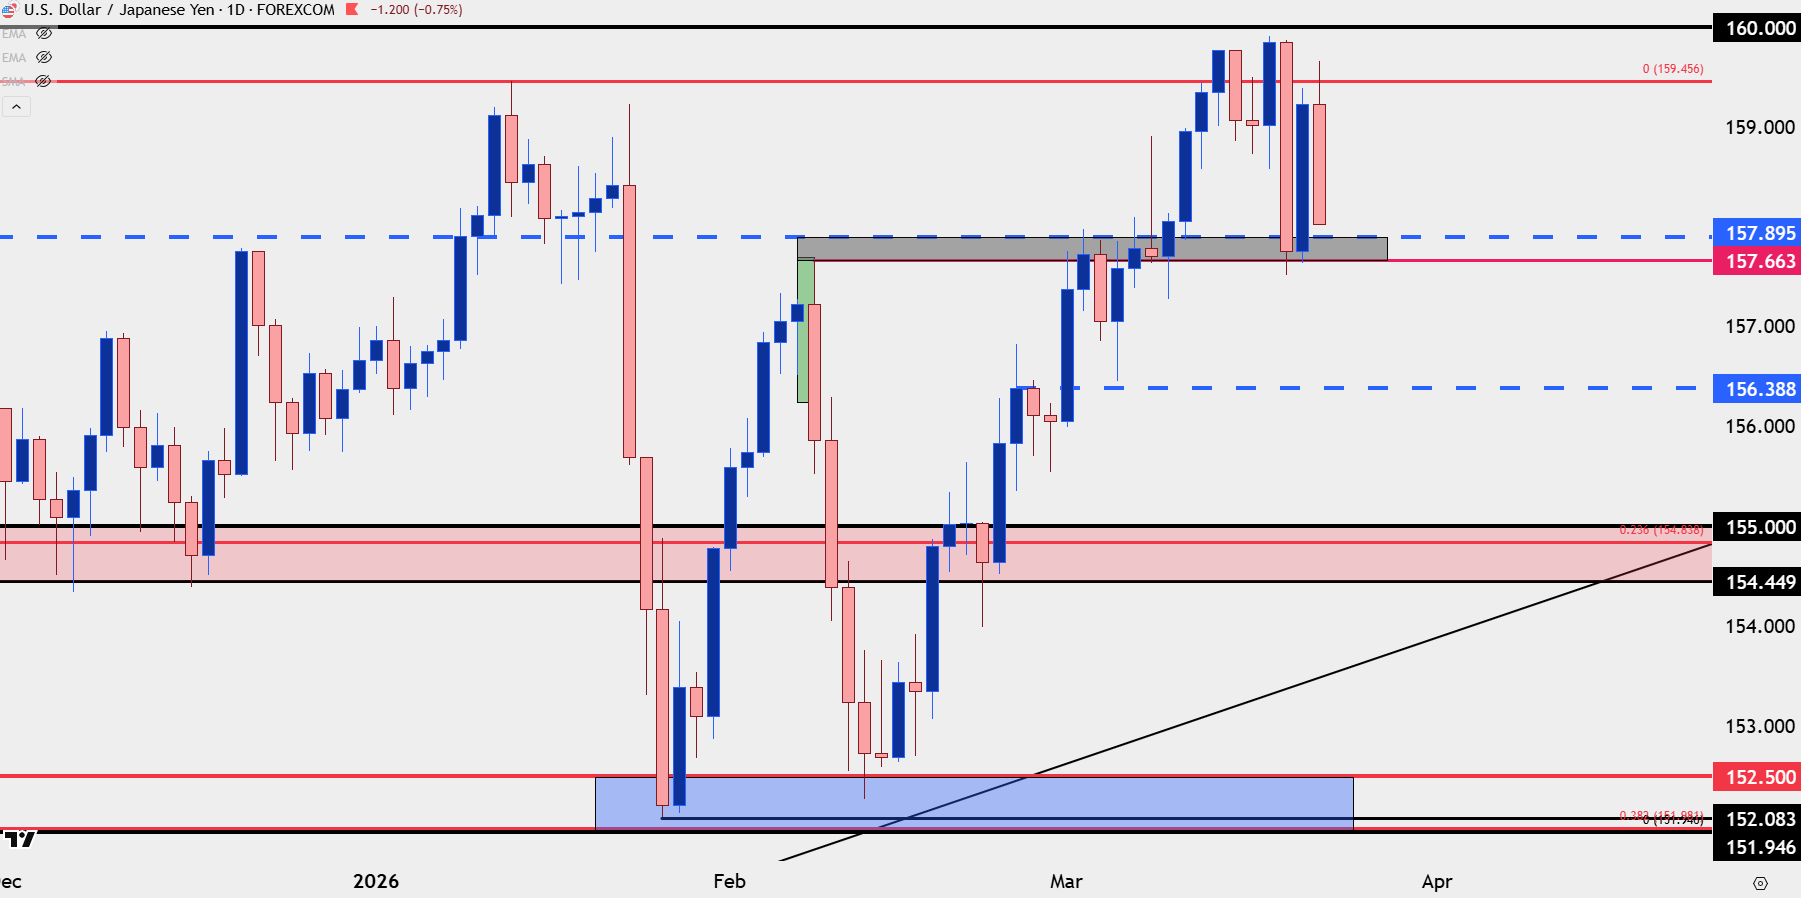
Chart prepared by James Stanley; data derived from Tradingview
USD/JPY and the Oil Correlation
As Oil prices have jumped so far in March, so too has the correlation between USD/JPY and oil futures. On the below daily chart I have the correlation plotted at bottom of the chart and as of right now that correlation is all the way at 0.88, with a 1.0 reading implying perfect correlation.
This matters because the pullback so far today is being helped by a similar pullback in oil prices but that remains a short-term item in a bigger picture, longer-term story.
USD/JPY Daily Chart with Correlation to WTI Oil Futures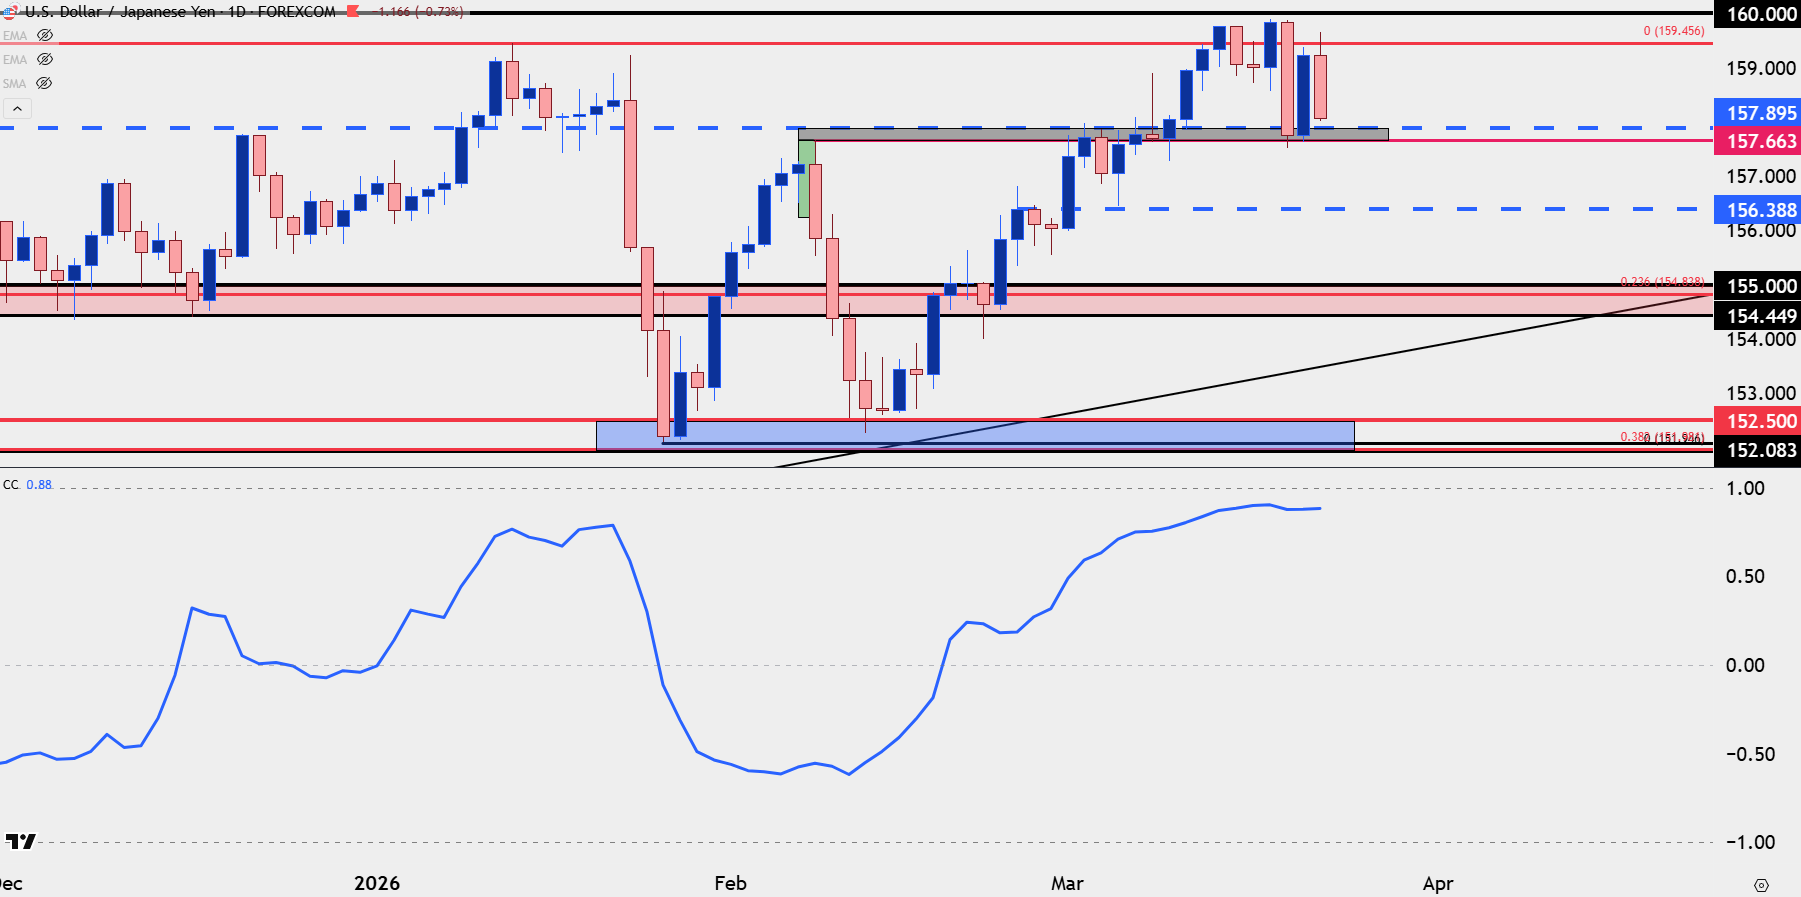
Chart prepared by James Stanley; data derived from Tradingview
USD/JPY The Intervention Threat
The 160.00 level isn’t ‘new’ as a resistance item in USD/JPY nor is the concept of intervention.
In general, currency pairs follow the flow of rates and the swap or rollover on a pair illustrates why. With higher rates in the US than Japan longs can earn swap by holding through rollover, so think of it like a near daily dividend. Shorts, on the other hand, have to pay rollover as they’re long the low yielder and short the high yielder. So longs are incentivized to hold while shorts are dis-incentivized, and this can show up in the trajectory of a trend.
This can also lead to crowded trades, and there’s consequences as the trend-side drive brings more speculators into the matter which leads to further currency imbalance, and this is what gets the focus from Japanese policymakers.
To start this week there were some pointed comments from Japan’s top currency diplomat, Atsushi Mimura, who said that “there are some views that speculative activity in the crude oil futures market is spilling over into the foreign exchange market,” then going on to say “the government is fully prepared to respond at all times on all fronts, keeping in mind that the impact that exchange-rate movements have on people’s lives and the economy.”
This can be implied as a threat that the Bank of Japan may be ordered to intervene should USD/JPY finally perch above that 160.00 level that was defended twice back in 2024, with the second example leading to a 2,000+ pip reversal.
Interestingly, however, the timing of these comments didn’t seem to unnerve USD/JPY bulls all too much, as the pair simply hovered around resistance of 159.50 until putting in a more concerted fall around the start of the US day, which coincides with a drop in oil prices on the back of Trump’s walking back of threats on Iranian energy production.
USD/JPY Four-Hour Price Chart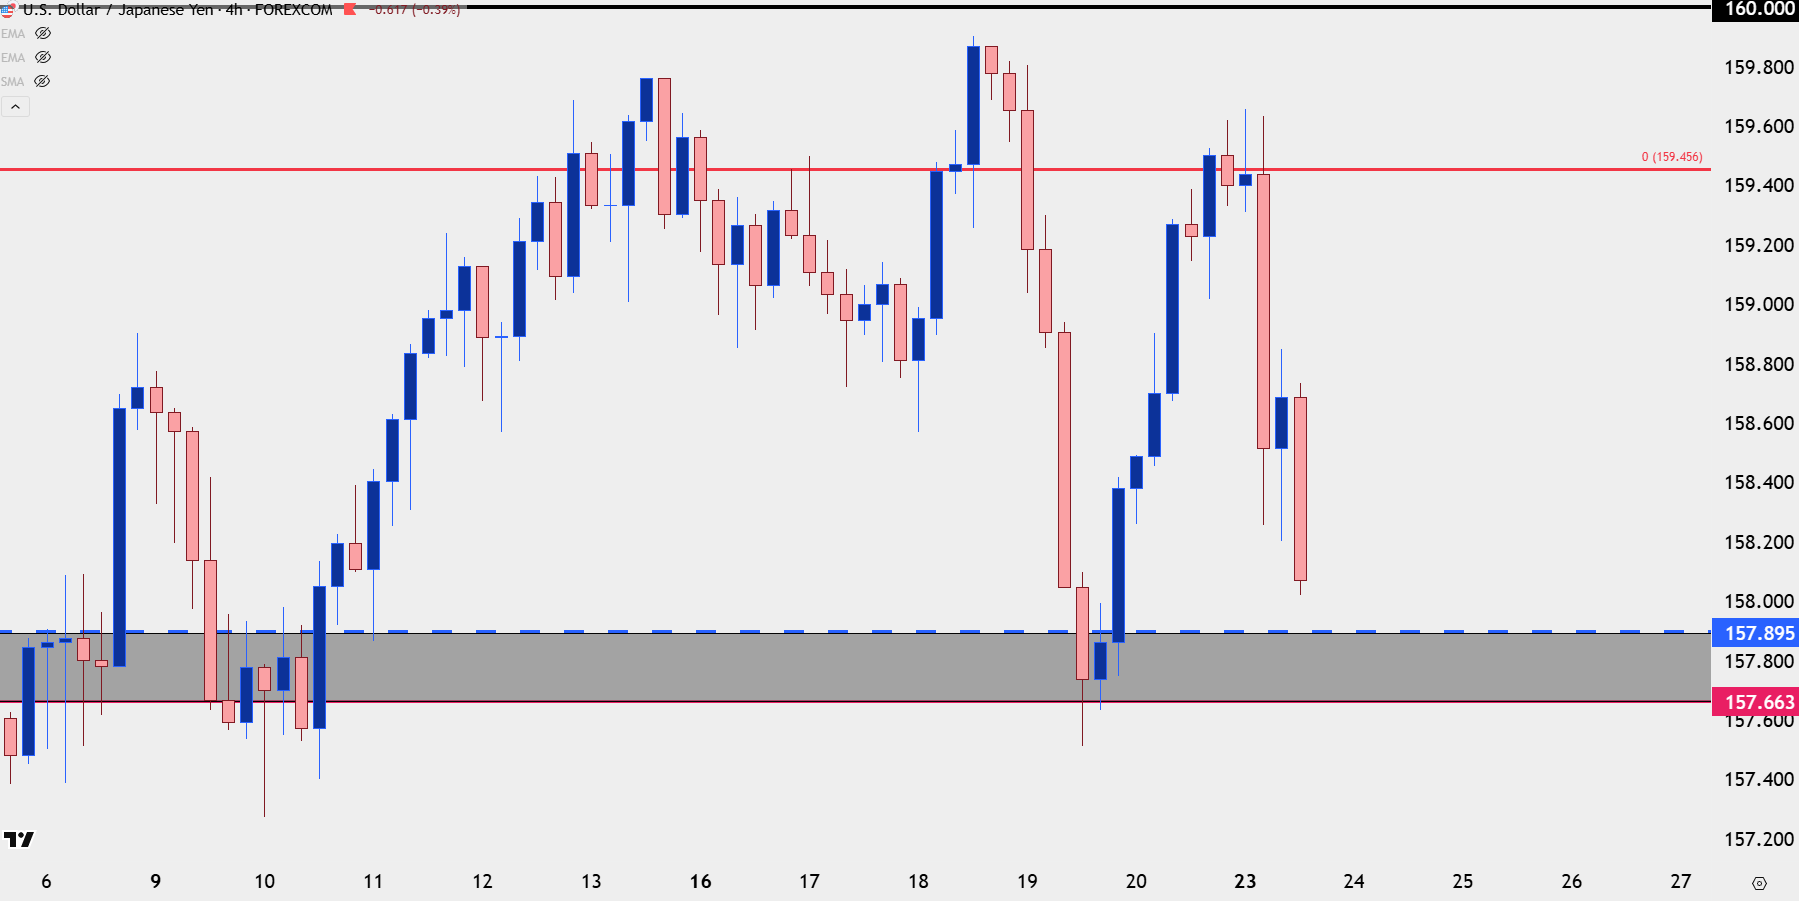
Chart prepared by James Stanley; data derived from Tradingview
EUR/JPY Bull Pennant
While USD/JPY is certainly driving Yen-flows there’s a formation in EUR/JPY worth taking note of, and that’s the bull pennant formation.
For this to play through to a bullish breakout it would seem that we would need some caution from market participants on chasing USD/JPY above 160.00 to the point that we don’t quite cross that line, which could drive the Bank of Japan into action. If we do get the intervention push, it’s difficult to imagine that USD/JPY would avoid getting hit hard which could then drive Yen-strength even against the Euro and or British Pound. But if we strike that happy medium where EUR/USD retains a tinge of mean reversion with an upwards bias, the backdrop for EUR/JPY remains attractive for bullish breakout or continuation scenarios.
EUR/JPY Daily Price Chart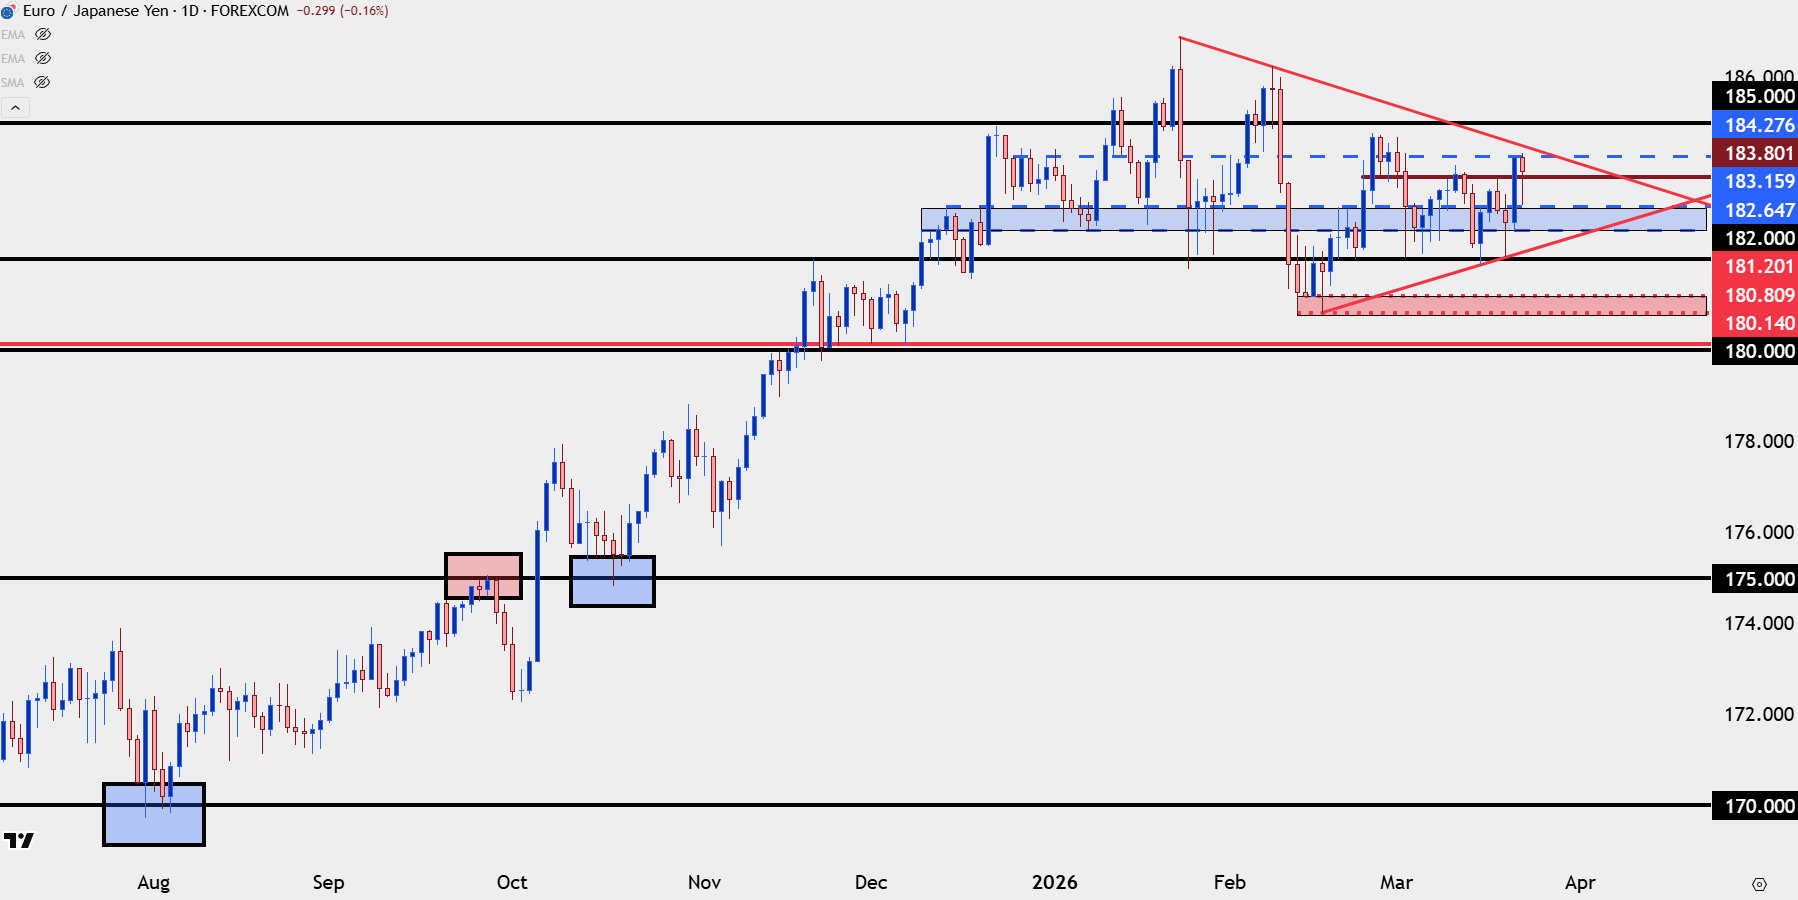
Chart prepared by James Stanley; data derived from Tradingview
GBP/JPY
While EUR/JPY is holding on to a bull pennant formation, GBP/JPY is showing an ascending triangle. I last looked at the pair a couple of weeks ago, and since then, bullish structure has continued to price in even with the dramatic events elsewhere. The support zone around the 208 level held the lows in February, and so far in March, higher-lows developed in the 209.62-210.06 zone. And now we have a second test at the 213.31 level that held the highs just a couple of days after that prior article.
For breakouts, there’s a big level about 100 pips higher but it was the 215.00 level that remained rigid in February when buyers had full control over the trend.
GBP/JPY Daily Price Chart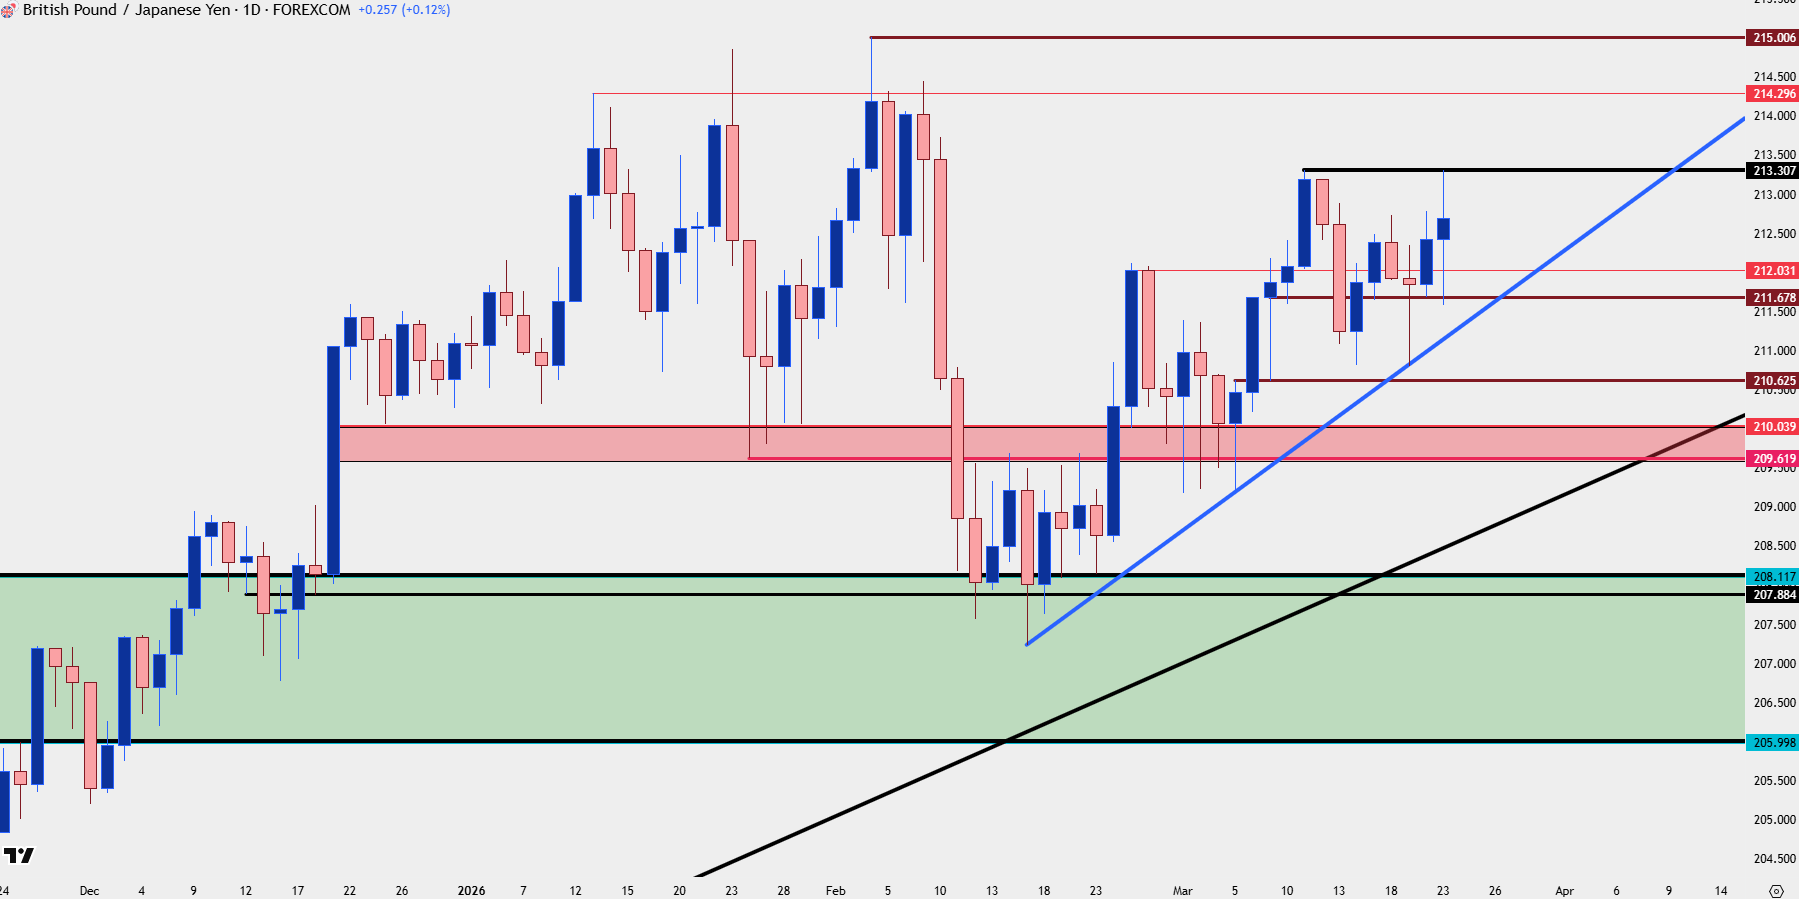
Chart prepared by James Stanley; data derived from Tradingview
--- written by James Stanley, Senior Market Analyst, Global Macro