As we came into 2025 the US Dollar had a full head of steam and there didn’t seem to be a DXY bear in sight. EUR/USD was widely assumed to be on its way to parity as the US exceptionalism trade had taken over, but it was less than two weeks into the New Year that both EUR/USD and DXY set its extreme inflection points for 2025 trade.
The rest of January was largely digestion, but as we came into the February open another theme began to take-over, and this was helped along by a comment from President Trump ahead of the February open, over a weekend, when he suggested that tariffs would be coming to European trade and that he would be targeting a degree of reciprocation.
That first February open last year was a violent one, but EUR/USD held a higher-low with defense of the 1.0200 handle, and DXY held a lower-high. The rest of February saw EUR/USD build an ascending triangle, which broke out in a very big way in March and that led to the dramatic drop in the USD that took over for the rest of the first-half of last year.
Since then, it’s been largely range and grind with both EUR/USD and DXY seemingly stuck at long-term areas of resistance and support. This weekend brought similarity with Trump threatening to impose aggressive tariffs on Europe, and this has led to a decisive USD sell-off to go along with a EUR/USD rally.
As I’ve been saying, I think both markets are positioned poorly for strategy, although USD-weakness can look more favorable against the bullish structure of GBP/USD while USD-strength fits well with the continued strength of USD/JPY. In this webinar, I looked at scenarios for USD and EUR/USD that would need to take place to make for a more-directional push to take-over.
USD
In the Dollar we’ve continually seen Trump take swings at getting the currency weaker and that’s become commonplace in his first year (of his second term). While that had a forceful impact in the first-half of last year, there was also the prospect of worsening economic data brought upon by fears of tariff implementation, which Trump ultimately backed off of in April. That is, perhaps not coincidentally, when USD/JPY bottomed, and both the pair and US equities came back to life in a very big way.
But since the second-half of last year, the Dollar has largely been range-bound and this mirrors the dynamics of EUR/USD quite well.
US Dollar Weekly Chart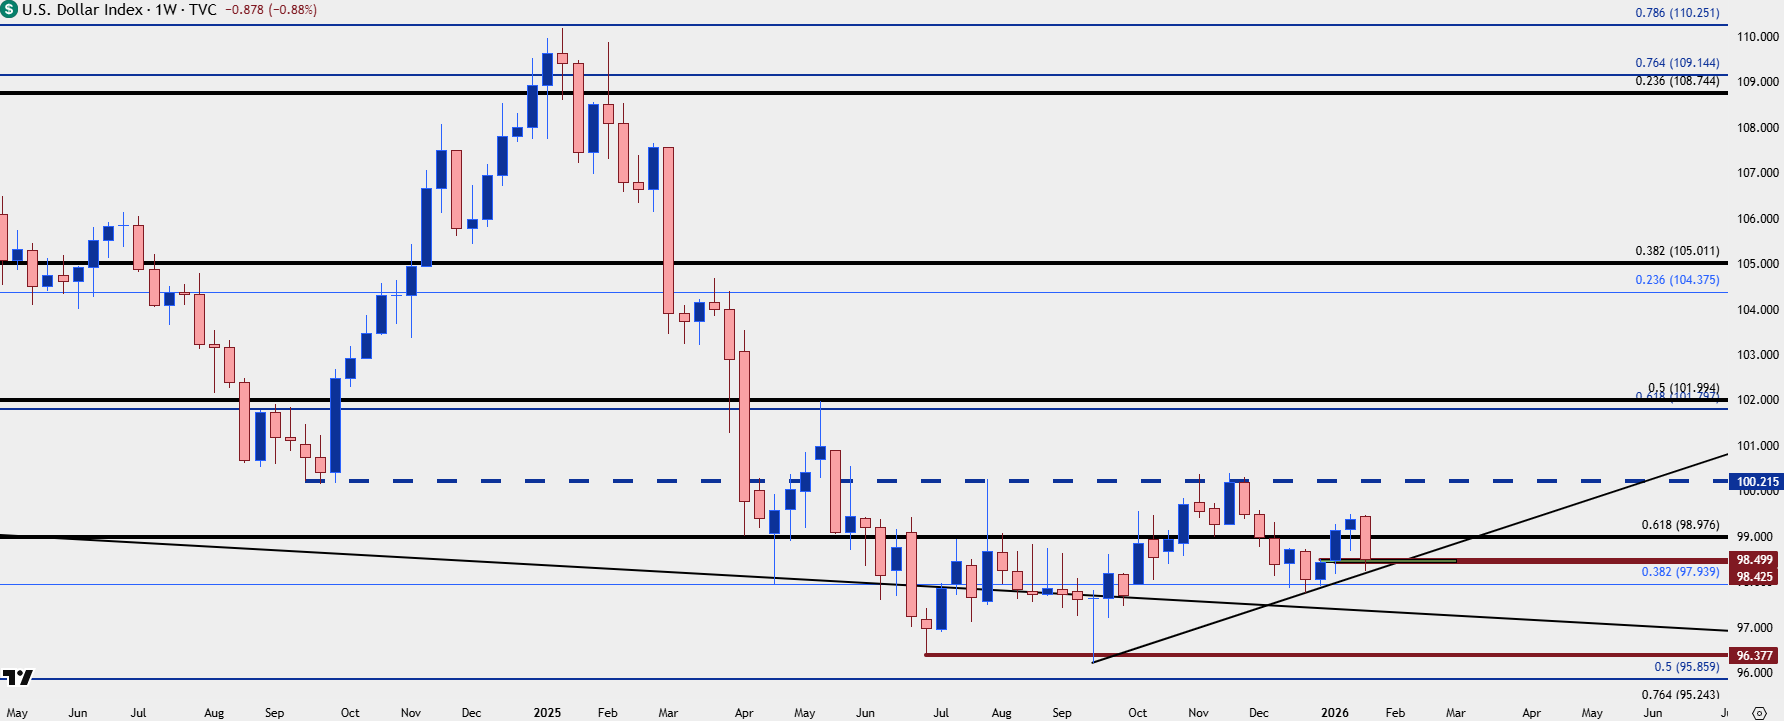
Chart prepared by James Stanley; data derived from Tradingview
USD Support Test
Chasing a move like we’ve seen over the past couple days can be a challenge, and at this point, there’s some support playing through from a prior resistance zone, taken from around 98.43-98.50. For those looking to sell – a re-test and hold of resistance at the 98.98 level could be notable, and for deeper support, there’s a trendline projection and then the Fibonacci level of 97.94 just below.
US Dollar Daily Chart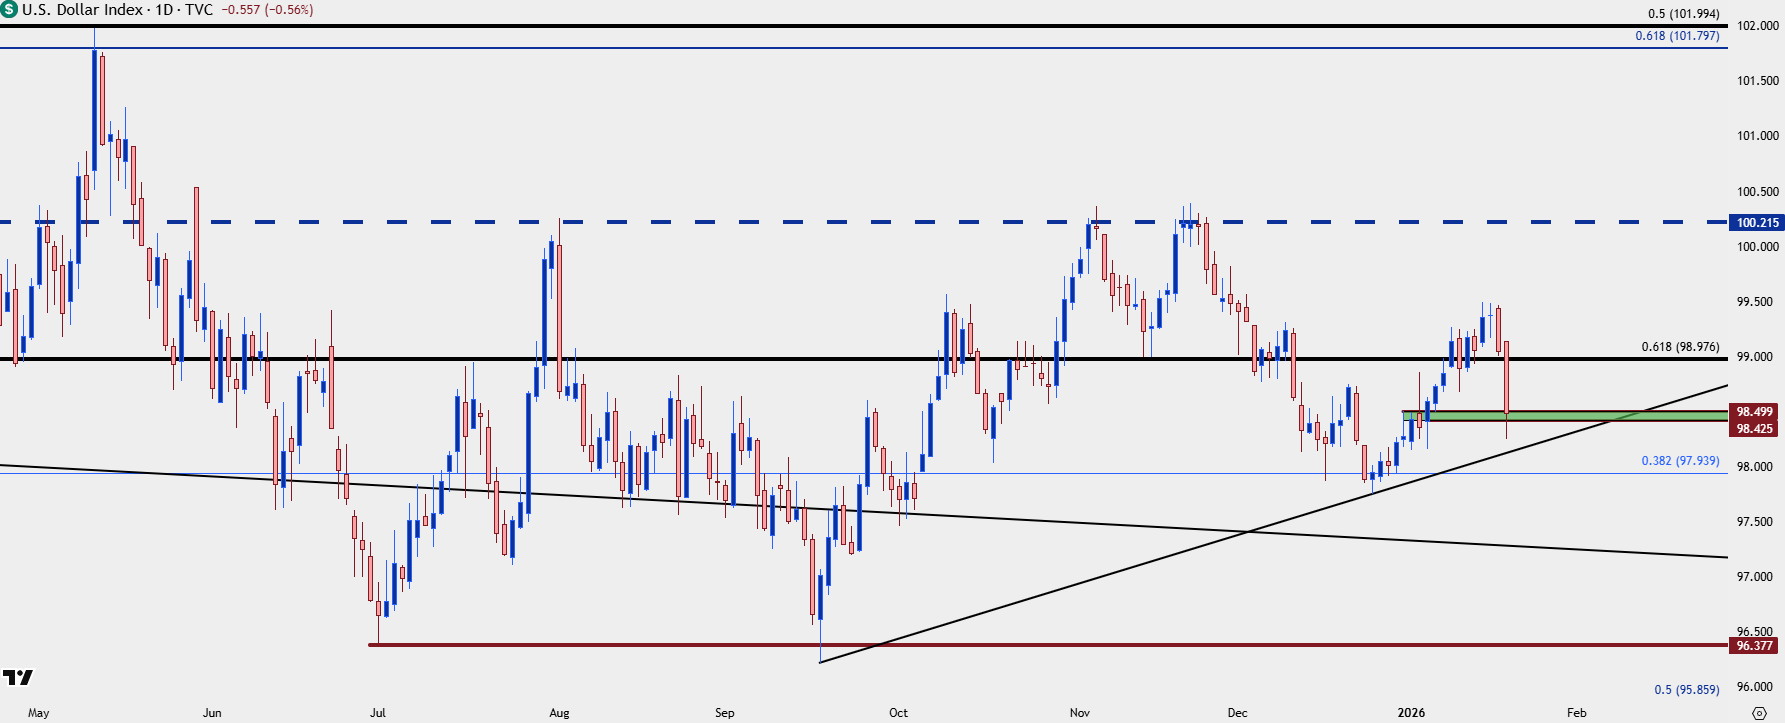
Chart prepared by James Stanley; data derived from Tradingview

EUR/USD
The 1.1593 level looked at in Friday’s article and video has held well so far, and that’s led to a breakout with bulls taking control of near-term trends.
The challenge at this point is the overbought readings on the four-hour chart, which caution against chasing. For those that do want to push bullish strategy, there’s support potential at 1.1686 and then 1.1656, with 1.1616 just below that.
EUR/USD Four-Hour Price Chart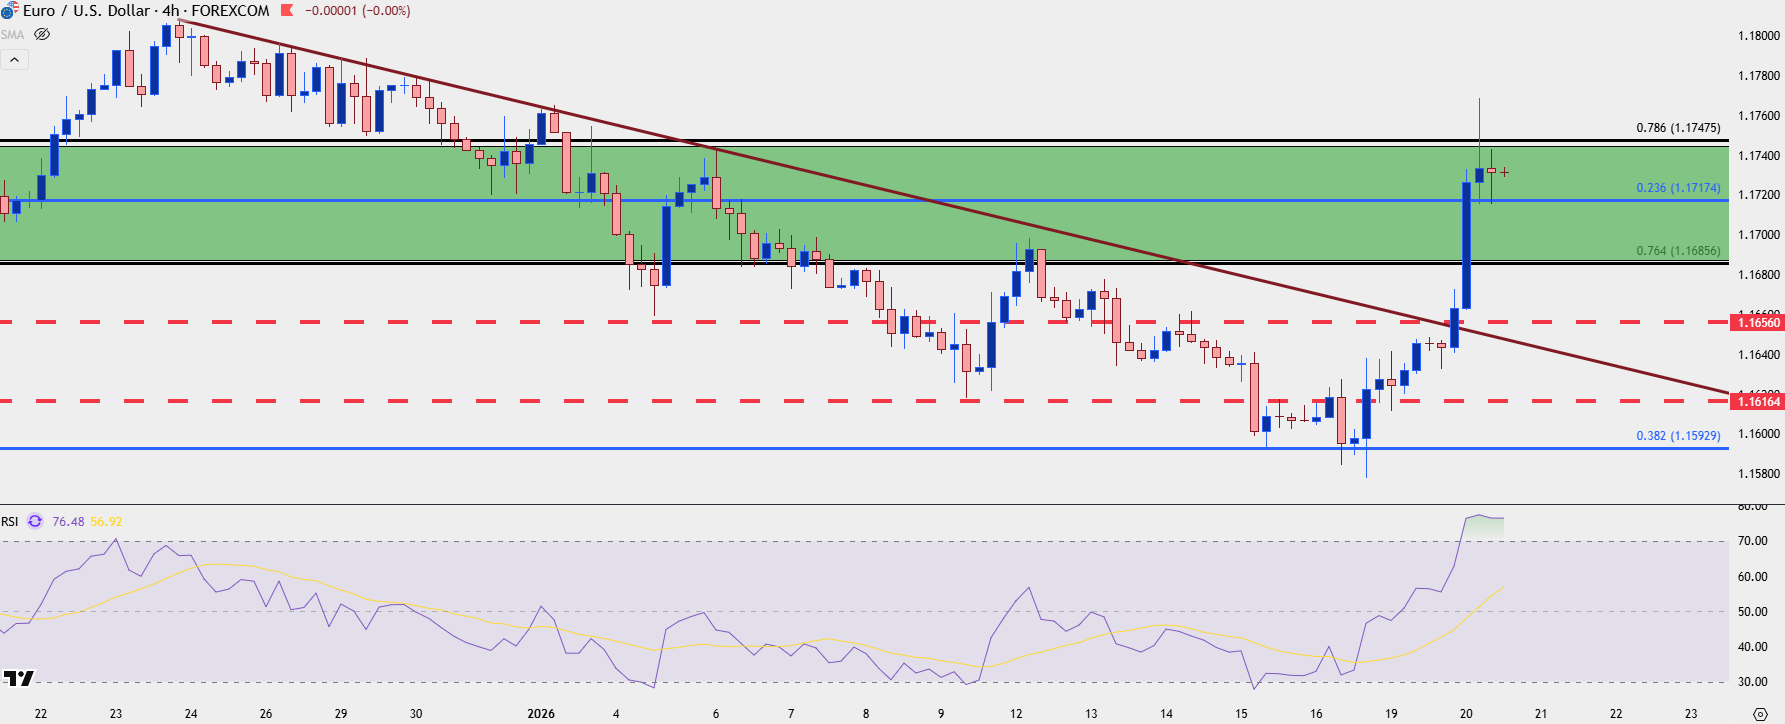
Chart prepared by James Stanley; data derived from Tradingview
GBP/USD
Cable is the market that I’ve been tracking for USD-weakness setups and while the current move in DXY appears to be heavily driven by the Euro, I still prefer the bullish structure of GBP/USD.
The falling wedge formation looked at in Friday’s video and article has since broken out, with a clean hold of support at the zone noted there. In the webinar, I added a couple of shorter-term levels that are notable for higher-low support potential.
I also shared the alternative of looking for GBP-weakness elsewhere, such as against the Japanese Yen.
GBP/USD Four-Hour Price Chart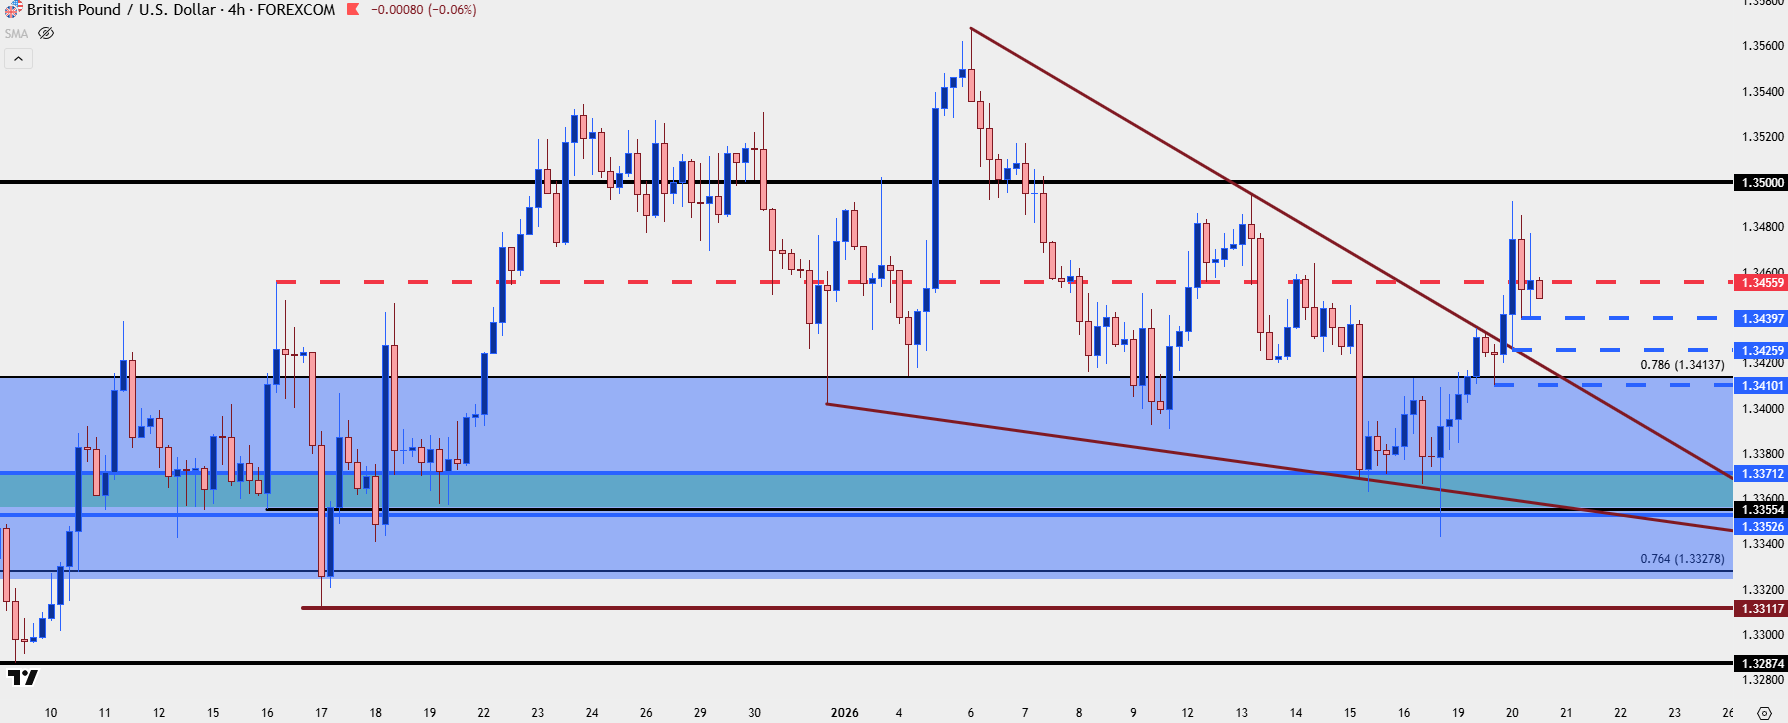
Chart prepared by James Stanley; data derived from Tradingview

USD/JPY
Despite the Dollar carnage apparent in most other major markets, USD/JPY has held up fairly well, all factors considered. Of course, this speaks to Japanese Yen weakness, which can also be sought out in other pairings, such as EUR/JPY or GBP/JPY, both of which have shown strong bullish moves in early-week trade.
USD/JPY remains the most attractive venue for USD-strength, in my opinion, and the 160.00 level remains a challenge as that could continue to show as resistance for a bit. This means that chasing is a challenge but pullbacks can still be of attraction, and notably, price hasn’t been able to continue the pullback into longer-term supports at 157.17 or 156.67. Near-term, the 158.19 level stands out as a spot that bulls can exhibit control.
USD/JPY Four-Hour Price Chart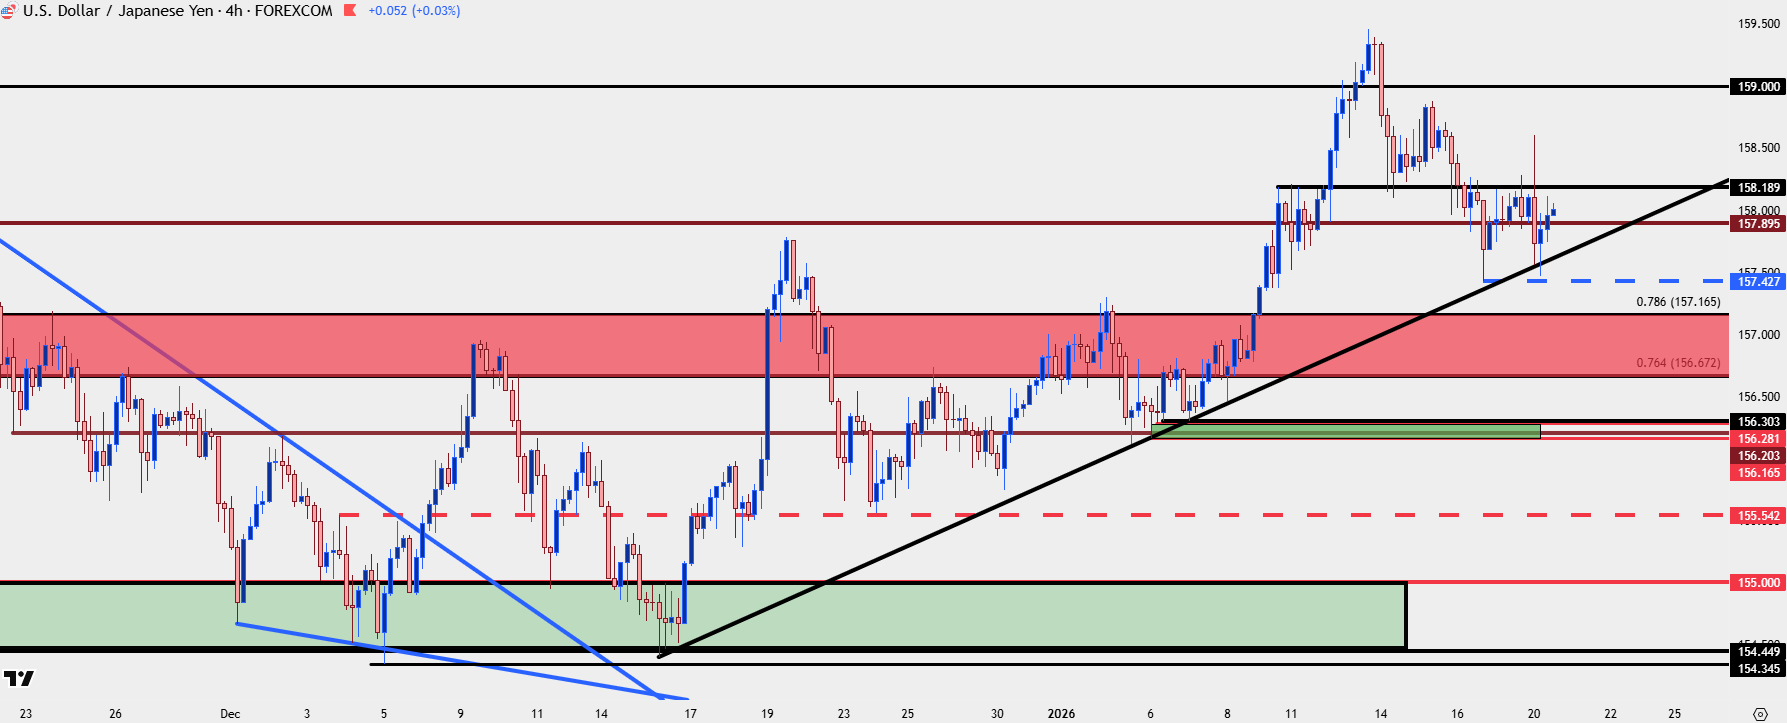
Chart prepared by James Stanley; data derived from Tradingview
Gold
While many currency markets like EUR/USD and DXY remain in a state of flux with range-bound price action becoming commonplace over the past year, one market that’s remained in a more decisive manner is gold. This is my top trade idea for 2026 and through a multitude of macro themes over the past two years, the bullish trend here has persisted.
The challenge at that point becomes one of positioning, as the trend-side bursts to the upside become more and more difficult to jump on; and it’s when price pulls back to support that the general masses seem to be their least optimistic.
But there are pullbacks, such as the falling wedge looked at a couple of weeks ago, or like last Friday, when price re-tested the 4550 level before breakout to another fresh ATH. The challenge then becomes patience.
Gold Four-Hour Chart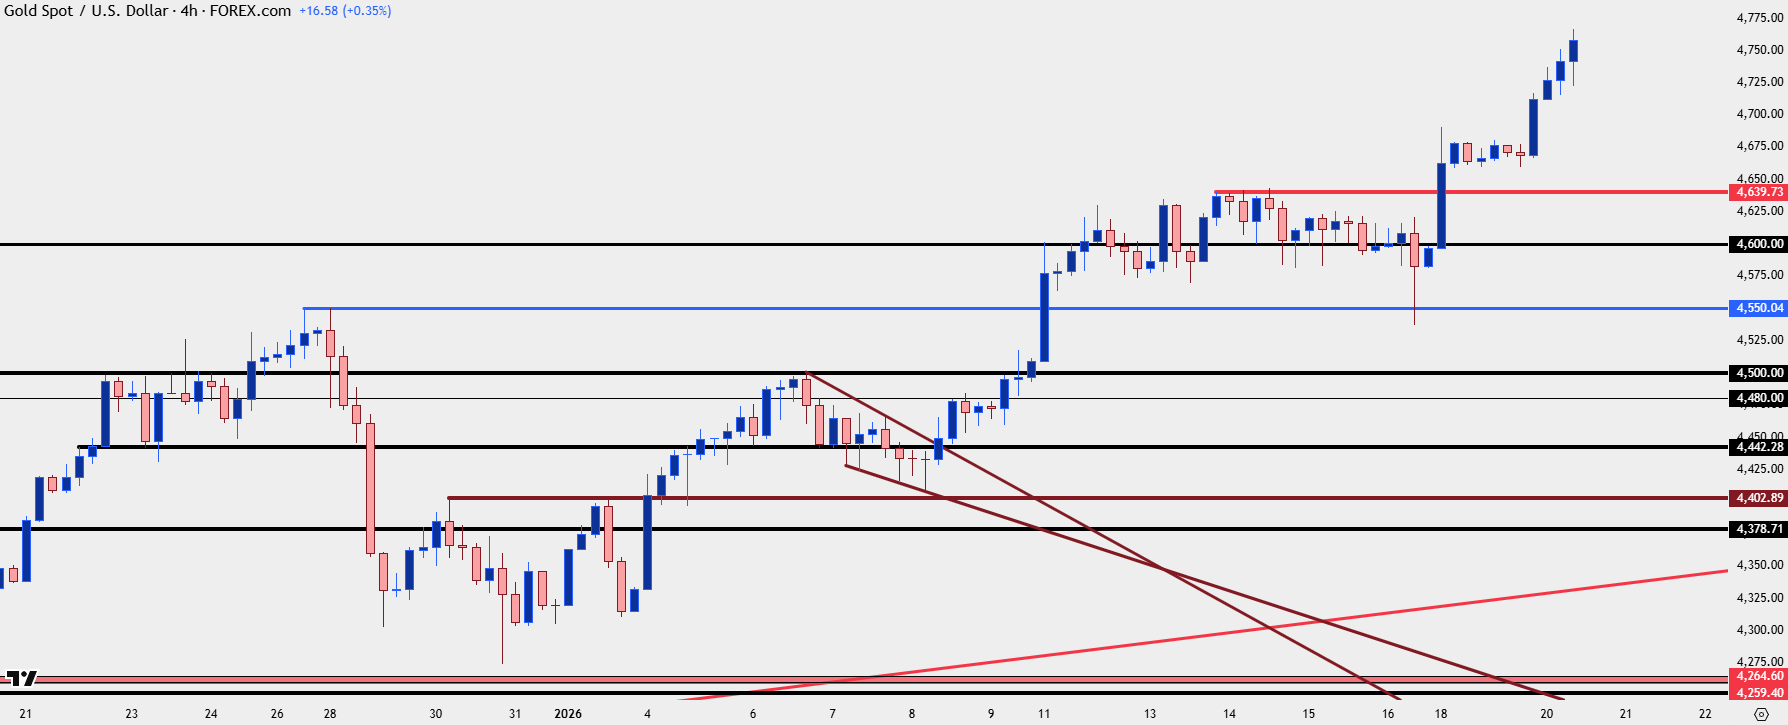
Chart prepared by James Stanley; data derived from Tradingview
SPX
On that topic of patience – the other side of that is addressing the emotional aspect around trading which will often drive from watching a trend take place that we’re not a part of. This can lead to a fear of missing out, which can then drive ill timed entries or ‘chasing’ and there’s currently a setup on the short side of equities that speaks to that.
For the past few months there’s been the build of a rising wedge pattern in SPX. Such formations are often tracked with aim of bearish reversals, and so far this week, that’s what’s taken over as the index gapped-down and has continued to sell-off. This is where that excitement element could coerce traders into chasing while the index is at lows, but this can be an imprudent way of going about matters, and it could possibly lead to selling a low.
For those that do want to get short – and for those that do want to trade the rising wedge break – there’s now a few different spots of resistance potential to work with. Nearby is a prior swing low, the same that held trendline support last week at 6885. Above that, we have a spot of resistance-turned-support at 6926. And then just above that, we have the top of this week’s gap at 6939.
SPX Two-Hour Price Chart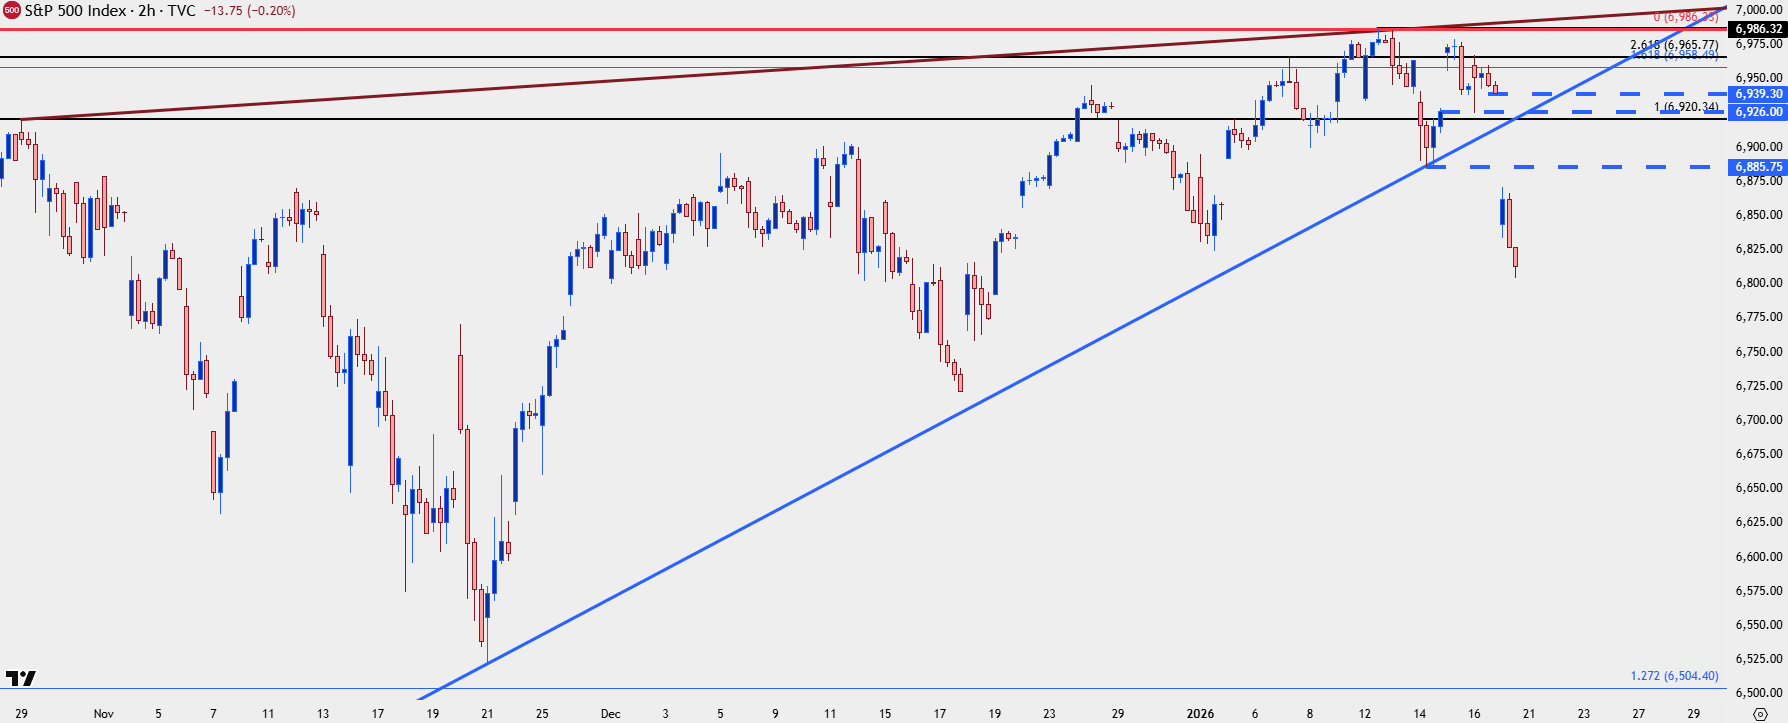
Chart prepared by James Stanley; data derived from Tradingview
BTC
Perhaps the most beneficial aspect of price action is it’s objectivity. But this can also be somewhat painful especially when that objectivity runs counter to our own theories or ideas. At that point, one has a choice, either stay wrong and hope or reconcile and respect reality.
I’m nearing that point on Bitcoin. For the past couple of months I’ve looked for a familiar script to play out, when an overbought gold market calmed and then anti-fiat flows shifted into Bitcoin. This is what happened in the summer of 2020 and then again during the formation of bull pennants in gold in 2024 and 2025.
More recently however, that has not been taking place and there’s another point of failure showing currently as Bitcoin has turned around even as gold and silver have advanced aggressively. Bitcoin bulls aren’t completely cooked yet, but that scenario may not be far off. In the webinar, I shared my working theory as to the ‘why’ behind this but, for now, BTC/USD is at a critical point of support that buyers must defend, or they risk a much steeper sell-off as something in the backdrop has obviously shifted.
BTC/USD Daily Price Chart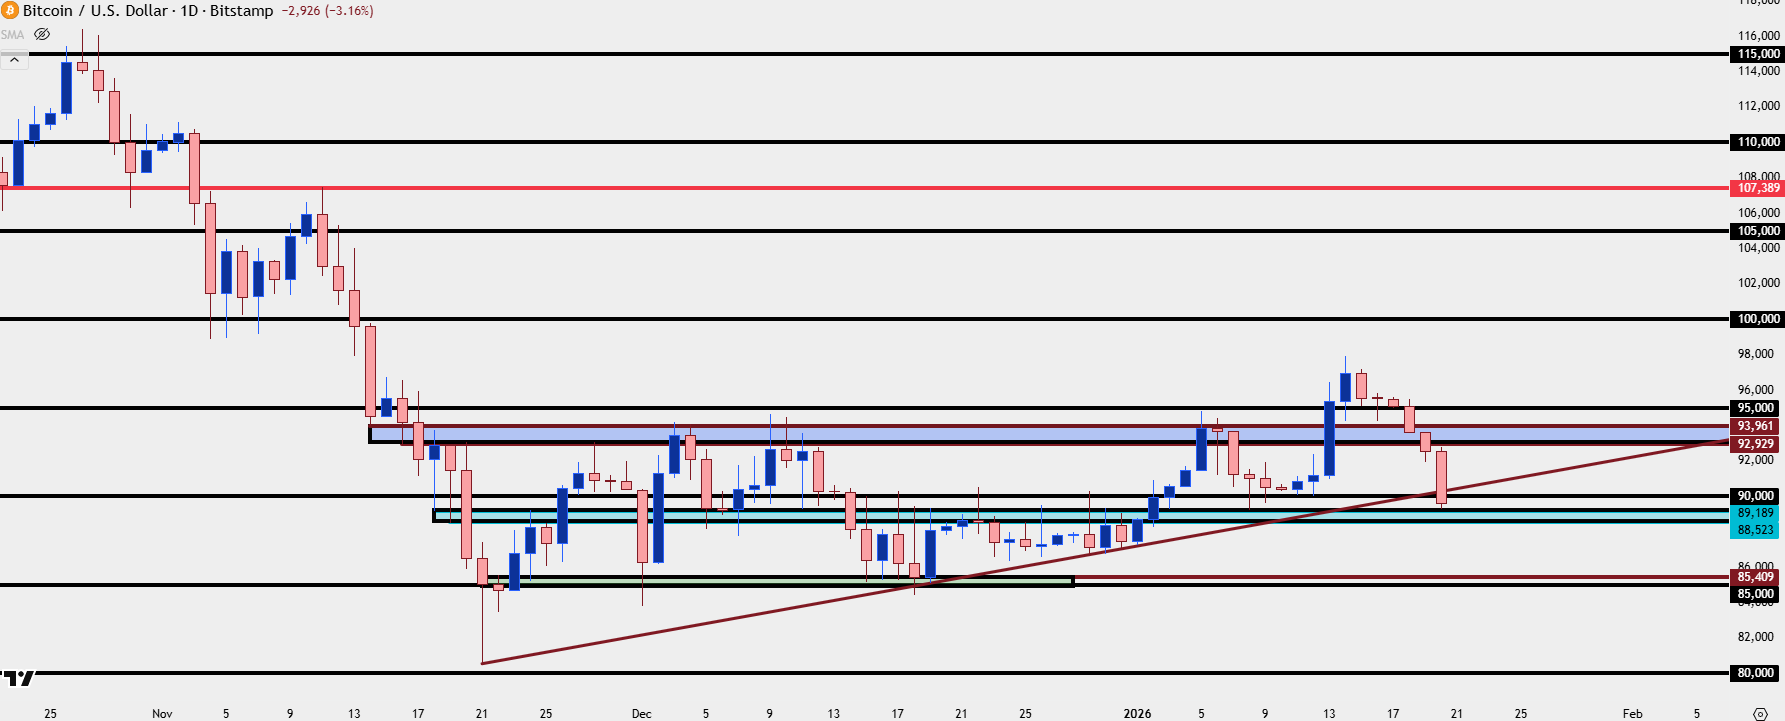
Chart prepared by James Stanley; data derived from Tradingview
--- written by James Stanley, Senior Market Analyst, Global Macro