


Recent sessions have been marked by heightened volatility in USD/JPY, as the pair has posted a decline of more than 2.11% on average over the last three trading days, reflecting a notable bearish bias that had not been seen in several months and highlighting a meaningful recovery in favor of the Japanese yen.
The main driver behind this strong selling pressure has been expectations that emerged toward the end of last week regarding a possible intervention by the Japanese government and the Bank of Japan, aimed at purchasing yen. This event triggered sharp downside moves in the short term.
However, over the weekend, there were no clear confirmations regarding the continuation of this dynamic. As a result, in the absence of further information, a phase of indecision may begin to dominate USD/JPY price action in the coming sessions.

Possible intervention?
The end of last week marked a key turning point for USD/JPY. After the pair approached recent highs, reports surfaced of a potential intervention in the FX market by the Japanese government and the Bank of Japan through the purchase of yen and the sale of US dollars.
It is estimated that these operations could have reached between 5 and 6 trillion in yen purchases, which would represent the first intervention of this type since July 2024. This is particularly relevant as it suggests a shift in the country’s stance toward its currency.
The situation gained further attention when the Finance Minister stated that Japan was prepared to carry out significant FX operations. However, no concrete updates have been provided since then, and the same official has refrained from confirming direct action, maintaining an ambiguous stance.
This lack of confirmation has led to a pause in volatility, leaving the market waiting for clearer signals on whether this intervention dynamic will persist.
The rationale behind such intervention is likely linked to the economic impact of a weak yen, which increases the cost of imported energy and food, potentially generating additional inflationary pressures. In this context, intervention would aim to mitigate these effects.
Taking all of this into account, this event stands out as one of the most relevant catalysts for the yen this year. If further interventions are confirmed or if a structural shift in exchange rate policy emerges, downside pressure in USD/JPY could intensify again in the coming sessions.
The dollar shows signs of stabilization again
Another important factor for USD/JPY is that, despite the strong selling pressure seen at the end of last week, recent sessions have started to reflect a phase of indecision, driven by two main factors: the lack of new signals from Japan and the stabilization of the US dollar.
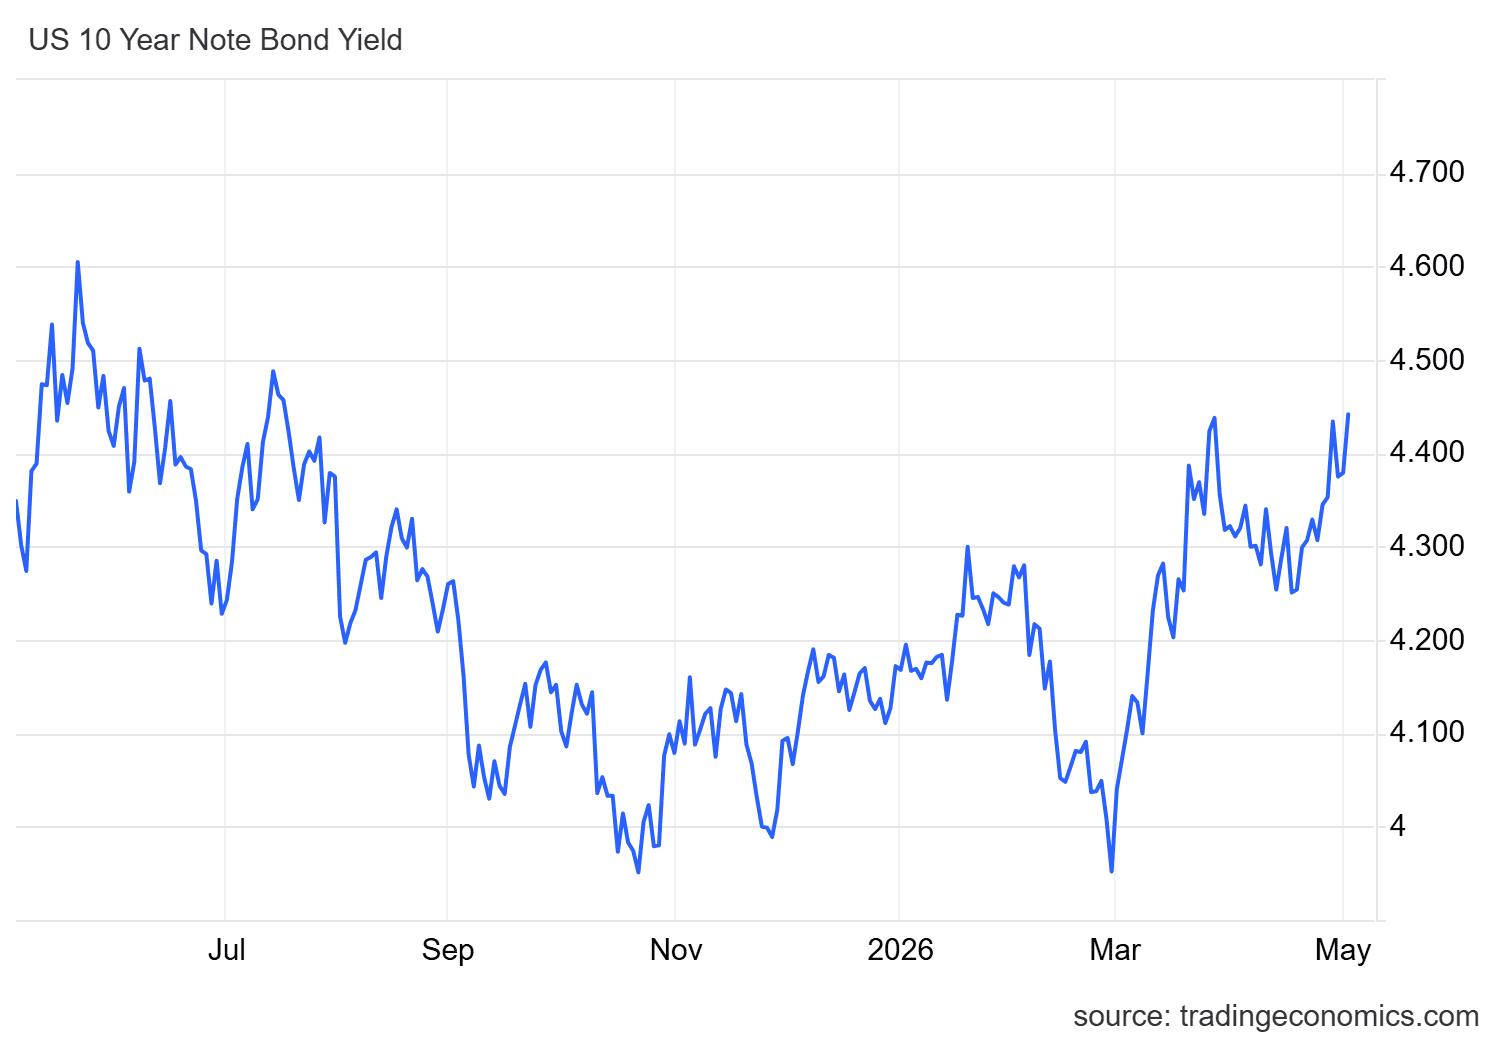
This behavior is closely linked to the bond market. US 10-year Treasury yields have resumed an upward trend, approaching the 4.5% level, near recent highs.
Source: TradingEconomics
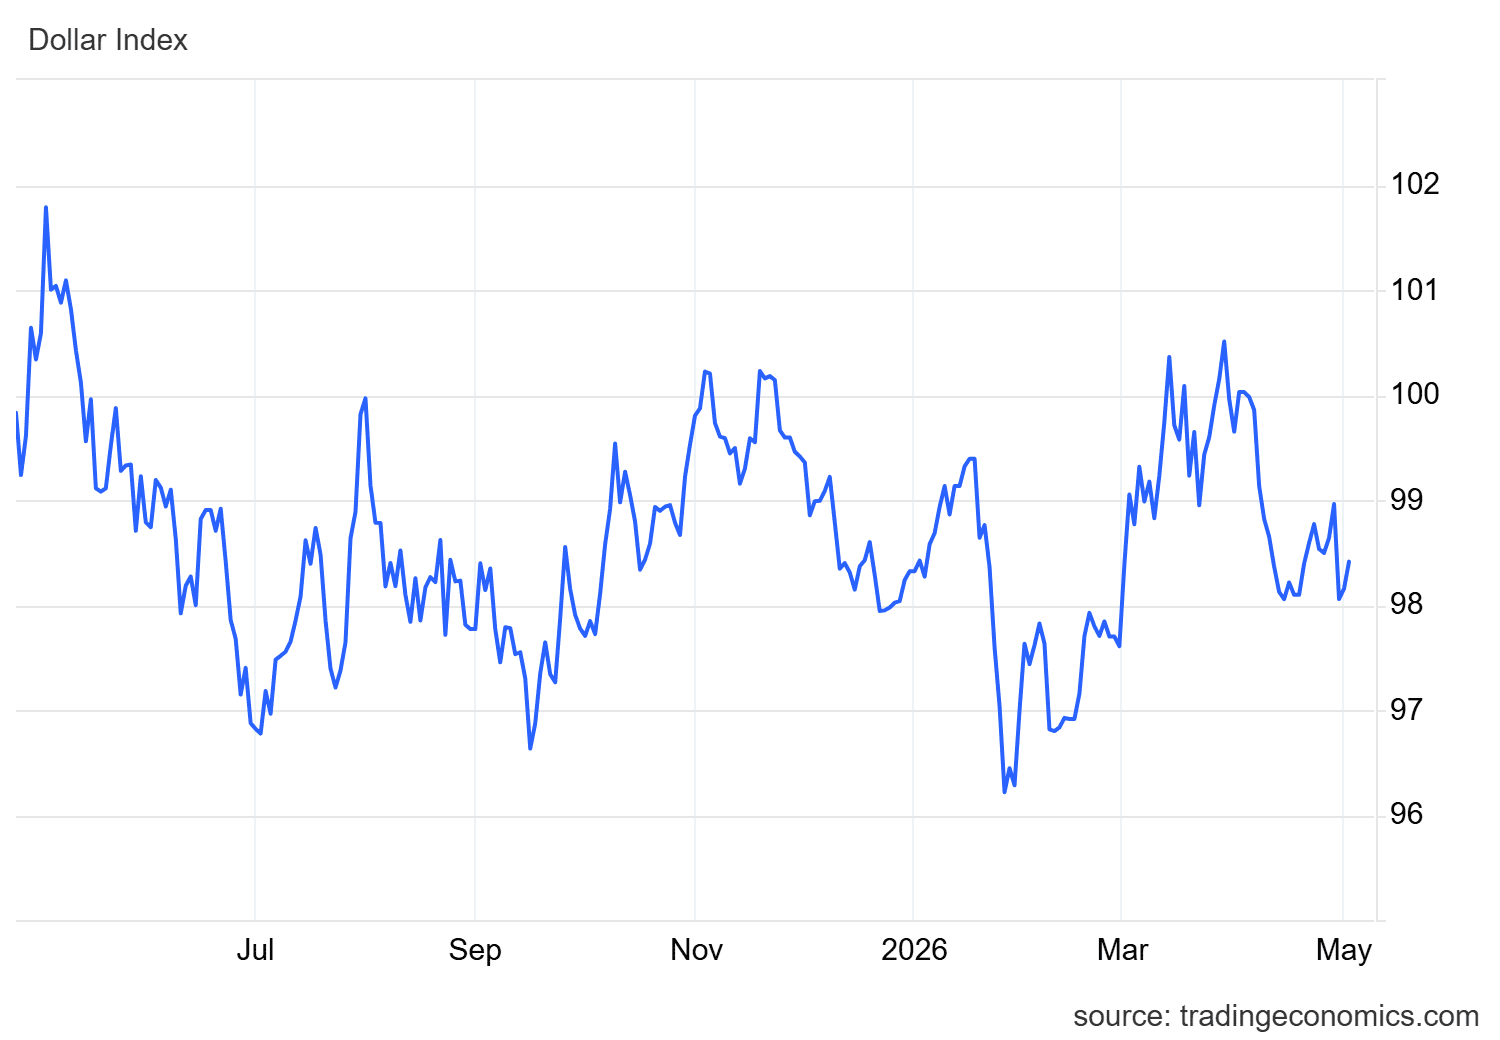
Rising yields reinforce the attractiveness of the US dollar, as they encourage capital inflows into fixed income markets. This effect has also been reflected in the DXY index, which has started the week with upward movements toward the 98.5 level, indicating a recovery in demand for the dollar in the short term.
Source: TradingEconomics
This environment is key because it limits the yen’s ability to continue appreciating in a sustained manner. As a result, this combination of factors has begun to generate a phase of neutrality in USD/JPY in recent sessions.
In this context, any break from this indecision will likely depend on new signals from Japan, particularly regarding intervention or changes in FX policy.
Technical outlook for USD/JPY
Source: StoneX, Tradingview
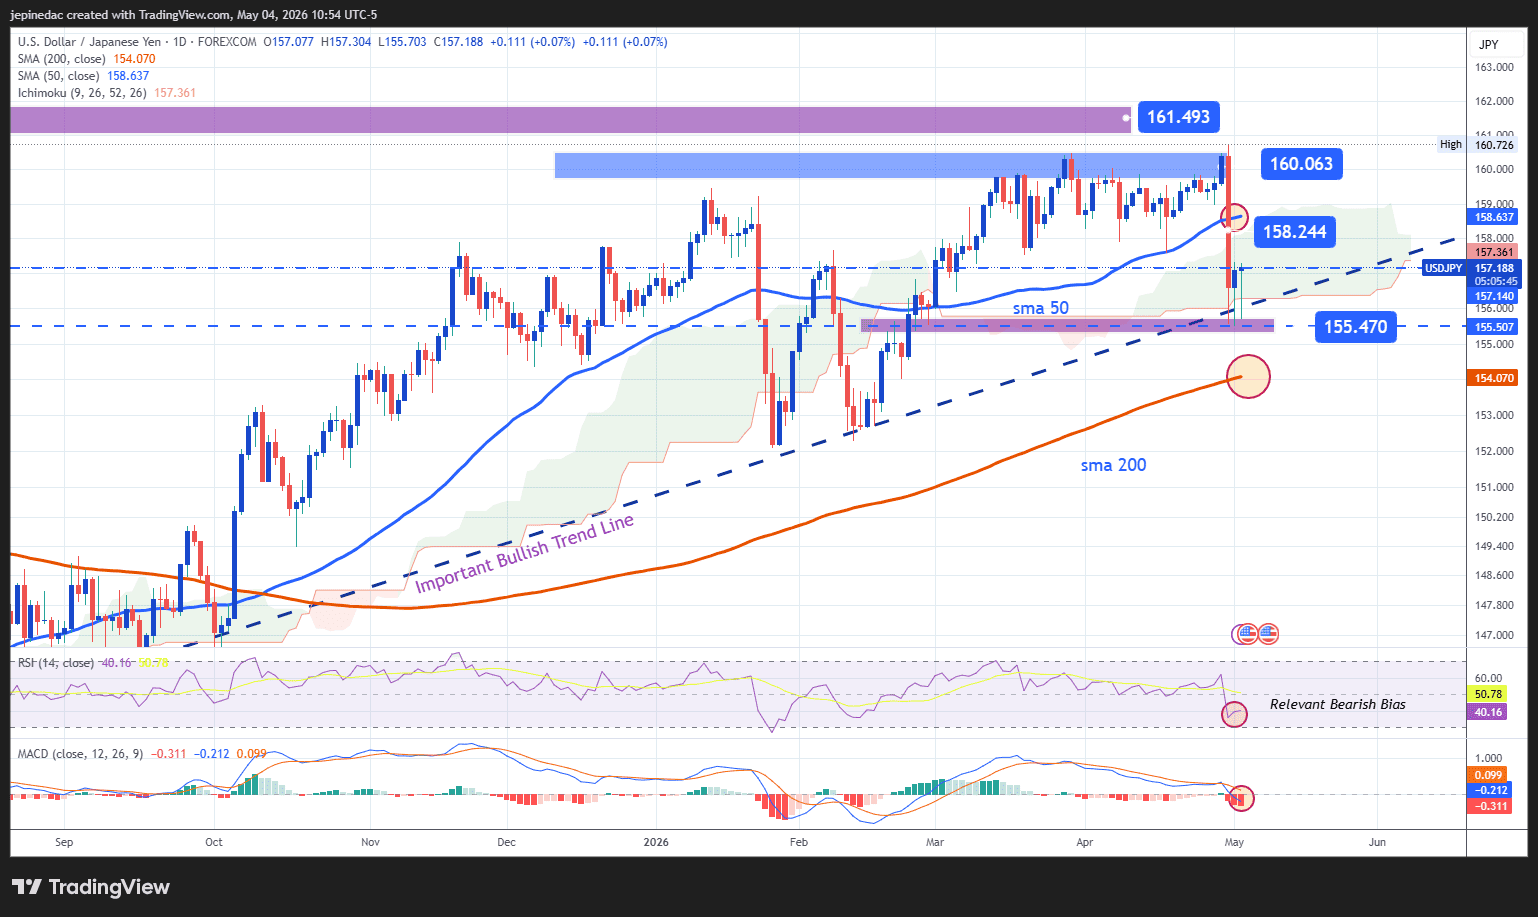
- Long-term uptrend under pressure: Although USD/JPY has maintained an upward structure for several months, the recent bearish move has started to challenge the strength of this trend. The price is now testing a key zone, pressing against the long-term trendline that has acted as support. If selling pressure consolidates, a break below this structure could trigger a more meaningful trend reversal in the short to medium term.
- RSI: The RSI remains below the 50 level, indicating that selling momentum is still dominant in the short term. Recent price action also shows that downside pressure has not yet weakened, which could continue to support corrective moves. If RSI remains in this zone, it may reinforce a bearish outlook unless the neutral level is regained.
- MACD: The MACD shows a similar pattern, with the histogram remaining below the zero line. This suggests that short-term moving average strength continues to favor a bearish bias, supporting the likelihood that downside moves remain relevant. As the histogram continues to post lower lows, selling pressure could become more dominant.
Key levels:
- 160.000 – Key resistance: A key psychological level aligned with recent highs. Moves toward this area could restore strength to the broader uptrend and reintroduce bullish momentum in the coming sessions.
- 158.244 – Near-term barrier: A neutral zone aligned with the 50-period moving average. This level could act as a reference point for potential short-term rebounds.
- 155.470 – Key support: A level of recent lows aligned with the base of the long-term trendline. A break below this level would put the current bullish structure at risk and could lead to a more dominant bearish bias over the coming weeks.
Written by Julian Pineda, CFA, CMT – Market Analyst
Follow him on: @julianpineda25




