
Dollar pair gains are holding key resistance levels ahead of major central bank meetings this week, following the RBA rate hike and further crude supply disruptions in the Middle East. Market sentiment remains cautious, with rate holds and hawkish tones expected, raising questions about whether the latest dollar and dollar pair surge has already priced in central bank policy expectations, leaving the currency vulnerable to near-term reversals.
Central Bank Meeting Schedule
- RBA lifted rates from 3.85% to 4.10% today
- BOC and Fed are expected to hold rates at 2.25% and 3.75% on Wednesday
- BOJ, SNB, BOE, and ECB are also expected to hold rates on Thursday
The dominant market theme remains crude oil and the Middle East conflict, supporting the US dollar, alongside the RBA rate hike and extended rate hold expectations for the Fed this week, as crude holds near $100.
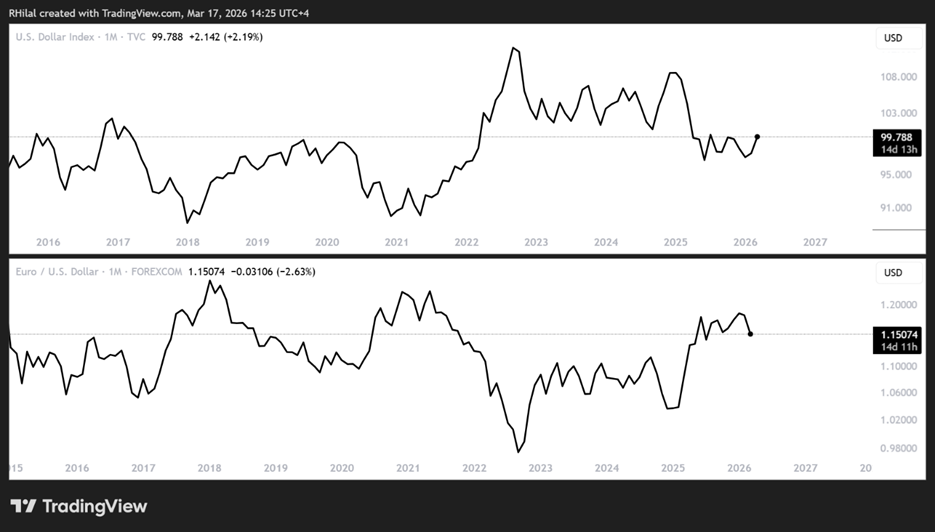
Key Levels to Watch on the DXY
- Upside breakout risks: > 100.50
- Downside risks: < 99.50
DXY Outlook: Monthly Time Frame – Log Scale
Source: Trading view
A closer look at the price action of the US Dollar Index and the EURUSD pair on the monthly chart reflects consolidation since June 2025, possibly forming a double bottom for the DXY below the 100.50 neckline. A close above 100.50 would confirm the bullish reversal pattern, opening the path for extended gains across major dollar pairs, including USDJPY and USDCAD, as well as steeper losses in currencies and metals.
For further insights on the DXY and EURUSD Outlook: Video
Key Events to Watch:
- FOMC, ECB, and BOJ outlooks for potential impacts on the DXY and USDJPY
- Pricing risks for the DXY should the FOMC meeting align with market expectations
- The Strait of Hormuz and oil supply developments in the Middle East
USDJPY Outlook: Monthly Time Frame – Log Scale 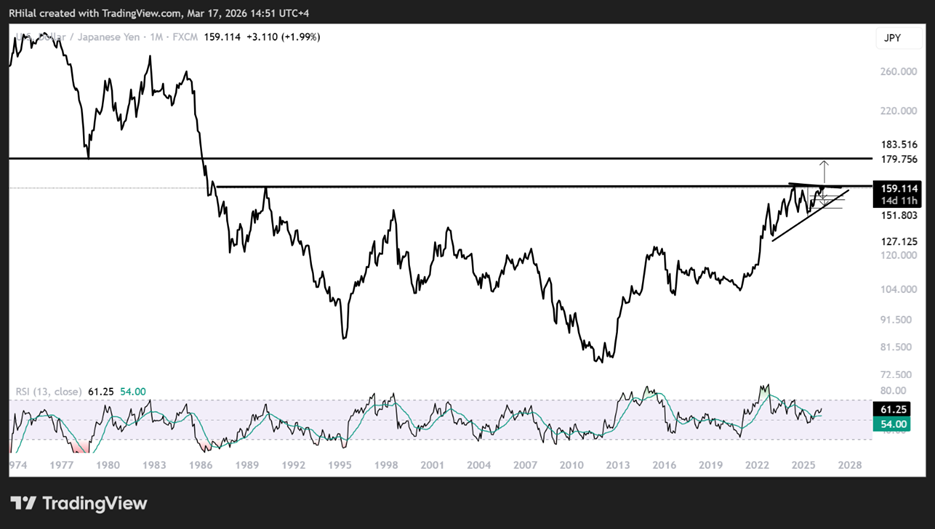
Source: Trading view
The line chart is used here to minimize noise on the monthly time frame and better visualize price action relative to the 1978 trough and the 1990 high. USDJPY is holding below the 159.80 resistance and the 1990 high, a level that could open the path toward the 180 zone near the 1978 low, should a decisive close occur above 160 and 163.
This scenario would likely align with a bullish breakout in the DXY against global currencies. The downside scenario is outlined below on the weekly time frame using candlestick analysis.
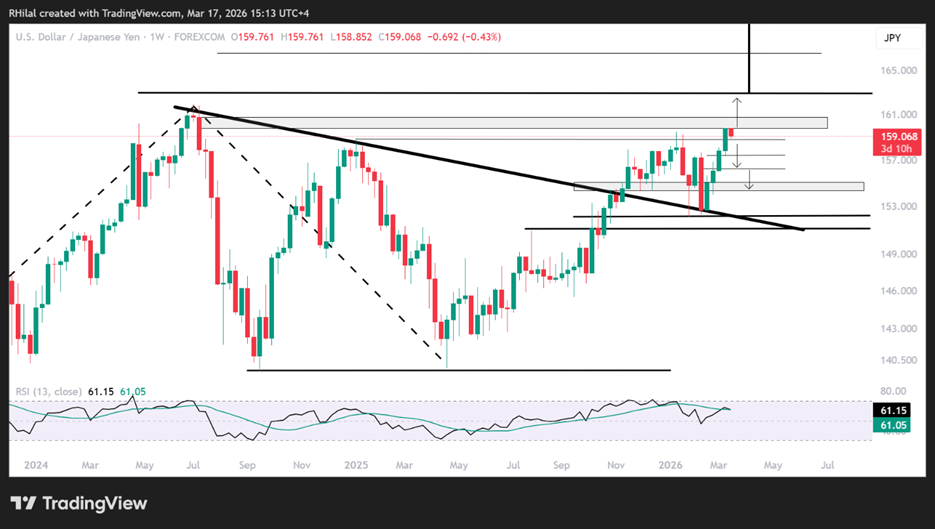
USDJPY Outlook: Weekly Time Frame – Log Scale
Source: Trading view
From a weekly perspective, the USDJPY pair is holding below the 159.80 resistance and 1990 highs, as the DXY remains below 100.50. As demonstrated on the monthly chart, the next resistance aligns with a potential breakout zone toward 160.80 and 163, before extending a steeper move toward the 180 zone, followed by a possible sharp correction.
On the downside, a close below 158.80, 157.40, and 156 exposes 154 and 152 as potential support levels, before extending a steeper bearish forecast for the pair back toward the 147 zone.
Written by Razan Hilal, CMT
Follow on X: @Rh_waves