Both pairs set lows on Tuesday and have been pulling back since. The question now is whether bigger picture bearish trends hold lower-high resistance, or whether bulls can chew through 160.00 in EUR/JPY and encounter 151.95 in USD/JPY.
In last week’s article I had identified a few different spots of resistance potential, with the 160.00 level being the third area of interest. The nearest at the time was a zone running from 158.04-158.24, and that initially held resistance on the trendline bounce before bulls were ultimately able to chew through that area, turning it into support shortly after the weekly open.
That has since led to a rally up to the 160.00 level, which holds resistance, as of this writing, and the same swing high from last week at 160.34 helps to demarcate a resistance zone around the big figure.
From the daily chart above, this would be an ideal spot for lower-high resistance to hold, if bears do still want to retain control of the trend. For support, 159.10 remains of interest which is then followed by the same 158.04-158.24 zone that was in-play to start this week.
For deeper resistance, 160.55, 160.90 and 162.00 all hold some level of appeal should prices breakout above the 160 psychological level.
EUR/JPY Four-Hour Price Chart
Chart prepared by James Stanley, EUR/JPY on Tradingview
USD/JPY
While EUR/JPY is already working on a key resistance level, USD/JPY is a little further away from the spot that I’ve been tracking for a similar purpose. In USD/JPY, it’s the 151.95 level that looms large and this was the same price that set the high in Q4 of 2022 and 2023 before coming in as support in May of this year. That price is also currently confluent with the 200-day moving average, which held the lows in November just before election results came in and then showed as resistance briefly when prices were pushing-lower late last month.
That remains a big spot for USD/JPY and like 160.00 in EUR/JPY above, it would be an ideal spot for bears to defend as lower-high resistance if they did want to retain control of the trend.
At this point the 150.77 level is of note for shorter-term looks. This is the 50% mark of the same Fibonacci retracement that set the highs in mid-November. The 61.8% retracement of that same Fibonacci setup had held support as the descending triangle and the 50% mark at 150.77 caught the lows on the initial break, leading to the bounce up to 151.95 and the 200-day moving average; and then set resistance early last week before bears tried to take out the 150.00 level.
Now it’s higher-low support potential, setting the stage for a possible resistance test of the 151.95 level. If bulls can force a breakout above that, then prior support at the 61.8% level of 153.41 would be of interest and that would be the next ideal spot for sellers to defend if they did have interest in retaining control of intermediate-term price action.
USD/JPY Four-Hour Price Chart
Chart prepared by James Stanley, USD/JPY on Tradingview
Both pairs set lows on Tuesday and have been pulling back since. The question now is whether bigger picture bearish trends hold lower-high resistance, or whether bulls can chew through 160.00 in EUR/JPY and encounter 151.95 in USD/JPY.
In last week’s article I had identified a few different spots of resistance potential, with the 160.00 level being the third area of interest. The nearest at the time was a zone running from 158.04-158.24, and that initially held resistance on the trendline bounce before bulls were ultimately able to chew through that area, turning it into support shortly after the weekly open.
That has since led to a rally up to the 160.00 level, which holds resistance, as of this writing, and the same swing high from last week at 160.34 helps to demarcate a resistance zone around the big figure.
From the daily chart above, this would be an ideal spot for lower-high resistance to hold, if bears do still want to retain control of the trend. For support, 159.10 remains of interest which is then followed by the same 158.04-158.24 zone that was in-play to start this week.
For deeper resistance, 160.55, 160.90 and 162.00 all hold some level of appeal should prices breakout above the 160 psychological level.
EUR/JPY Four-Hour Price Chart
Chart prepared by James Stanley, EUR/JPY on Tradingview
USD/JPY
While EUR/JPY is already working on a key resistance level, USD/JPY is a little further away from the spot that I’ve been tracking for a similar purpose. In USD/JPY, it’s the 151.95 level that looms large and this was the same price that set the high in Q4 of 2022 and 2023 before coming in as support in May of this year. That price is also currently confluent with the 200-day moving average, which held the lows in November just before election results came in and then showed as resistance briefly when prices were pushing-lower late last month.
That remains a big spot for USD/JPY and like 160.00 in EUR/JPY above, it would be an ideal spot for bears to defend as lower-high resistance if they did want to retain control of the trend.
At this point the 150.77 level is of note for shorter-term looks. This is the 50% mark of the same Fibonacci retracement that set the highs in mid-November. The 61.8% retracement of that same Fibonacci setup had held support as the descending triangle and the 50% mark at 150.77 caught the lows on the initial break, leading to the bounce up to 151.95 and the 200-day moving average; and then set resistance early last week before bears tried to take out the 150.00 level.
Now it’s higher-low support potential, setting the stage for a possible resistance test of the 151.95 level. If bulls can force a breakout above that, then prior support at the 61.8% level of 153.41 would be of interest and that would be the next ideal spot for sellers to defend if they did have interest in retaining control of intermediate-term price action.
USD/JPY Four-Hour Price Chart
Chart prepared by James Stanley, USD/JPY on Tradingview



 Chart prepared by James Stanley, EUR/JPY on Tradingview
 Chart prepared by James Stanley, EUR/JPY on Tradingview
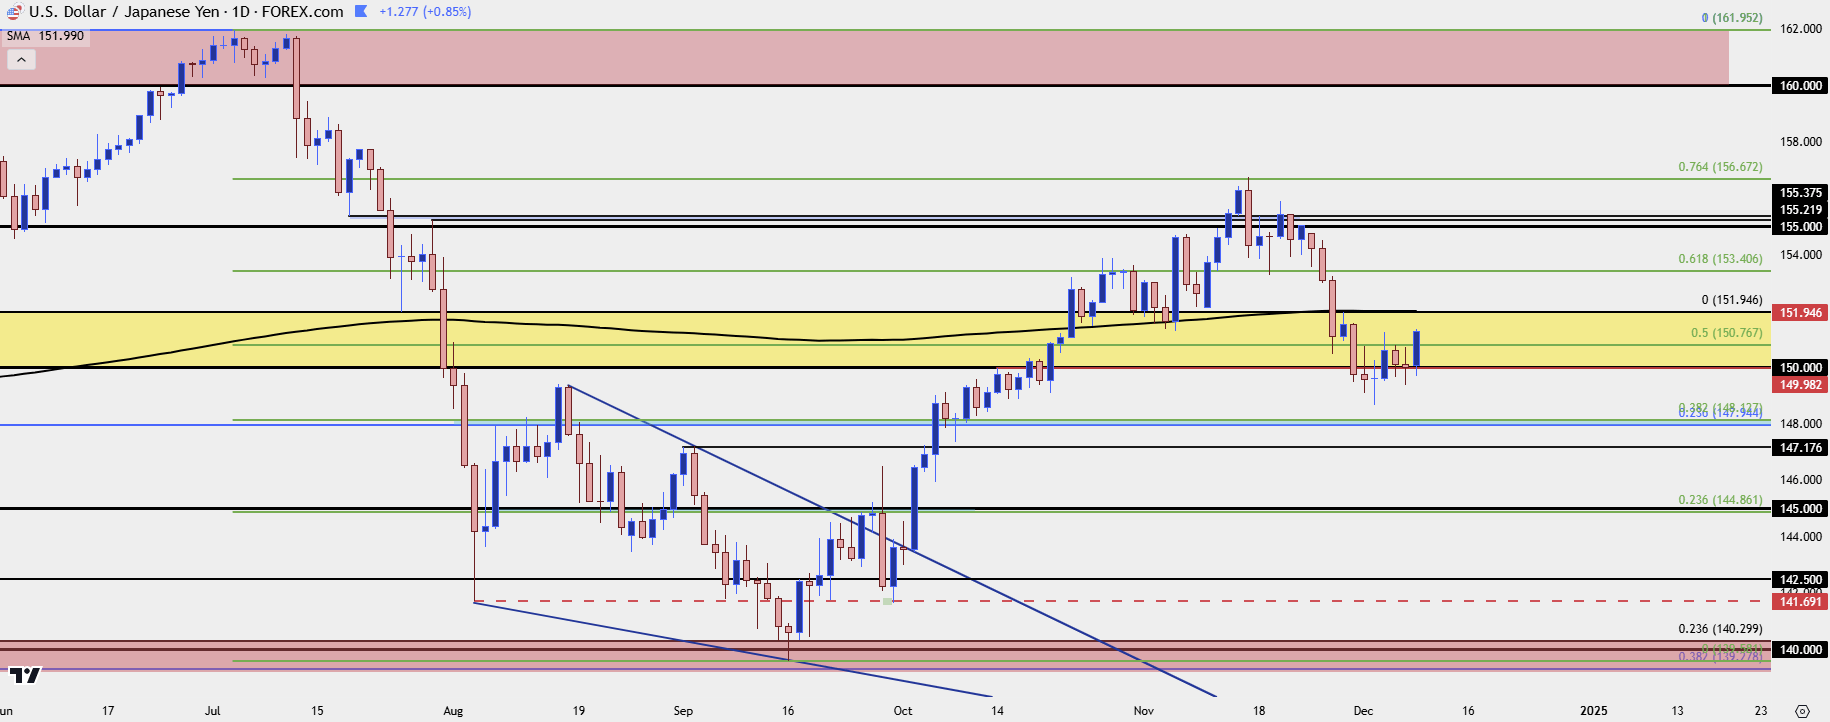 Chart prepared by James Stanley, USD/JPY on Tradingview
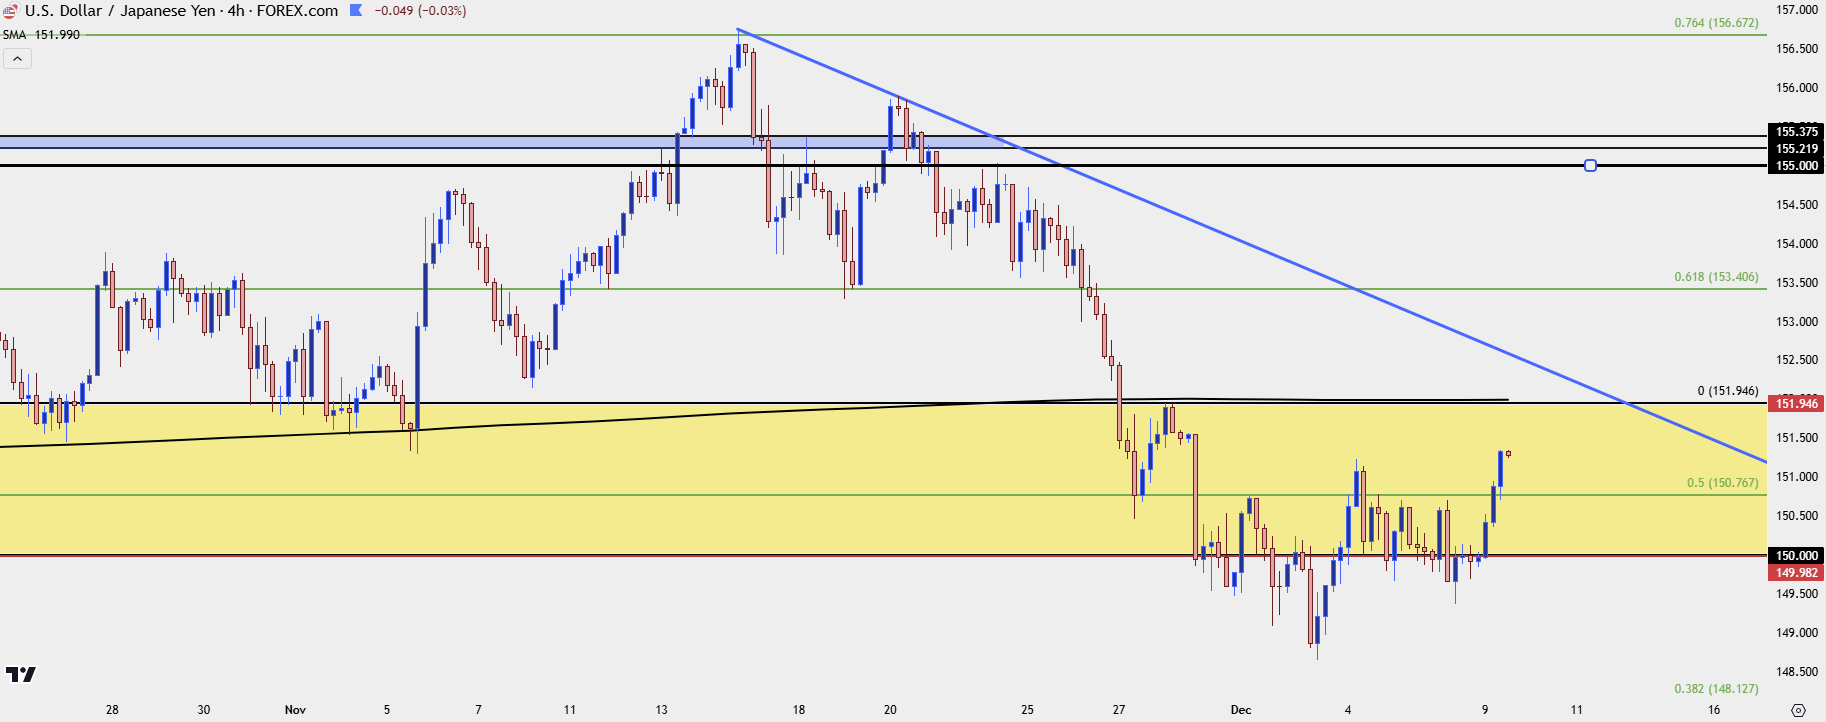 Chart prepared by James Stanley, USD/JPY on Tradingview




