
Key Events
• China’s reported move to diversify away from U.S. Treasuries pulled dollar pairs back toward defining support levels
• The sharp drop in last week’s JOLTS job openings report is limiting risk appetite ahead of the NFP report on Wednesday and the CPI report on Friday
• Fundamental pressures are redirecting the DXY, USDCAD, and USDJPY toward critical support and defining levels
The DXY’s Weekly Wick vs its 18-Year Support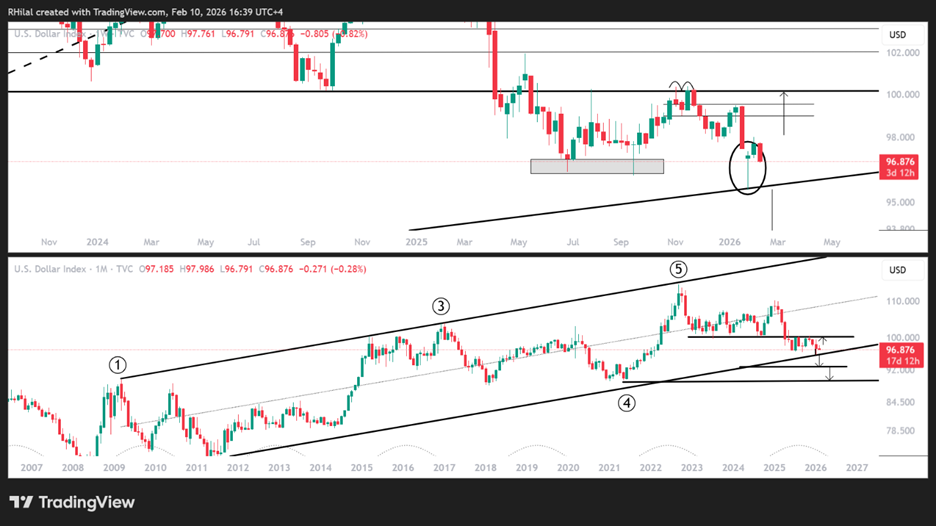
Source: Trading view
The DXY’s weekly wick highlights the inability of bears to sustain losses near the 95–96 zone, a key area expected to define either the continuation of the longstanding bullish trend or a potential bearish structural shift. A bearish weekly session followed that bounce, mirroring price behavior seen on the USDJPY and USDCAD charts. This comes amid growing caution ahead of the upcoming NFP report, following last week’s drop in JOLTS job openings to 6.54M, levels last seen in 2020.

NFP expectations currently stand near 70k job additions, following the delay caused by the U.S. government shutdown. Chinese reports added to this bearish bias, with moves toward diversifying away from U.S. Treasuries and hedging against shifting policy risks, keeping key support zones in focus to confirm either a structural breakdown or another rebound from these levels.
The key level on the DXY remains the 95–96 zone. For USDJPY and USDCAD, the analysis follows below.
Technical Analysis: Quantifying Uncertainty
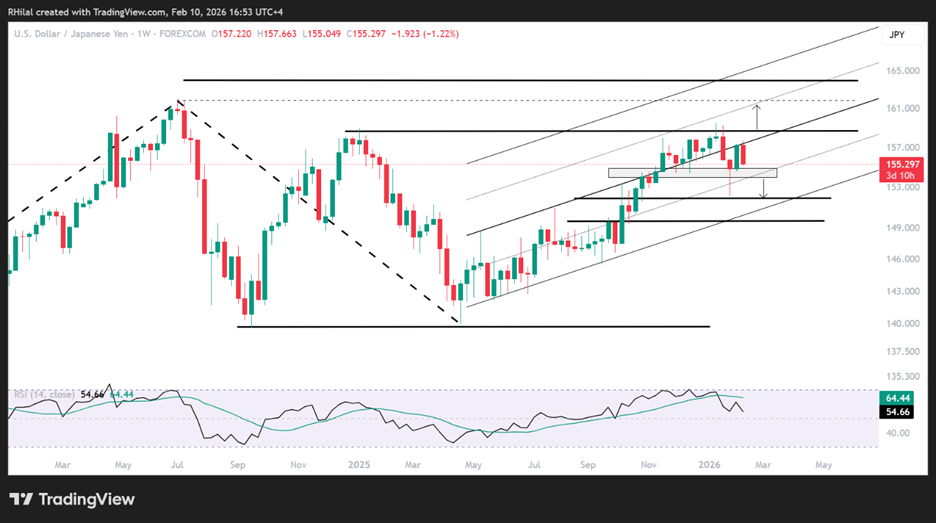
USDJPY Outlook – Weekly Time Frame – Log Scale
Source: Trading view
Looking at the weekly candles between December 2025 and February 2026, a clear support zone emerges between 154.80 and 153.80. The steep wick observed on the DXY chart is also reflected on USDJPY, yet the weekly close managed to hold above this zone, reinforcing its technical importance.
This leaves the scenarios as follows:
A weekly close below the 154.80–153.80 range would extend bearish bias toward the lower bound of the respected channel in place since the April 2025 lows, with key levels in focus between 151.80 and 149.60. These levels would either preserve the broader bullish structure from April or confirm a deeper bearish shift toward the 140s.
On the upside, the upper boundary of the channel near 157.50 needs to be cleared to realign with 158.80 and 161. These levels may once again raise intervention risks or open the path toward an extended rally.
In terms of the USDCAD
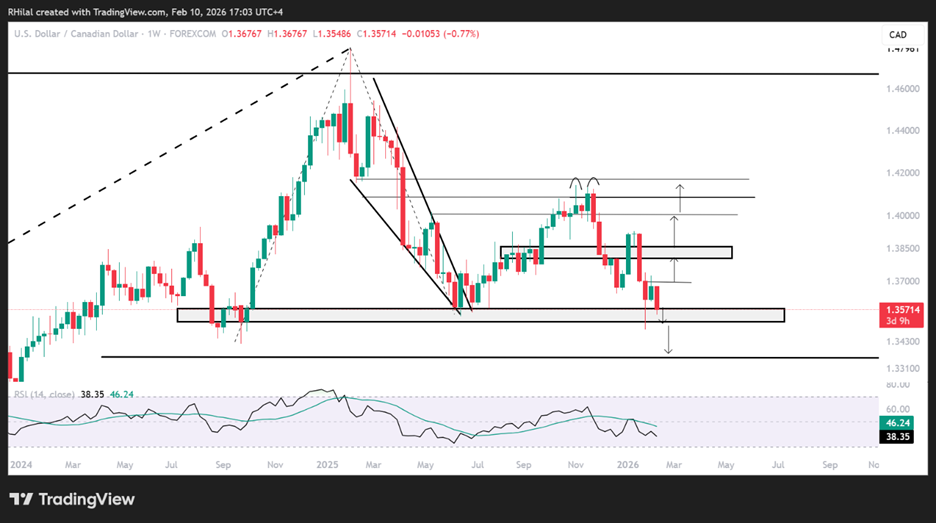
USDCAD Outlook – Weekly Time Frame – Log Scale
Source: Trading view
Price action on the USDCAD chart is once again challenging the support zone that has held since August 2024 near the 1.35 level. A weekly close below 1.35 would expose the pair to a steeper decline toward 1.33 and 1.3150, levels last seen in 2023. Such a move would likely align with a DXY breakdown and renewed strength across major currency pairs toward 2022 extremes.
On the upside, should USDCAD recover above the open of the weekly candle that formed the steep wick into the 1.35 zone, at 1.3640 and 1.37, bullish bias would likely re-emerge. This would reopen the path toward 1.3880 and 1.40, testing the sustainability of a broader bullish continuation scenario.
Written by Razan Hilal, CMT
Follow on X: @Rh_waves