Vodafone, the telecommunications group, reported that 1H adjusted EPS jumped to 0.0411 euro from 0.0085 euro in the prior-year period while adjusted EBITDA fell 1.2% on year to 7.02 billion euros on service revenue of 18.42 billion euros, down 0.7% (-0.8% organic growth). The company expects a full-year adjusted EBITDA of 14.40 - 14.60 billion euros. Meanwhile, the company proposed an unchanged interim dividend of 0.045 euro per share.
From a chartist point of view, the stock price validated a reversal up trend pattern in Double bottom. The upside breakout of a declining trend line in place since November 2019 thanks to a bullish gap is a positive signal (to be confirmed). The daily RSI (14) is bullish and doesn’t show any reversal signal. Readers may want to consider the potential for opening Long positions above the support at 111p with 136p and 142.4p as targets (June 2020 resistance). Alternatively, a break below 111p would call for a test of the horizontal support threshold at 100p.
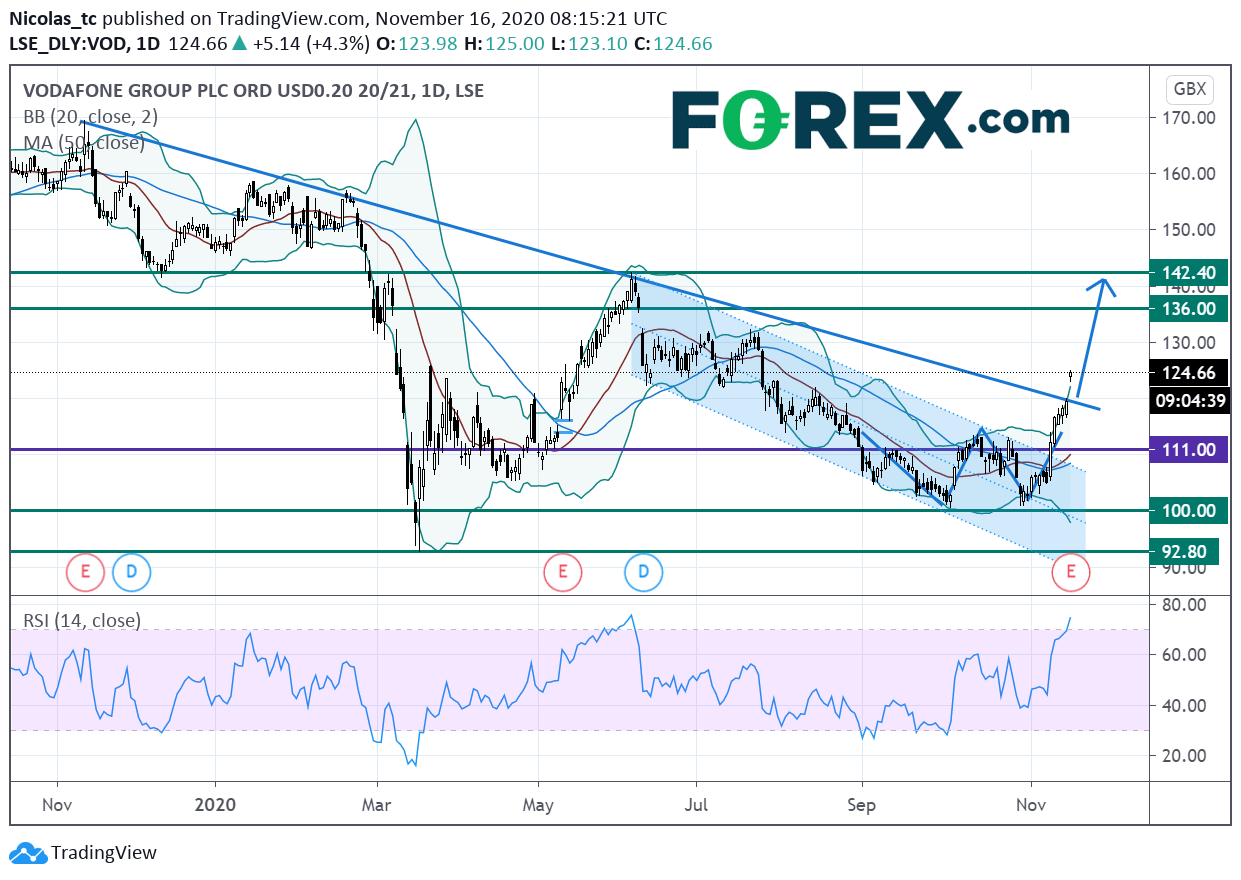
Source: GAIN Capital, TradingView