


As the second week of October comes to a close, a bearish correction phase has started to take shape across major cryptocurrencies. This reflects a decline in short-term confidence. For now, digital assets are pulling back from their recent highs, and as this corrective sentiment continues, selling pressure could become the dominant market force in the coming sessions.

Performance of Major Cryptocurrencies
Source: Data - StoneX, Tradingview
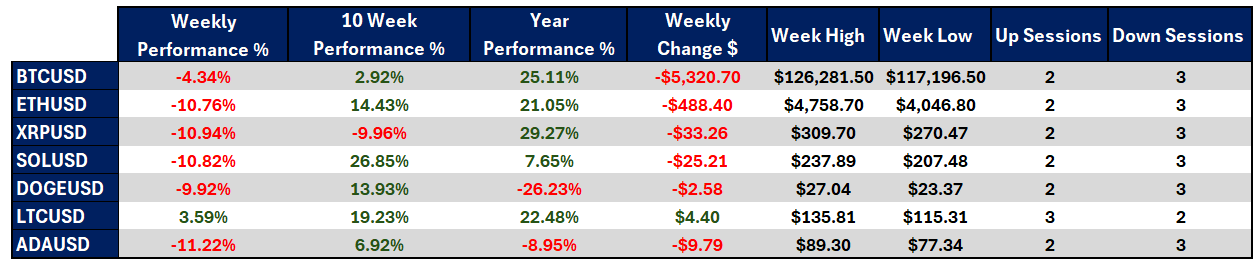
- Litecoin stands out as the only cryptocurrency that managed to close the week with gains, posting a 3.5% increase and maintaining a steady bullish bias.
- Over the past 10 weeks, Solana continues to lead the market with a 26.85% cumulative gain, while Ripple (XRP) remains the worst performer, with a 9.96% decline.
- Year-to-date, Ripple still holds a 29.27% gain despite recent losses, whereas Dogecoin continues to lag behind, showing a 26.23% annual drop.
- Meanwhile, Bitcoin’s new high remains around $126,000, serving as the key resistance level for further bullish movements.
- Overall, most cryptocurrencies have adopted a bearish tone throughout the week, with Litecoin being the only one to record three consecutive bullish sessions. Thus, the market’s prevailing bias remains decidedly bearish.
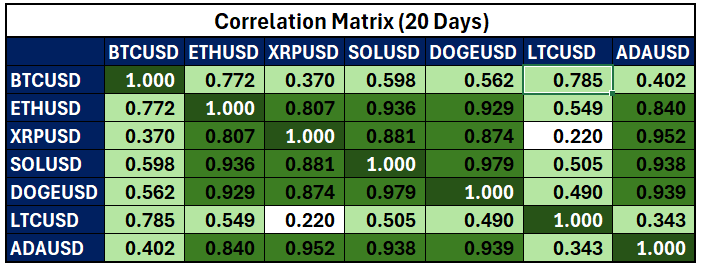
Color scale from red to green – Red indicates negative correlations, while green represents positive correlations.
Source: Data - StoneX, Tradingview
Significant changes in correlations have emerged, particularly with Bitcoin (BTC). Ripple (XRP) and Cardano (ADA) have both begun to lose their positive correlation with BTC, falling to 0.37 and 0.40, respectively, based on the 20-day correlation coefficient. This suggests that while Bitcoin experiences notable corrections, these two assets are entering a phase of relative stability or neutrality, partially decoupling from BTC’s downward movements.
In addition, a low correlation has been recorded between Litecoin and Ripple, with a coefficient of 0.22, indicating divergent price behavior: Litecoin has managed to recover part of its value, while Ripple remains more neutral. This highlights a mixed sentiment of confidence across the crypto market in the short term.
Overall, the market’s dominant bias remains between neutral and bearish, with most cryptocurrencies showing mixed movements that don’t fully mirror BTC’s trend. If selling pressure continues to build, some coins may experience sharper declines, while others may move sideways, explaining the drop in positive correlations observed recently.
It’s important to note that correlation levels may shift as trading sessions progress.
Bitcoin Faces a Sharp Correction
Source: StoneX, Tradingview
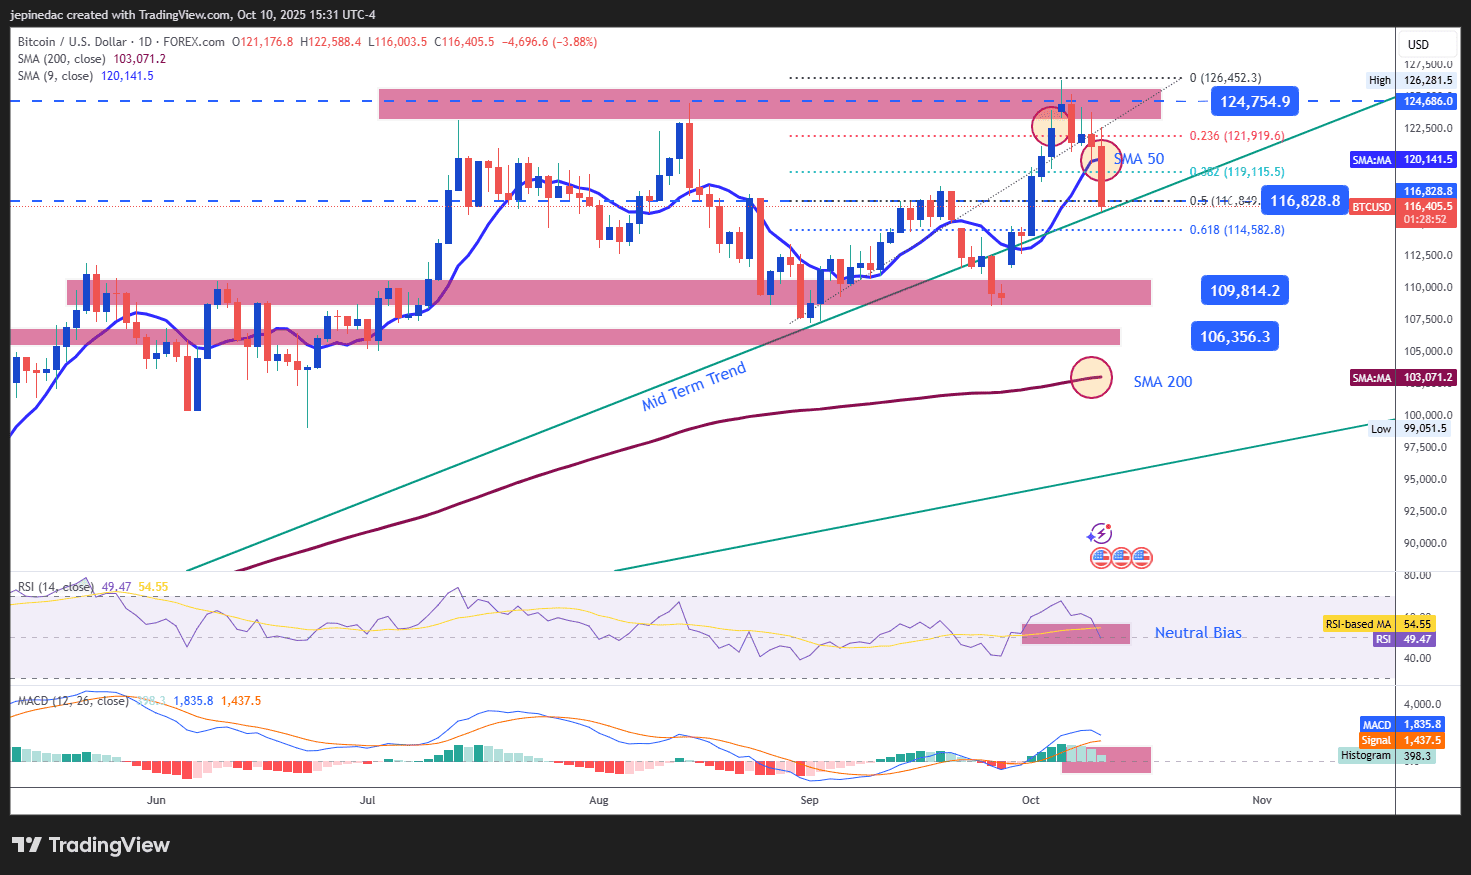
By the end of the week, Bitcoin (BTC) posted a decline of more than 4%, with bearish pressure once again dominating. The price has broken below the $120,000 level, a key psychological support in the short term. If this pressure persists, the previous uptrend could enter a risk phase, paving the way for a lateral consolidation scenario in the near term.
Indicators:
- Both the RSI and MACD indicators show signs of neutrality. The RSI remains near the 50 level, while the MACD histogram is converging toward zero, suggesting a balance of forces in the market and the potential for a range-bound phase in the short term.
Key Levels:
- $125,000 – Major Resistance: The new all-time high area and the most significant barrier for buyers. A sustained breakout above this level could reactivate a medium-term bullish trend.
- $116,800 – Current Support: An intermediate support aligned with the BTC mid-term uptrend line and the 50% Fibonacci retracement of a recent pullback. A break below this level could strengthen the bearish bias.
- $109,800 – Key Support: The lowest level seen in recent weeks. A drop to this area could break the current bullish structure and trigger a new downtrend.
Ethereum Among the Most Devalued Cryptos
Source: StoneX, Tradingview
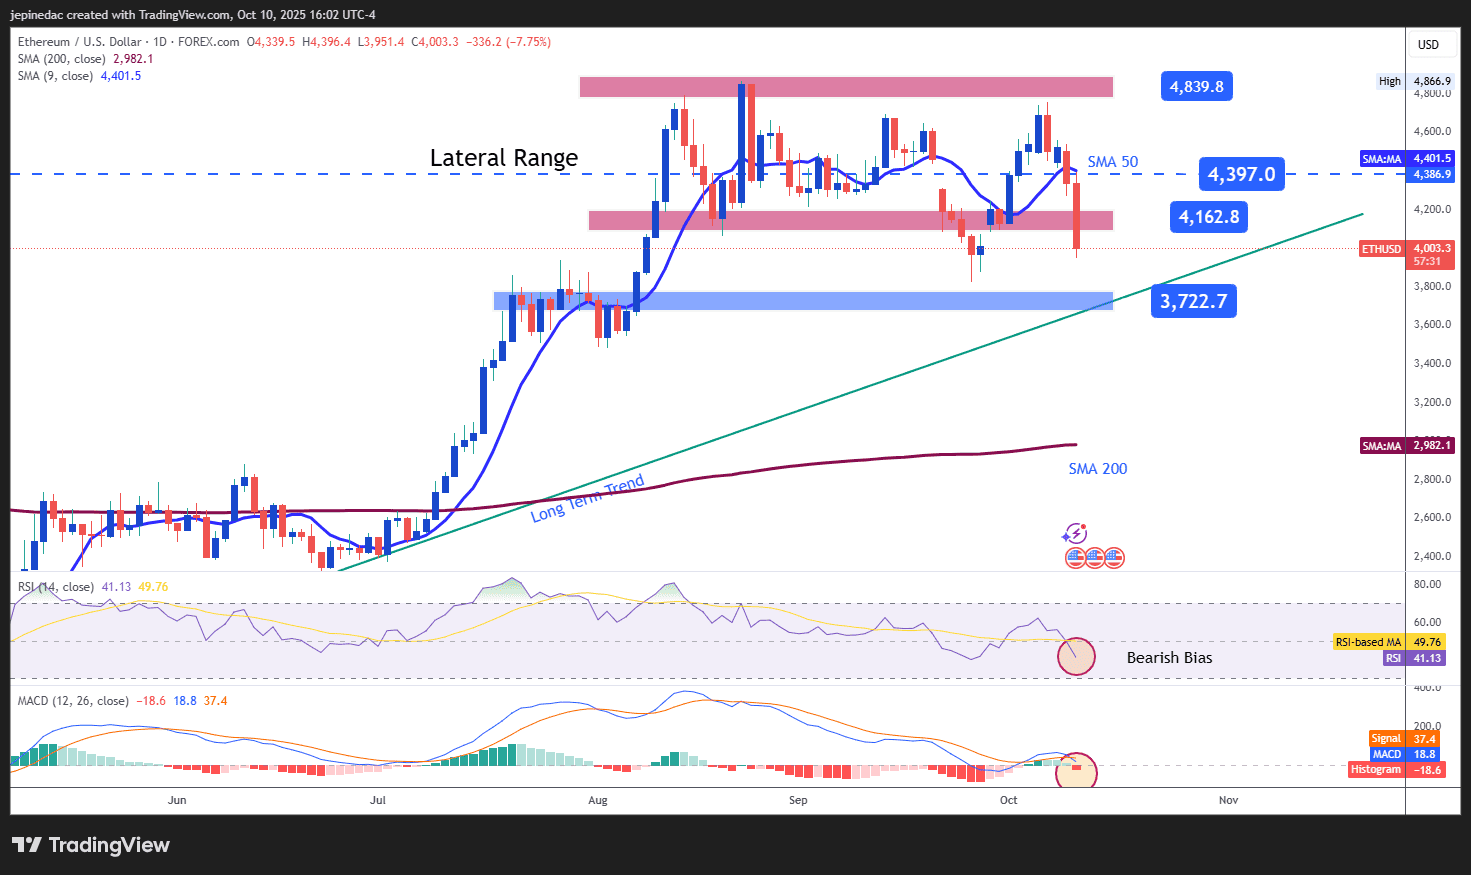
Ethereum (ETH) ends the week with two consecutive bearish sessions, posting a drop of more than 10% in the short term. Selling pressure has been strong enough to break key support levels, putting at risk the uptrend the asset had maintained for several months.
Indicators:
- The MACD histogram is now below zero, while the RSI remains under the 50 level, confirming a loss of buying momentum. If both indicators continue this trajectory, downward pressure could intensify in the coming sessions.
Key Levels:
- $4,397 – Key Resistance: The midpoint of the previous lateral range. A recovery to this level could signal a continuation of the range in the short term.
- $4,162 – Current Barrier: The lower boundary of the prior channel, which could act as temporary support amid potential rebounds.
- $3,722 – Major Support: A zone corresponding to July highs, now serving as a critical support level. A break below it could confirm a trend reversal toward a broader bearish bias.
Written by Julian Pineda, CFA – Market Analyst
Follow him on: @julianpineda25



