
October has come to an end, and with it, the cryptocurrency market has maintained a steady bearish bias in recent trading sessions. This has caused most of the major crypto assets to show indecisive price movements, preventing the formation of clear short-term trends. For now, caution prevails, and as selling pressure continues to strengthen, it is likely that the weakness of the leading cryptocurrencies will continue to dominate in the coming sessions.

Performance of Major Cryptocurrencies
Source: Data - StoneX, Tradingview
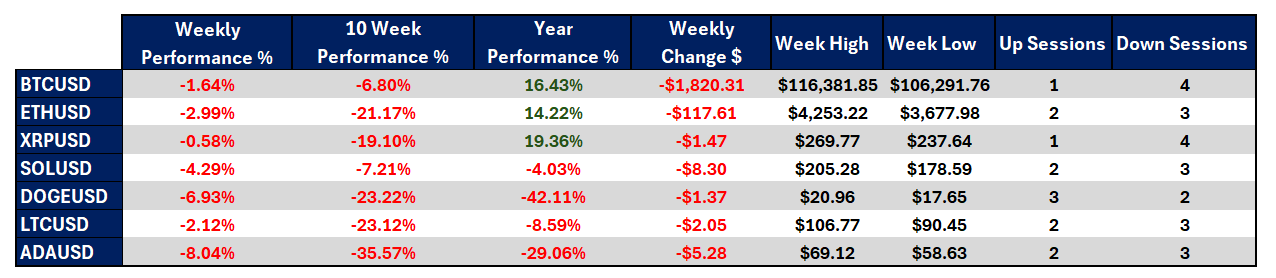
- Cardano (ADA) has been the most depreciated cryptocurrency of the week, posting a decline of -8.04%, making it the hardest hit by the decrease in demand for digital assets. In contrast, Ripple (XRP) has shown greater stability, losing only -0.58% over the same period.
- Over the past 10 weeks, all major cryptocurrencies have maintained a dominant bearish bias, reflecting a consistent pattern of weakness. Cardano remains the most affected, with a -35.57% decline, while Bitcoin (BTC) has been the most resilient, with a -6.8% drop. This indicates that Bitcoin, as the leading asset, has managed to hold a degree of stability, while other cryptocurrencies have faced more significant losses.
- On a year-to-date basis, Ripple stands out as the best-performing cryptocurrency of the year, with a 19.36% gain, while Dogecoin (DOGE) continues to show no signs of recovery, recording a -42.11% loss so far in 2025.
- Meanwhile, Bitcoin has yet to surpass the $120,000 level, remaining in a sideways range between $116,000 and $106,000 in the short term.
- Overall, the market faces persistent downward pressure, with Bitcoin posting four consecutive losing sessions, reinforcing the bearish bias as the dominant market tone.
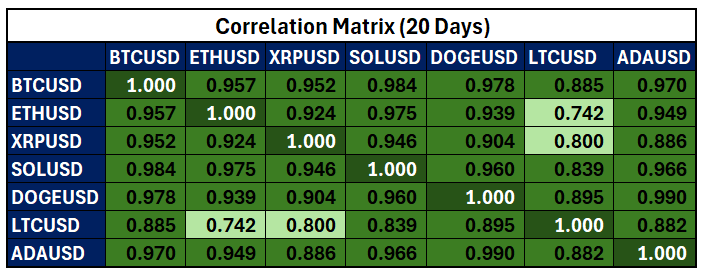
Colors from red to green – Red indicates negative correlations, and green indicates positive correlations.
Source: Data - StoneX, Tradingview
Since the start of this bearish cycle, there has been a significant increase in the positive correlation between major cryptocurrencies and Bitcoin (BTC). Currently, most show a correlation coefficient above 0.9, with the exception of Litecoin (0.88).
This suggests that as Bitcoin undergoes corrections, the rest of the market tends to mirror its behavior, reinforcing a broad-based bearish sentiment and highlighting persistent market uncertainty.
This highly correlated environment indicates that the market has become increasingly synchronized with Bitcoin’s declines, as selling pressure continues to heighten the dependence between major crypto assets. The loss of confidence relative to traditional markets has become evident, and as long as Bitcoin — the market’s benchmark asset — fails to recover its bullish bias, this generalized weakness could remain a dominant factor in the coming sessions.
However, it is important to note that these correlation coefficients may fluctuate over time and could adjust as new information enters the market.
Bitcoin Begins to Show Indecision
Source: StoneX, Tradingview
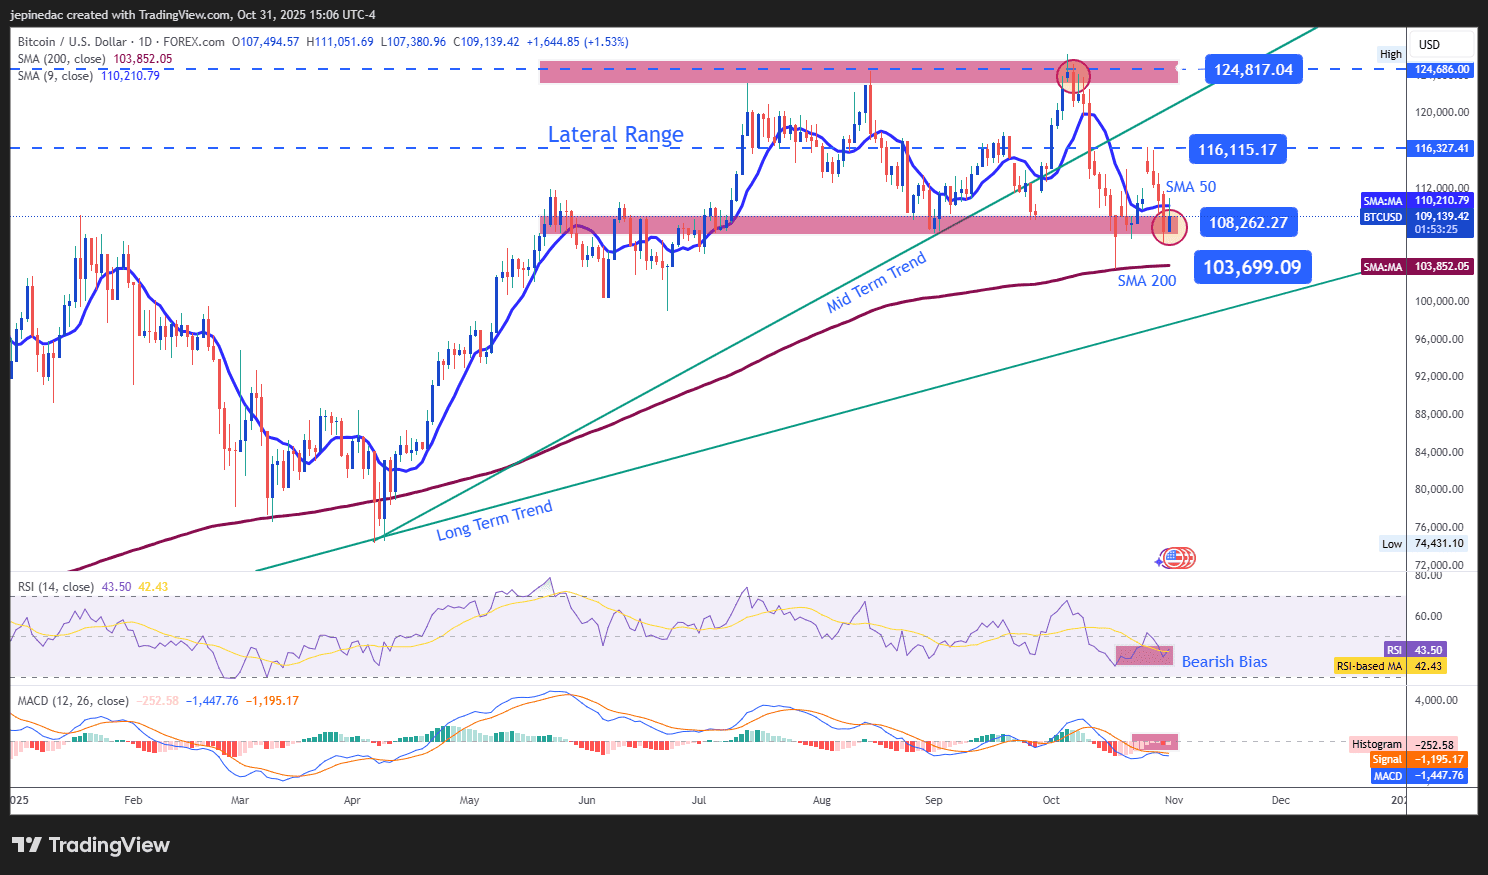
By the end of the week, Bitcoin has posted four consecutive bearish sessions, maintaining a dominant selling bias that has brought the price down to key support levels. Recent moves have reinforced the formation of a sideways channel, with resistance around $124,000 per BTC and support near $108,000. As long as these levels hold, the market is likely to remain range-bound, with consolidation and indecision continuing in the short term.
However, as long as price action stays below the 50-period moving average, the bearish bias may become more entrenched, potentially giving way to a more defined downtrend that could threaten the current lateral structure.
Indicators:
- Both the RSI and MACD remain below their neutral levels (50 and 0, respectively), indicating that selling strength continues to dominate the short-term market. So far, the RSI has not shown any signs of oversold conditions that could anticipate a significant reversal, meaning downward pressure remains prevalent.
Key Levels:
- $116,100 – Major Resistance: This level corresponds to the midpoint of the lateral channel, acting as the primary bullish barrier. A sustained move back to this level could reinforce the sideways structure, maintaining market indecision and the lack of a clear trend in Bitcoin’s price action.
- $108,200 – Current Barrier: Located at the lower boundary of the channel, this zone could act as support against the prevailing selling pressure. From here, minor bullish corrections may occur if the price continues to trade within the established range.
- $103,700 – Key Support: A level not seen since June of this year, aligned with the 200-period simple moving average. A break below this level would confirm a structural bearish shift, signaling the start of a new and more sustained downtrend.
Cardano: The Week’s Worst Performer
Source: StoneX, Tradingview
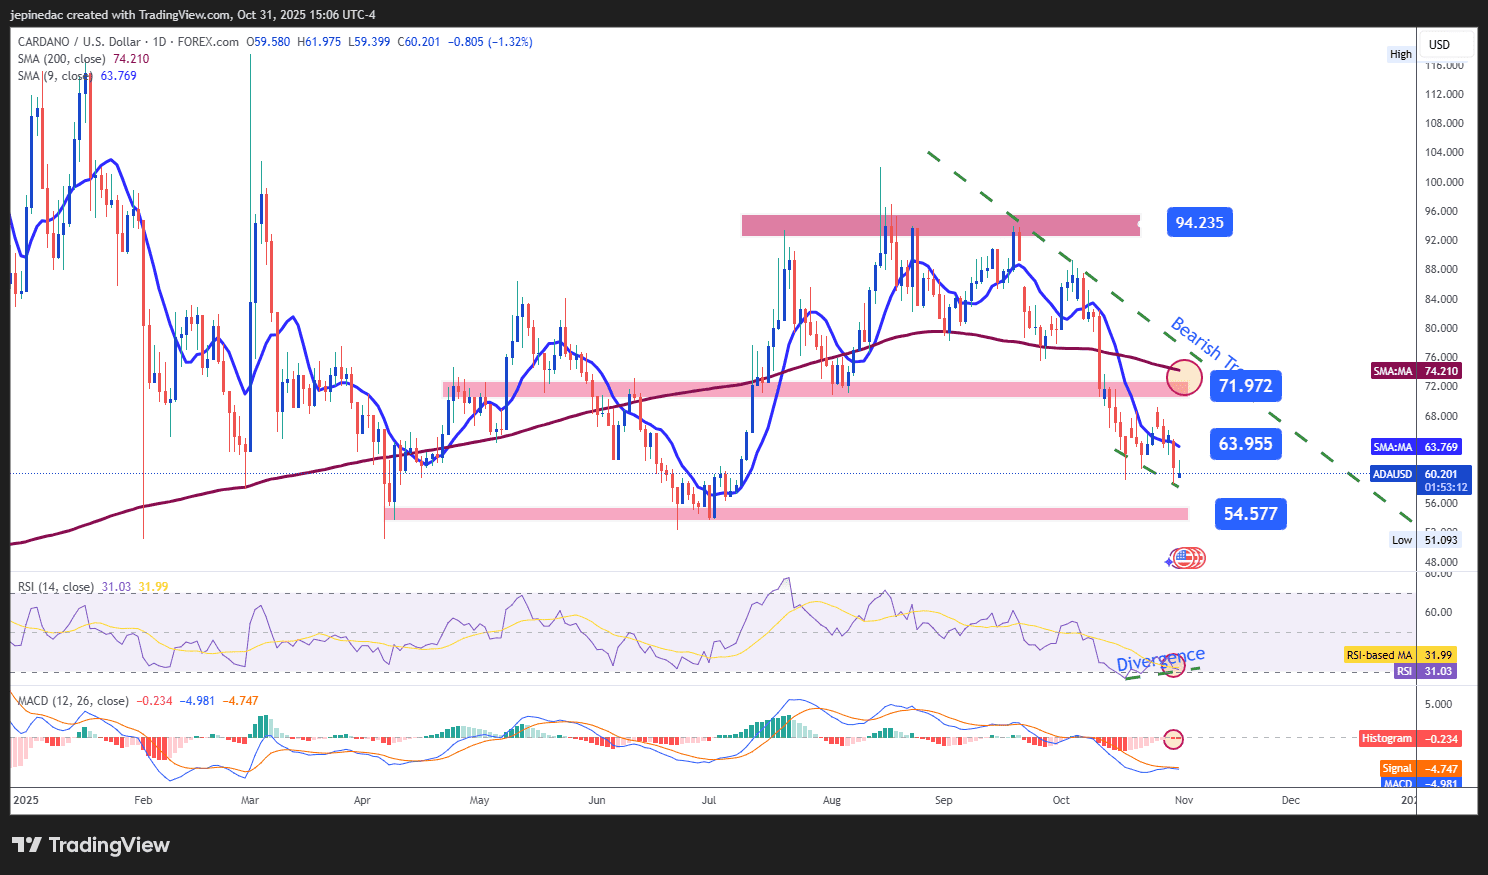
Cardano (ADA) closed the week with three consecutive bearish sessions, accumulating a decline of more than 8%. Selling pressure has pushed the price back toward the $54.57 level, not seen since July of this year, reinforcing a downward trendline that remains in place. In the absence of significant bullish movements, this bearish trend stands as the most relevant technical formation to watch in the coming sessions.
Indicators:
- Both the MACD and RSI remain below their neutral zones (0 and 50, respectively), confirming bearish momentum and selling dominance in the short term. However, the formation of lower lows in price alongside higher lows in the RSI suggests a bullish divergence, indicating a potential imbalance in market forces following the recent sharp declines. This could open the door to short-term technical rebounds in the days ahead.
Key Levels:
- 71.97 – Major Resistance: This zone aligns with the 200-period simple moving average. If the price stabilizes above this level, it could challenge the current downtrend and mark the beginning of a new bullish bias.
- 63.95 – Current Barrier: This level coincides with the 50-period moving average and could act as intermediate resistance during potential corrective upward movements.
- 54.57 – Key Support: This area, representing lows not seen since July, is considered the most important bearish barrier. A break below it could reinforce the downward trend in the short term.
Written by Julian Pineda, CFA – Market Analyst
Follow him on: @julianpineda25