


AUD/JPY outlook: Bullish signals clash with rising bond risks
AUD/JPY is back in its classic role as a risk barometer, riding low volatility and widening yield spreads to YTD highs. But can the breakout stick with bond markets flashing warning signs?
Share this:

- AUD/JPY correlations with equities and volatility near historical highs
- Yield differential between Australia and Japan driving upside momentum
- RSI and MACD still bullish, but upside strength has stalled
Summary
AUD/JPY has reclaimed its role as a risk proxy, surging on low volatility and widening yield spreads to levels last seen in mid-2024. Correlations with equities and volatility indices confirm the pair’s sensitivity to risk appetite, but rising global bond yields cast a shadow over the bullish narrative. Technicals lean bullish, yet the macro backdrop warns that the party could end abruptly.
Risk Proxy Returns
AUD/JPY has reverted to its traditional role in the FX universe as a barometer of broader risk appetite, using a combination of low volatility in stocks and bonds, gains in riskier asset classes, and widening interest rate differentials to climb to levels not seen since July last year.
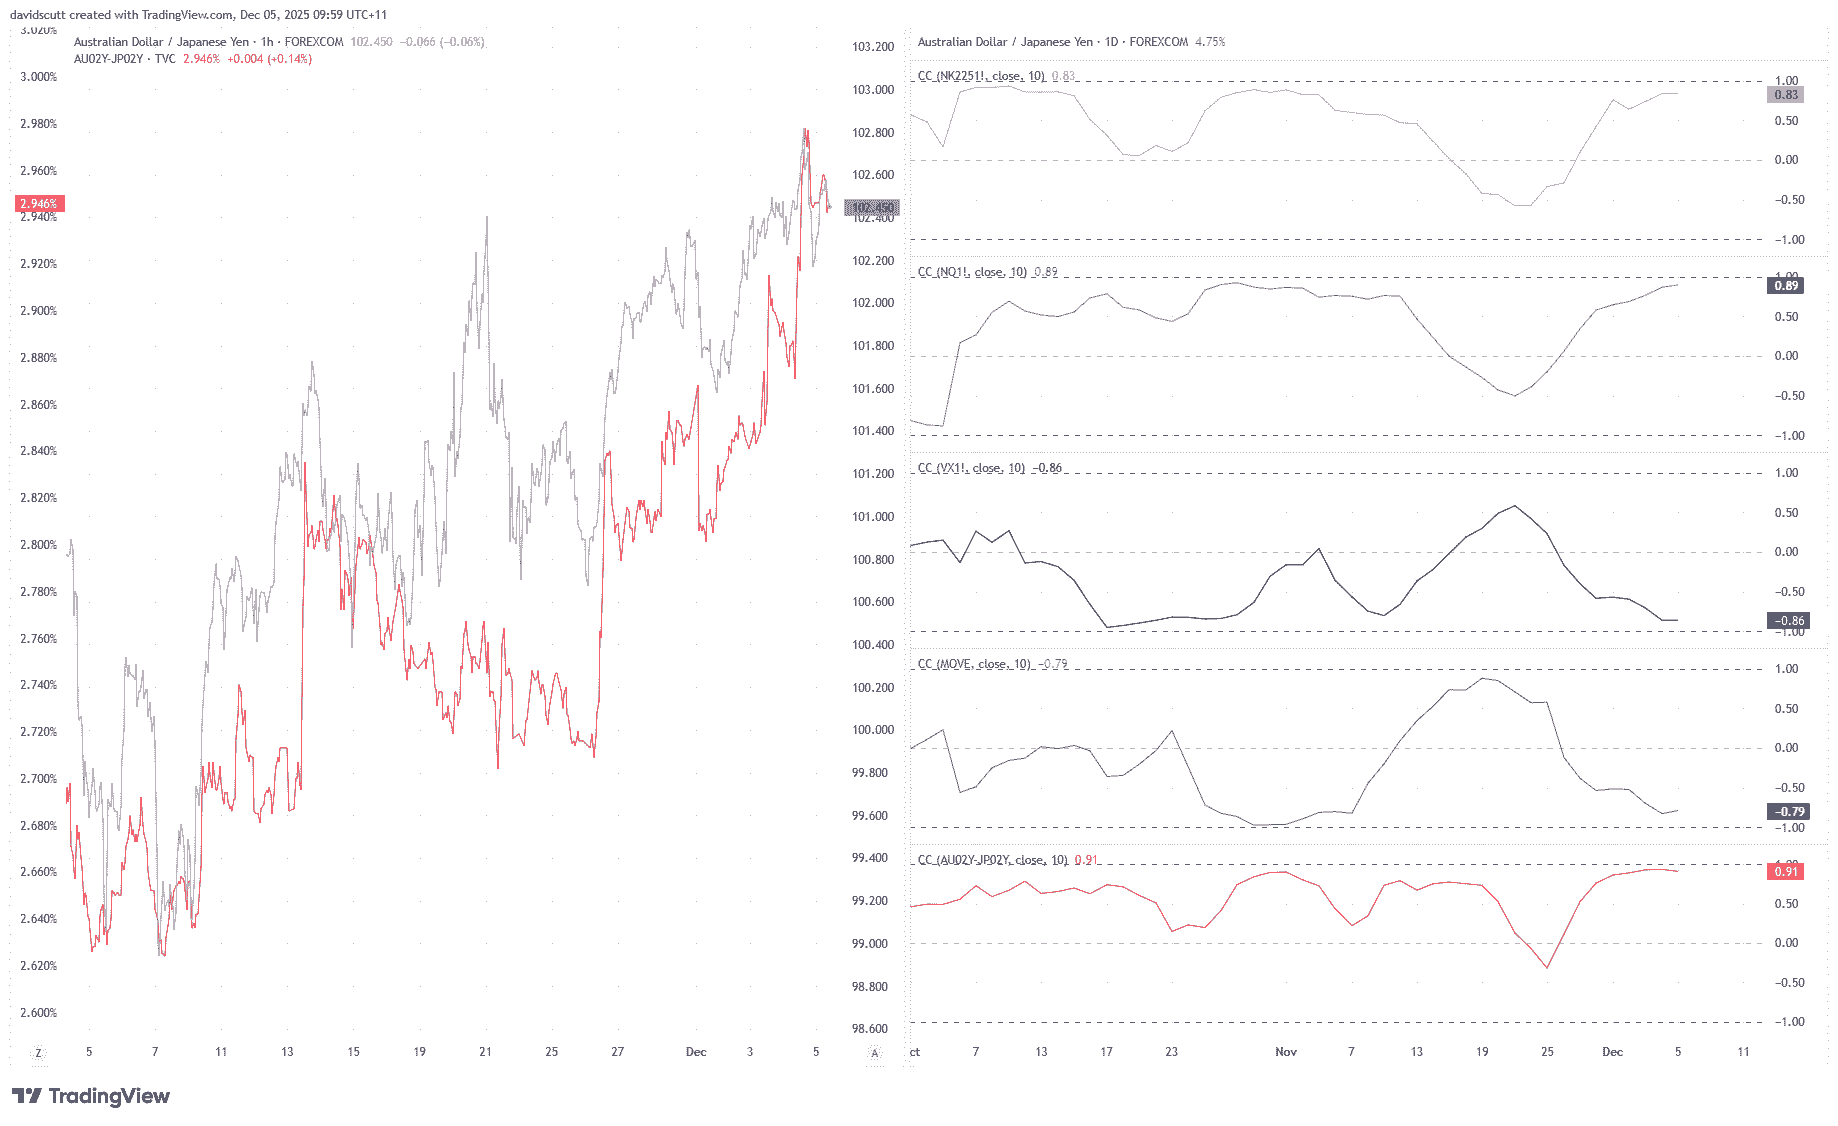
We can see this in the rolling 10-day correlation coefficients between AUD/JPY and various market indicators in the chart below. From top to bottom, the scores are 0.83 with Nikkei 225 futures, 0.89 with Nasdaq 100 futures, -0.86 and -0.79 respectively with VIX futures and the MOVE index, along with 0.91 with two-year yield differentials between Australia and Japan.
Source: TradingView
The latter is shown visually in the left-hand pane overlaid against AUD/JPY, demonstrating not only the correlation between the two but also that the recent hawkish recalibration in the Australian interest rate curve has far exceeded that in Japan, despite traders now firmly favouring a rate hike from the BOJ in late December.
As a reminder, correlation coefficients measure how closely two variables move together. A reading of +1 means they rise and fall in perfect sync, while -1 means they move in opposite directions every time. A score of 0 signals no relationship at all.
While correlation does not imply causation, when it comes to these particular markets, the tight relationships confirm AUD/JPY is essentially acting as a risk proxy. Should that remain the case, a continuation of the low-volatility melt-up in riskier asset classes points to the likelihood of an extension of the bullish move, while a deterioration in risk appetite risks derailing the strong uptrend.


AUD/JPY Delivers Unconvincing Breakout
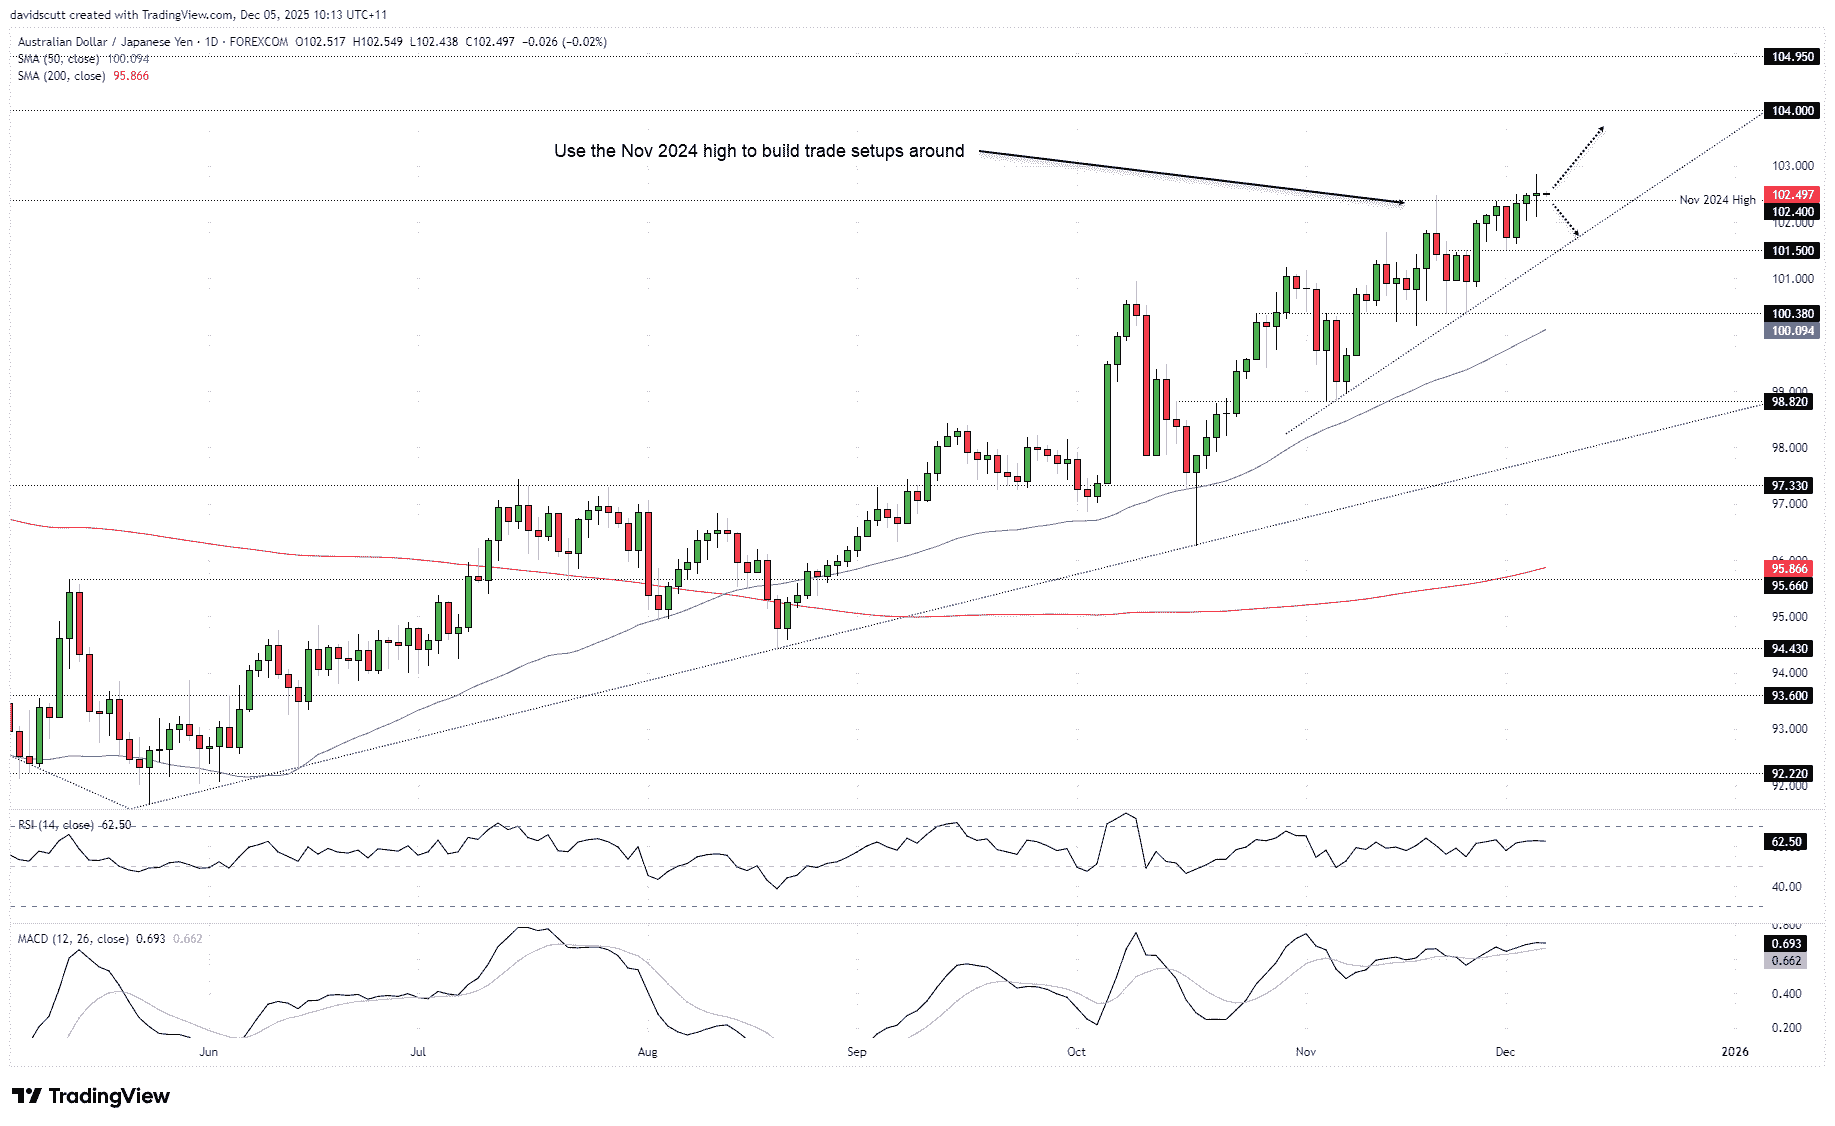
Looking at AUD/JPY on the daily chart, while the pair hit fresh YTD highs earlier this week, the breakout has been anything but spectacular, with an initial probe higher failing to extend and delivering a doji candle pointing to broader indecision. That’s not overly surprising considering we’re seeing longer-dated bond yields around the developed world pushing higher, creating an uncomfortable macro backdrop for riskier assets given elevated valuations following recent sharp gains. You get the sense that everything is fine until it isn’t, but trying to predict the exact timing of when and if the bond vigilantes decide to crash the risk party is very difficult. The threat is already here.
Source: TradingView
Considering where AUD/JPY trades and the uncertain macro backdrop, the November 2024 high of 102.40 can be used to build trade setups around. Should the breakout stick with the price holding above the level, longs could be established above it with a stop beneath for protection, targeting either 104.00 or 104.95. Alternatively, if we see a false break with a reversal back beneath 102.40, the setup could be flipped with shorts established below the level with a stop above. 101.50, the November uptrend, 100.38 or the 50DMA screen as potential targets, depending on desired risk-reward.
While RSI (14) and MACD continue to offer bullish signals, favouring a similar bias when it comes to directional setups, upside strength has remained relatively stable for the better part of a month, likely explaining the grinding price action we’ve seen in the pair. Long setups are still favoured over shorts, but the message is not a definitively bullish one for traders.


Open an account in minutes
Experience award-winning platforms with fast and secure execution, and enjoy tight spreads from 0.5 pts on FX and 0.3 pts on indices.
Economic calendar
Web Trader platform
Our sophisticated web-based platform is packed with features.
Related articles
NZD/USD pressure mounts as payrolls looms large
NZD/USD has fallen sharply as Fed rate expectations reset higher, but extreme downside stretch and major support raise the risk of a violent counter-trend rebound.

US Core PCE Preview: Stale or Significant for the Fed
Core PCE inflation takes center stage Wednesday, with traders watching for signs of renewed price pressure and clues on whether the Fed could hike again in October.


Australian Dollar Forecast: AUD/USD Four-Week Slide Nears Critical Uptrend Support 9 29 2026
Aussie momentum has deteriorated sharply into quarter-end, with inflation, Core PCE and NFP on tap as AUD/USD closes in on a pivotal technical threshold.

This report is intended for general circulation only. It should not be construed as a recommendation, or an offer (or solicitation of an offer) to buy or sell any financial products. The information provided does not take into account your specific investment objectives, financial situation or particular needs. Before you act on any recommendation that may be contained in this report, independent advice ought to be sought from a financial adviser regarding the suitability of the investment product, taking into account your specific investment objectives, financial situation or particular needs.
StoneX Financial Pte. Ltd., may distribute reports produced by its respective foreign entities or affiliates within the StoneX group of companies or third parties pursuant to an arrangement under Regulation 32C of the Financial Advisers Regulations. Where the report is distributed to a person in Singapore who is not an accredited investor, expert investor or an institutional investor (as defined in the Securities Futures Act), StoneX Financial Pte. Ltd. accepts legal responsibility to such persons for the contents of the report only to the extent required by law. Singapore recipients should contact StoneX Financial Pte. Ltd. at 6826 9988 for matters arising from, or in connection with the report.
In the case of all other recipients of this report, to the extent permitted by applicable laws and regulations neither StoneX Financial Pte. Ltd. nor its associated companies will be responsible or liable for any loss or damage incurred arising out of, or in connection with, any use of the information contained in this report and all such liability is hereby expressly disclaimed. No representation or warranty is made, express or implied, that the content of this report is complete or accurate.
StoneX Financial Pte. Ltd. is not under any obligation to update this report.
Trading CFDs carries a high level of risk that may not be suitable for some investors. Consider your investment objectives, level of experience, financial resources, risk appetite and other relevant circumstances carefully. The possibility exists that you could lose some or all of your investments, including your initial deposits. If in doubt, please seek independent expert advice. Visit www.forex.com/en-sg/terms-and-policies for the complete Risk Disclosure Statement.