



AUD/USD, NZD/USD lag no longer as global cycle reasserts itself
Cyclical assets are moving in unison again, and the Aussie and Kiwi are starting to respond. With metals, small caps and rate differentials all lining up, the recent acceleration looks less like noise and more like catch-up.
Share this:

- Cyclical assets turning bullish
- Rates differentials turning supportive
- AUD and NZD playing catch-up
- Technicals favour buying dips
Summary
AUD and NZD are finally playing catch-up as the global cycle shows through metals, small caps, and rates. The recent break higher isn’t just noise with correlations tightening and momentum building. Buying dips is preferred, and with both breaking key levels, the bullish run could extend further, especially against the crosses.
Cycle Currencies Stir
It should really be no surprise that cyclical, commodity-linked currencies like the Aussie and Kiwi are beginning to stir given the broader macroeconomic backdrop, once you dial down the intraday volatility sparked by Donald Trump’s Truth Social feed. We’re coming off a significant monetary policy easing cycle from G10 FX central banks, with the Federal Reserve still going. And fiscal policy remains stimulatory in major economic powerhouses such as the United States, European Union and China.
Metals and Rates Confirm
Curves are steepening as you’d expect during an economic upswing. Commodity prices are flying, with the surge in precious metals being joined by the industrial metals complex. Throw in crude oil prices plumbing multi-year lows, lowering energy costs for households and businesses, and it’s little wonder cyclical currencies tied to the performance of the global economy are firing.
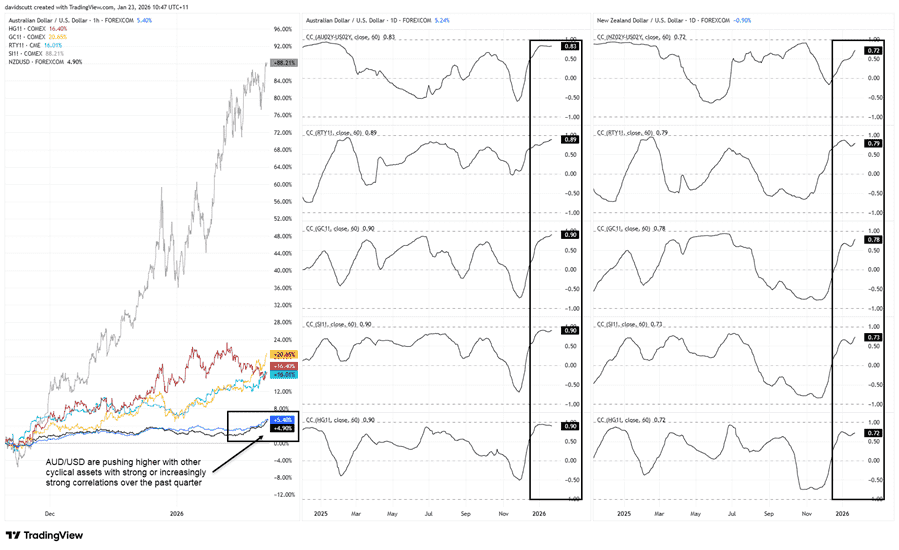
Unsurprisingly, whether you’re talking precious metals such as gold, industrial metals like silver and copper, or cyclical stock indices like the Russell 2000, AUD/USD and NZD/USD have seen strong correlations with each over the past quarter.
Source: TradingView
It’s also notable how strong the relationship has been with relative short-dated interest rate differentials with the United States over the same period. Traders see the RBA and RBNZ hiking rates within months, just as the Fed is expected to ease again. Combined with global factors, the effect has been powerful, explaining why the AUD and NZD are suddenly outperforming. Given the scale of the moves seen in other cyclical assets, it suggests there’s a degree of catch-up going on, given the acceleration of the move recently.
While persistent economic outperformance from the U.S. economy may limit the overall scale of the current bullish trend, especially with headwinds associated with Federal Reserve independence and geopolitical concerns looking like they may have peaked, against low beta FX names not as sensitive to the economic cycle, there are grounds to think the move may only be getting started.
AUD/USD Nears Oct 2024 Peak
Source: TradingView
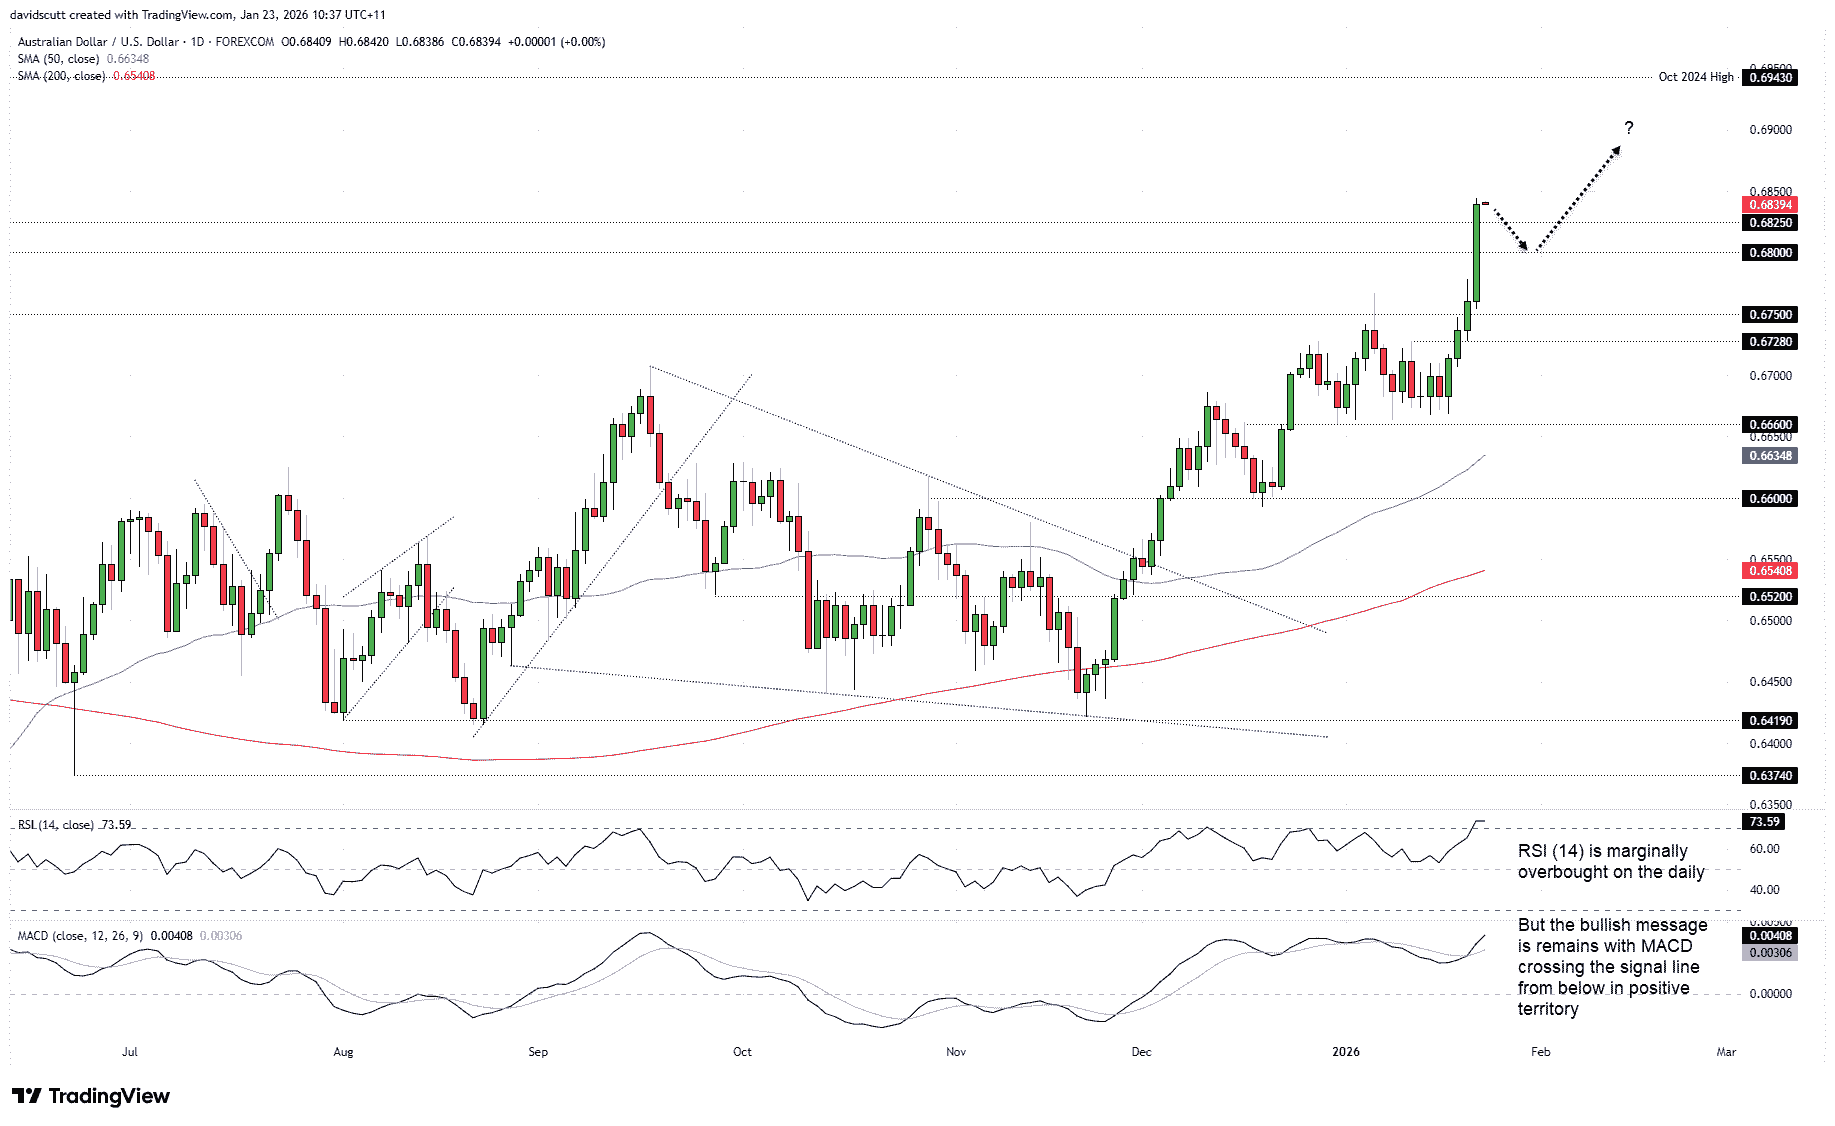
The release of strong labour market data for December helped drive a mammoth surge in AUD/USD on Thursday, combining with a softer U.S. dollar to break through several resistance levels, leaving it sitting at highs not seen since October 2024.
Following such a pronounced bullish move, it may now be due a period of consolidation, akin to what was seen around the turn of the year following the initial breakout higher. While the message from RSI (14) and MACD is entirely bullish, indicating building upside strength, the former has now ticked over into overbought territory, warning the move is looking a little stretched.
.6825 is a minor level on the downside to watch for anyone trading the pair, with .6800 a more important level considering it acted as both support and resistance for lengthy periods back in 2024. Given the overall signal from the oscillators and moving averages favours a bullish bias, they may make for decent entry levels for longs depending on price action at the time.
Above where AUD/USD now trades, the October 2024 high of .6943 will be on the radar for bulls, with .6900 the only other level of note given the pair did a bit of work either side of it during the second half of 2024.
NZD/USD Breaks 200DMA
Source: TradingView
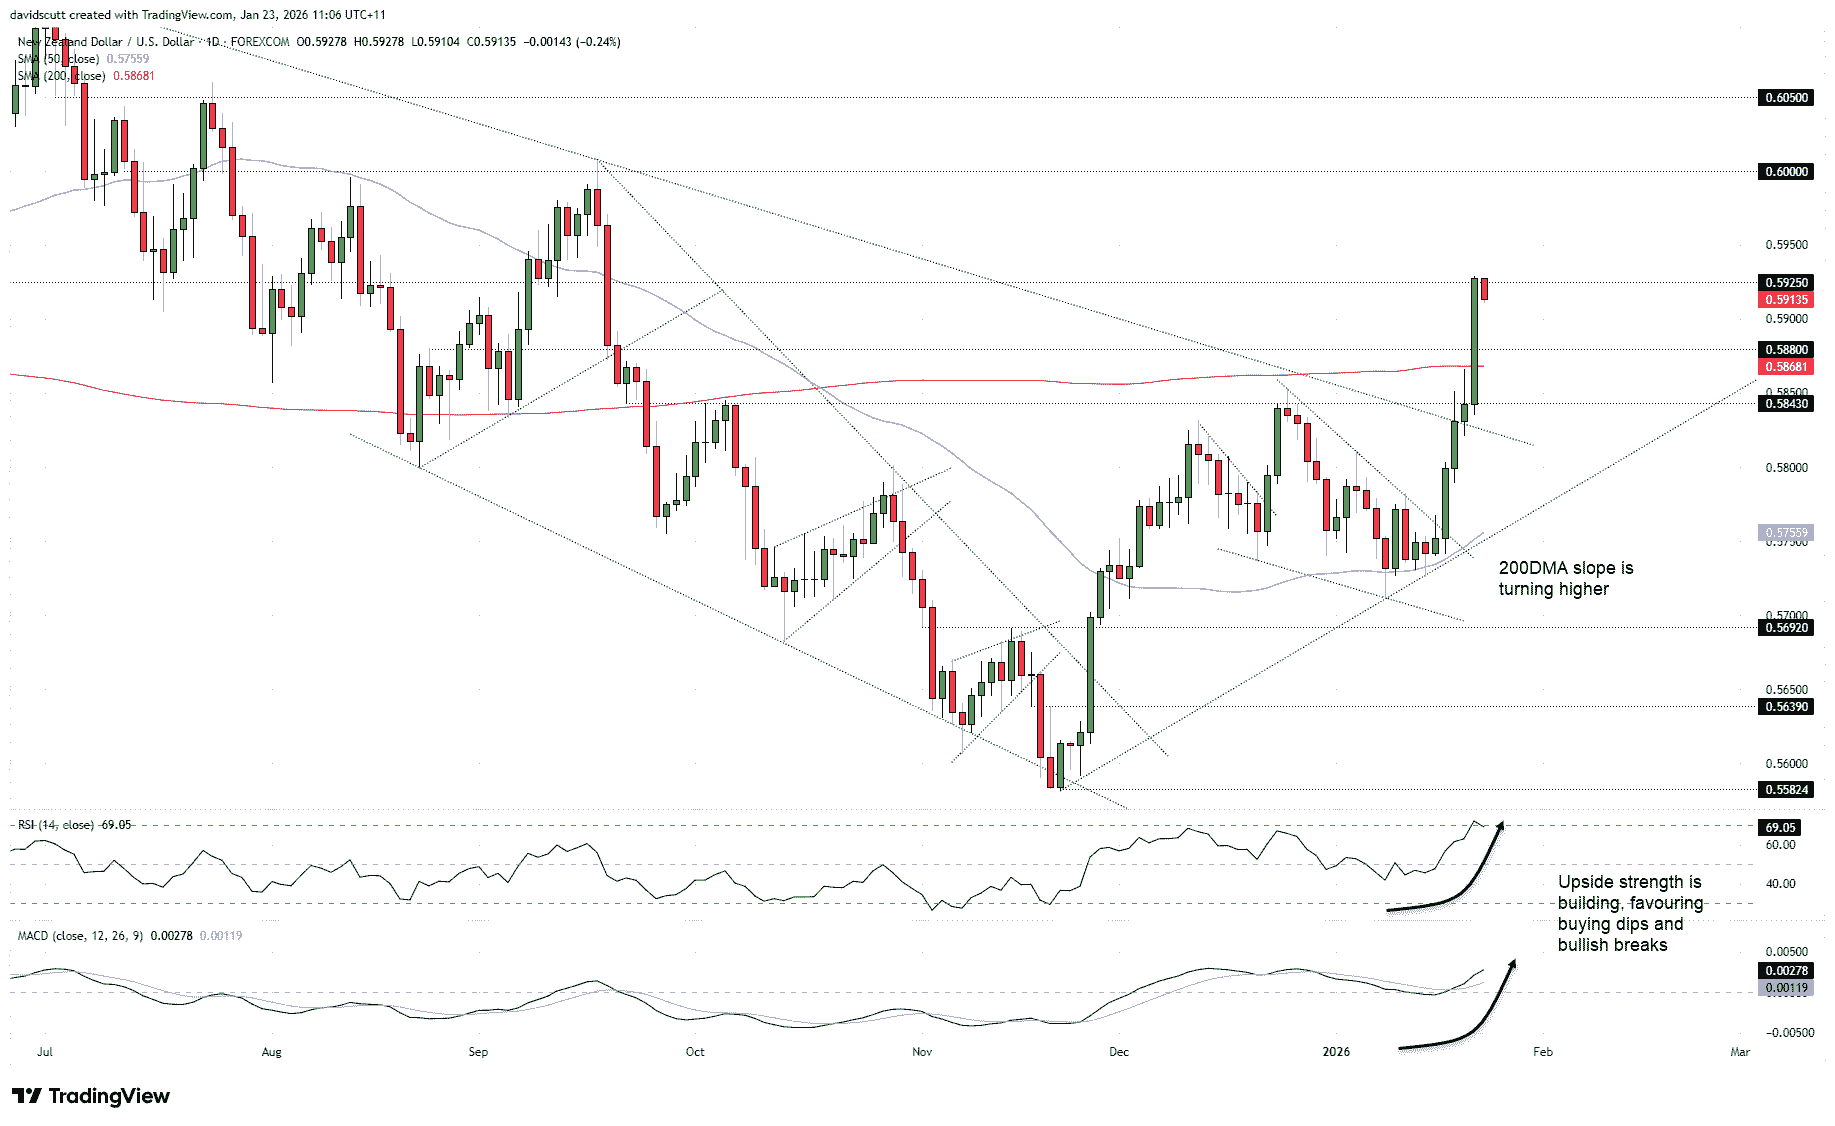
Just like the Aussie, NZD/USD rocketed higher on Thursday, actually outperforming its Antipodean neighbour in percentage terms thanks to a strong Q4 inflation print both in headline and underlying terms. The move eventually stalled at .5925, a level the pair did plenty of work around for lengthy periods last year. It was often tested but rarely crossed sustainably, making it the first topside level for traders to focus on. Should the bullish move extend further, .6000 and .6050 screen as potential target levels.
Should we see a pullback following the latest run higher, .5880 is a minor level ahead of the more important 200-day moving average. Price action around that level will be important when assessing medium-term directional risks if the pair returns there. Given it capped bullish advances prior to the latest breakout, .5843 is another level of focus on the downside.
RSI (14) continues to trend higher and MACD has delivered a bullish crossover, confirming upside momentum is strengthening. With the 50-day moving average flicking higher and the 200-day showing signs of doing similar, the overall message favours buying dips and bullish breakouts.
Related tags:
Latest market news



Open an account in minutes
Experience award-winning platforms with fast and secure execution, and enjoy tight spreads from 0.5 pts on FX and 0.3 pts on indices.
Economic calendar
Web Trader platform
Our sophisticated web-based platform is packed with features.
Related articles
This report is intended for general circulation only. It should not be construed as a recommendation, or an offer (or solicitation of an offer) to buy or sell any financial products. The information provided does not take into account your specific investment objectives, financial situation or particular needs. Before you act on any recommendation that may be contained in this report, independent advice ought to be sought from a financial adviser regarding the suitability of the investment product, taking into account your specific investment objectives, financial situation or particular needs.
StoneX Financial Pte. Ltd., may distribute reports produced by its respective foreign entities or affiliates within the StoneX group of companies or third parties pursuant to an arrangement under Regulation 32C of the Financial Advisers Regulations. Where the report is distributed to a person in Singapore who is not an accredited investor, expert investor or an institutional investor (as defined in the Securities Futures Act), StoneX Financial Pte. Ltd. accepts legal responsibility to such persons for the contents of the report only to the extent required by law. Singapore recipients should contact StoneX Financial Pte. Ltd. at 6826 9988 for matters arising from, or in connection with the report.
In the case of all other recipients of this report, to the extent permitted by applicable laws and regulations neither StoneX Financial Pte. Ltd. nor its associated companies will be responsible or liable for any loss or damage incurred arising out of, or in connection with, any use of the information contained in this report and all such liability is hereby expressly disclaimed. No representation or warranty is made, express or implied, that the content of this report is complete or accurate.
StoneX Financial Pte. Ltd. is not under any obligation to update this report.
Trading CFDs carries a high level of risk that may not be suitable for some investors. Consider your investment objectives, level of experience, financial resources, risk appetite and other relevant circumstances carefully. The possibility exists that you could lose some or all of your investments, including your initial deposits. If in doubt, please seek independent expert advice. Visit www.forex.com/en-sg/terms-and-policies for the complete Risk Disclosure Statement.