



Gold forecast: XAU/USD could take a larger dive after the big rise in yields
Gold prices have been falling in the last few days after last week’s post-FOMC pop faded amid rising interest rate expectations, higher oil prices and a strengthening US dollar. As before, I wasn’t convinced gold would thrive in the current macro backdrop.
Share this:

Gold prices have been falling in the last few days after last week’s post-FOMC pop faded amid rising interest rate expectations, higher oil prices and a strengthening US dollar. As before, I wasn’t convinced gold would thrive in the current macro backdrop. Elevated oil prices and rising bond yields makes it difficult to change our cautious gold forecast until something changes fundamentally. Yesterday saw the US dollar continued to press higher, supported by the slump in the bond markets as yields broke out across the curve. The greenback was also helped in part by some forecast-beating US macro data and hawkish Fed commentary. So, gold and silver both fell and today they metals are looking to extend those losses with oil prices back above $100 on Brent.
Gold forecast undermined by hawkish Fed, strengthening dollar and rising yields
There was a modest pullback in the dollar this morning, but without any fundamental justification. The greenback is likely to stay supported especially if we now see a deeper sell-off in equity markets, as that would boost its safe haven appeal. The Fed story remains the dominant force in FX, with hawkish policymakers doing enough to keep the dollar in demand following last week’s rate hike. Economic data has also been supportive as the S&P Global US composite PMI jumped to 58.4 from 56.0 in August, reaching its highest level since July 2021. Services led the advance and hiring strengthened, but businesses also reported higher input costs – pointing to more inflation and giving the Fed more reason to raise rates again. Today, the focus will be on the summit between Donald Trump and Xi Jinping. It remains to be seen how the dollar may react to this. Gold is likely to remain under pressure in any case amid rising bets of policy tightening.
Gold’s opportunity cost rises as yields break out
One of the main reasons why gold and other low- and zero-yielding assets have come under pressure is due to the fact bond markets are slumping. We have seen the US 10-year yields soar above 5.0% and 30-year yields are testing the 2007 highs. Gold’s correlation with yields is highlighted in the chart below:
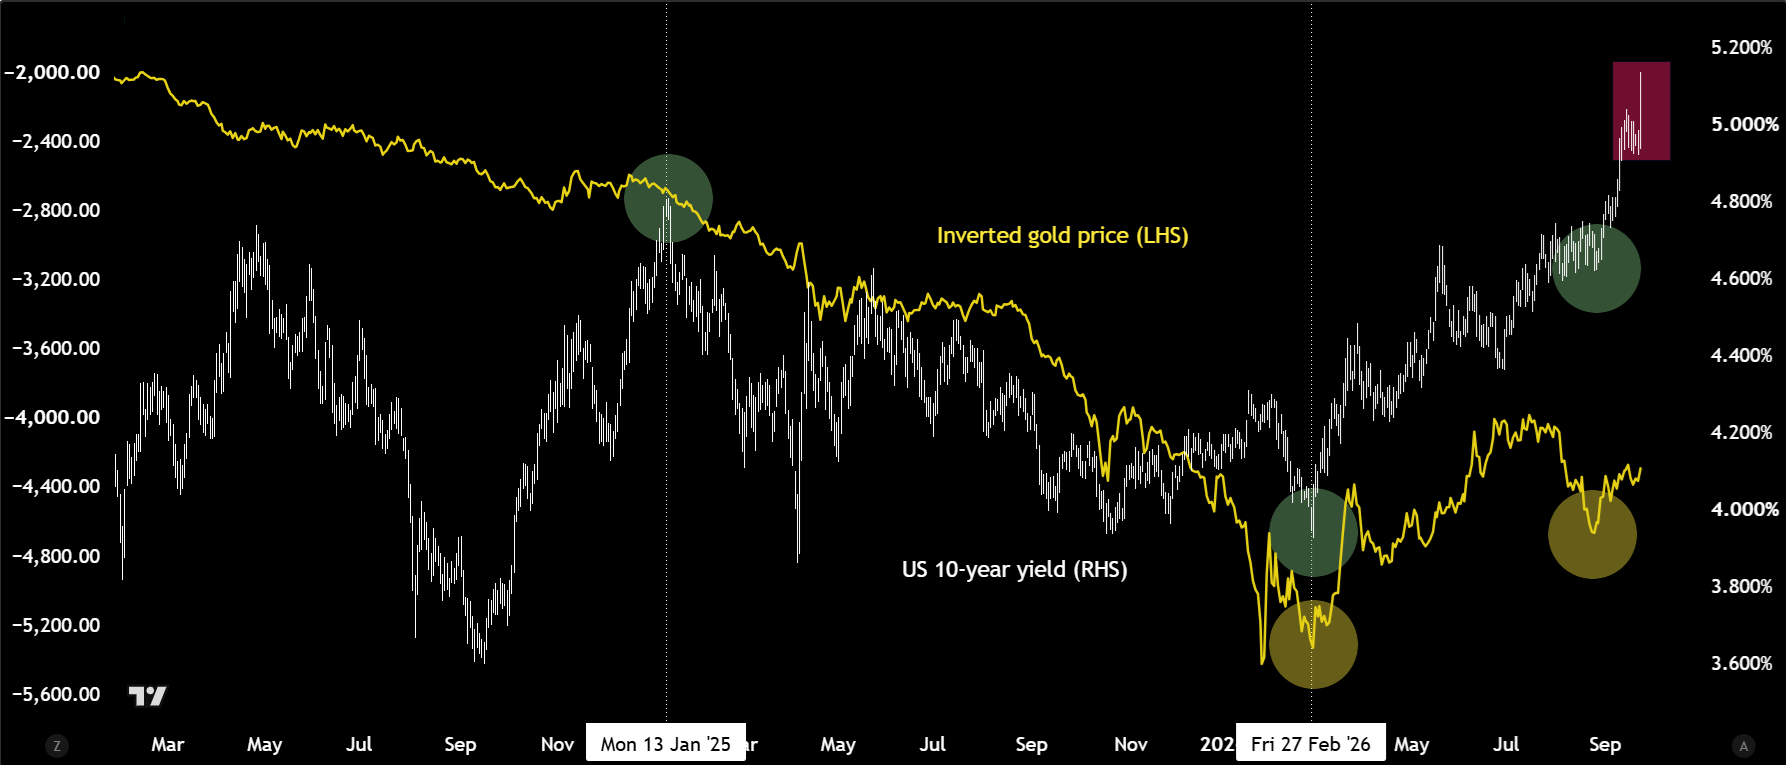
The above chart shows gold inverted prices vs. US 10y bond yields
Gold typically goes up when yields go down as opportunity cost of holding the zero-yielding asset decreases. And when yields rise, gold typically heads lower for the same reason
Yesterday saw a big breakout in US yields with the 10-year surging above 5%. Correspondingly, gold fell around 1.5%. But is the metal now about to take a much larger drop?
Well, judging by this chart you can't be bullish gold. BUT if investors now lose faith in the Fed and its ability to control inflation or yields, then the dollar debasement trade could resurface and that could be positive for gold, silver and bitcoin, as well as currencies of countries with better fiscal discipline.
Gold technical analysis: downside pressure is building
From a technical perspective, not much has changed for me to turn bullish on gold forecast. As I warned about that breakout from the falling wedge pattern last week, which looked similar to price action preceding the breakout in early August, we needed to see some further confirmation. Well, we didn’t get much upside follow-through. That means the bullish traders who bought on the back of that pattern are now trapped. Some of traders will have their stops resting below recent lows near $4235. That’s precisely where I think gold is heading to next.
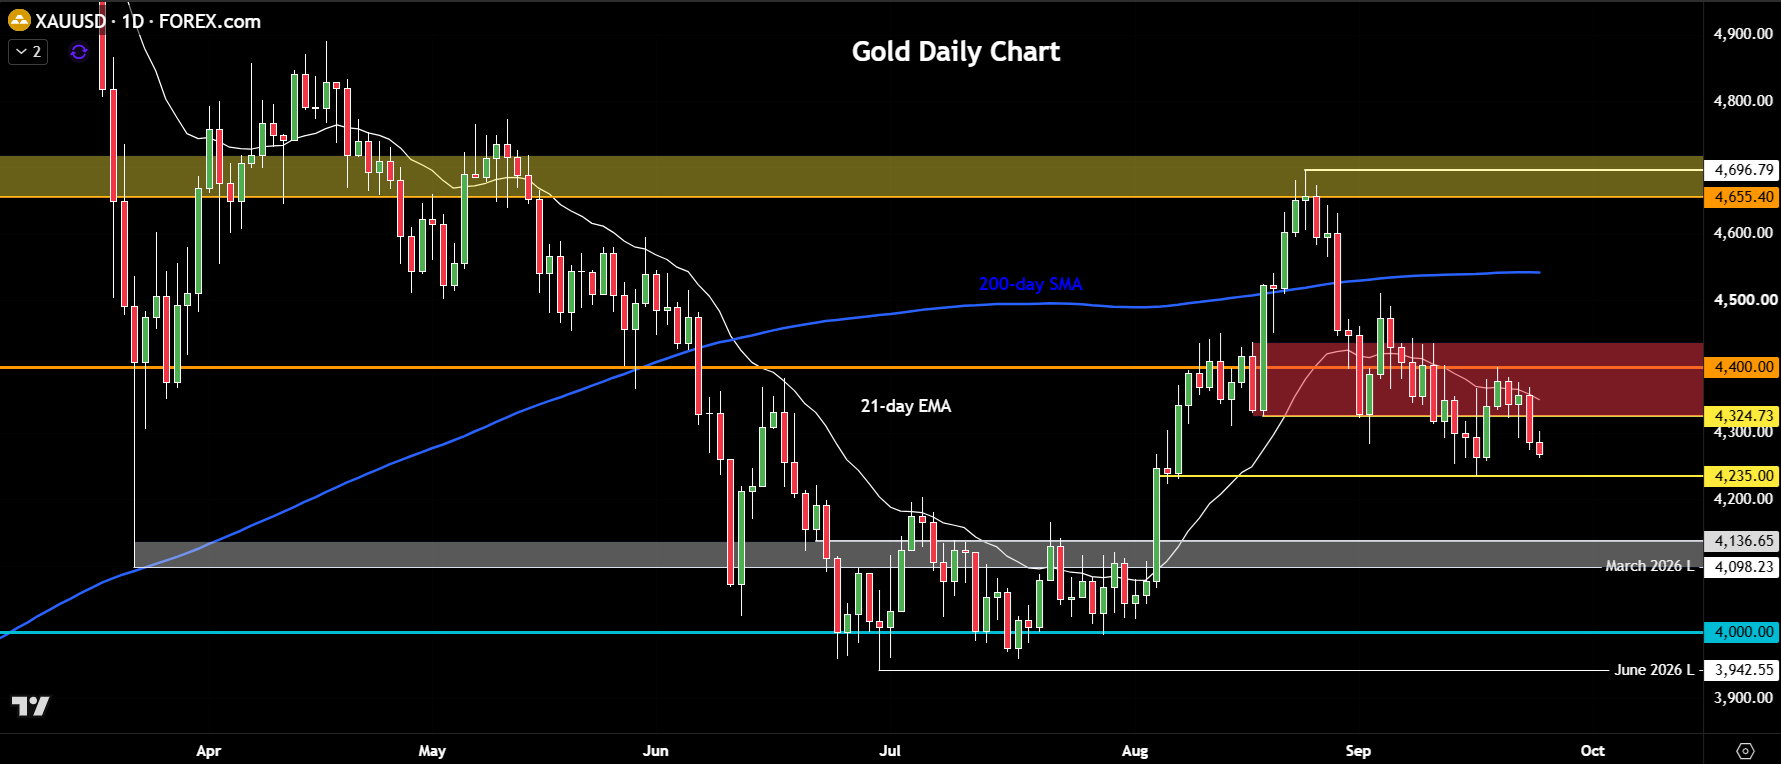
Gold has been effectively in a larger consolidation/bearish trend since peaked back in January. The series of lower highs and lower lows have not yet been violated to suggest the trend has turned bullish again. Thus, the bigger risk is that we could see further long side liquidation in XAUUSD, perhaps much larger than we so far have.
If gold continues to head lower from current levels, and goes on to eventually break below support at $4235, then that could pave the way for a continuation towards $4,100 initially, ahead of $4,000 next.
On the upside, key resistance is now seen around $4,300-$4325 area, followed by $4,400. As a minimum, I’d like to see gold break above the $4,400 level on a closing basis before I can drop my bearish gold forecast.

Related tags:


Open an account in minutes
Experience award-winning platforms with fast and secure execution, and enjoy tight spreads from 0.5 pts on FX and 0.3 pts on indices.
Economic calendar
Web Trader platform
Our sophisticated web-based platform is packed with features.
Related articles
USD/CAD shooting star puts September surge on notice
USD/CAD has printed a clear bearish reversal pattern after an extraordinary September surge, but confirmation may depend heavily on how US Treasury yields react to Friday’s payrolls report.

USD/CHF Reverses as Swiss Franc Surges amid Bond Carnage
USD/CHF reverses from channel resistance as bond volatility surges and broad Swiss franc strength points to a possible carry-trade unwind.


Gold Price Forecast: XAU/USD Plunges 12.4% Toward Critical Support 10 1 2026
Softer inflation has revived expectations for a Fed pause, but Friday’s payrolls could put gold’s recovery prospects to the test.

This report is intended for general circulation only. It should not be construed as a recommendation, or an offer (or solicitation of an offer) to buy or sell any financial products. The information provided does not take into account your specific investment objectives, financial situation or particular needs. Before you act on any recommendation that may be contained in this report, independent advice ought to be sought from a financial adviser regarding the suitability of the investment product, taking into account your specific investment objectives, financial situation or particular needs.
StoneX Financial Pte. Ltd., may distribute reports produced by its respective foreign entities or affiliates within the StoneX group of companies or third parties pursuant to an arrangement under Regulation 32C of the Financial Advisers Regulations. Where the report is distributed to a person in Singapore who is not an accredited investor, expert investor or an institutional investor (as defined in the Securities Futures Act), StoneX Financial Pte. Ltd. accepts legal responsibility to such persons for the contents of the report only to the extent required by law. Singapore recipients should contact StoneX Financial Pte. Ltd. at 6826 9988 for matters arising from, or in connection with the report.
In the case of all other recipients of this report, to the extent permitted by applicable laws and regulations neither StoneX Financial Pte. Ltd. nor its associated companies will be responsible or liable for any loss or damage incurred arising out of, or in connection with, any use of the information contained in this report and all such liability is hereby expressly disclaimed. No representation or warranty is made, express or implied, that the content of this report is complete or accurate.
StoneX Financial Pte. Ltd. is not under any obligation to update this report.
Trading CFDs carries a high level of risk that may not be suitable for some investors. Consider your investment objectives, level of experience, financial resources, risk appetite and other relevant circumstances carefully. The possibility exists that you could lose some or all of your investments, including your initial deposits. If in doubt, please seek independent expert advice. Visit www.forex.com/en-sg/terms-and-policies for the complete Risk Disclosure Statement.