



AUD/USD, NZD/USD outlook: Can the antipodeans defy dollar hawks?
Interest rate markets bought the JOLTS headline. The dollar didn't. Here's why that matters for AUD/USD and NZD/USD.
Share this:

- JOLTS beat masks softer labour market internals
- Conference Board survey flags rising US unemployment risk
- Dollar shrugs off hawkish Fed repricing
- Quarter-end flows cloud FX signals
- AUD, NZD rebound faces early technical test
The search for a cleaner signal
It's the first trading day of a new month, and hopefully a period where we can start putting a little more faith in market signals than we've been able to over the past week. Quarter-end flows have muddied the waters across markets recently, making it difficult to know whether moves can be trusted. With those distortions now hopefully behind us, the price action may provide a cleaner signal.
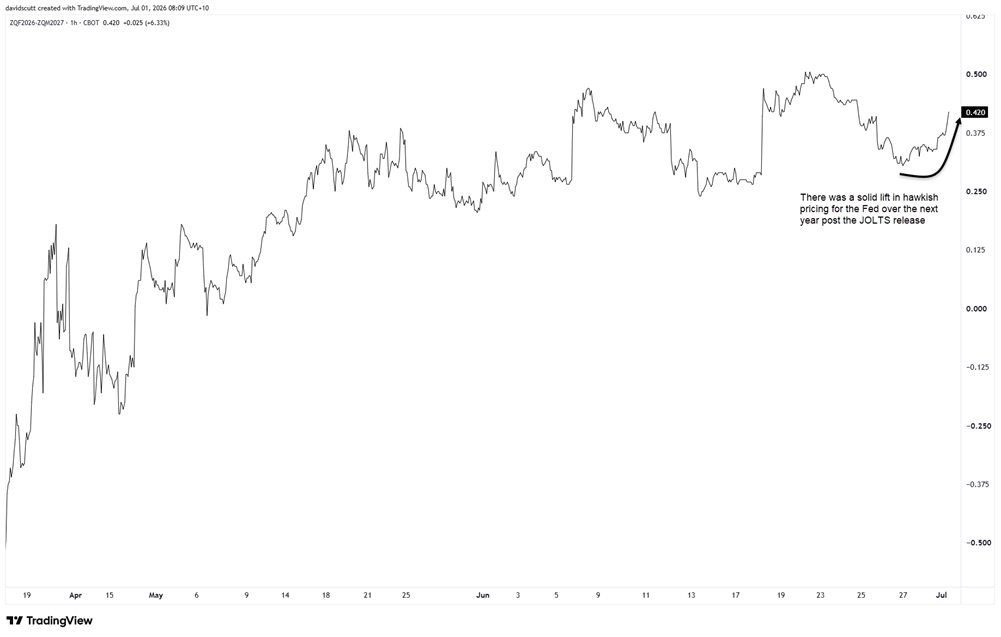
Which brings us to the Aussie and Kiwi, both of which rebounded strongly overnight alongside improving risk appetite. Under normal circumstances, a stronger-than-expected JOLTS report and a sharp repricing higher in Fed rate expectations would have been expected to lift the US dollar. Instead, it fell.
Source: TradingView
That's consistent with another recent development. The relationship between the US dollar and front-end US rate expectations has deteriorated noticeably over the past week, despite remaining strong over longer timeframes. So, can we trust the rebound in the antipodeans, or is quarter-end noise distorting the signal?
A stronger JOLTS report, but...
At first glance, the latest JOLTS report looked strong. Job openings rose to 7.59 million in May, comfortably beating expectations and prompting markets to price in a more hawkish Fed outlook. However, I'd be cautious about reading too much into it. The JOLTS survey has become increasingly noisy as response rates have deteriorated, increasing the potential for outsized surprises in either direction.
Looking beneath the headline, there are reasons to question how much labour demand actually improved. Leisure and hospitality accounted for one of the largest increases in job openings, driven primarily by restaurants and bars. Given the survey covered May, the month before the World Cup got underway, it's plausible preparations for the tournament temporarily boosted vacancies. Beyond that, there wasn't confirmation elsewhere. The quits rate was unchanged at 1.9%. The hiring rate remained subdued at 3.3%. Layoffs, while still historically low, edged higher. It still looks like a low-hire, low-fire labour market.
The Conference Board's consumer confidence survey for June portrayed a far less rosy story. The share of consumers saying jobs were plentiful was little changed at 24.9%. Those saying jobs were hard to get jumped to 22.5%, the highest since January 2021. As a result, the labour market differential, the gap between jobs plentiful and jobs hard to get, fell from 5.0 to 2.4, the lowest level in more than five years.
Historically, that measure has shown a strong relationship with movements in the unemployment rate. If that relationship holds, it points to upside risk for unemployment in the months ahead. If that were to play out in reality, it would cast serious doubt on the Fed's willingness to embark on a fresh tightening cycle, especially now that fears of an energy-led inflation pulse have eased markedly.
The countdown to payrolls
Source: TradingView (US EDT)
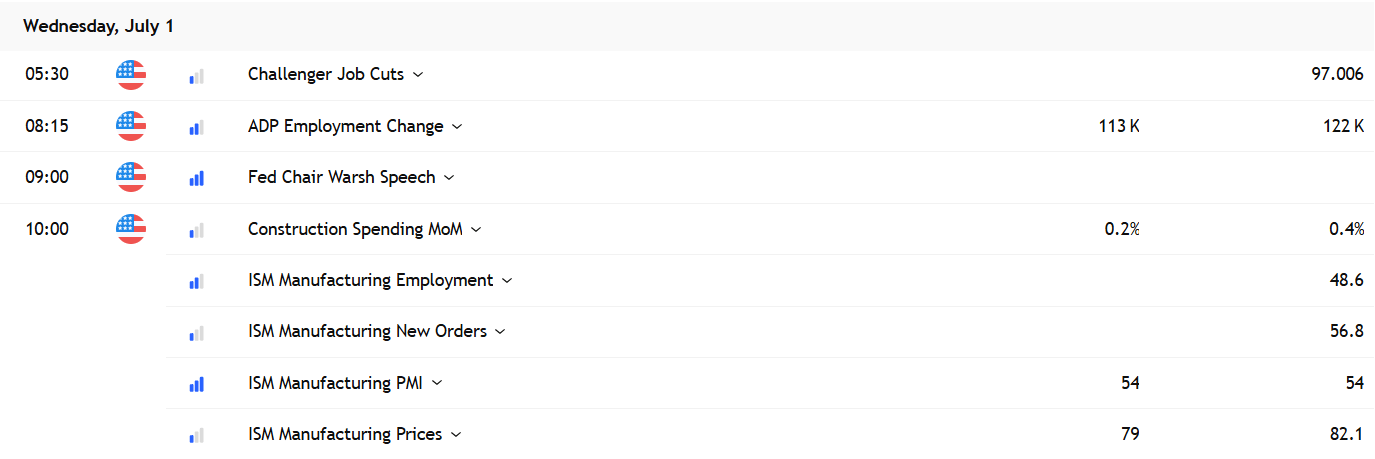
Attention now turns to Wednesday's ADP private sector payrolls report and ISM manufacturing PMI ahead of Thursday's non-farm payrolls release. Markets expect ADP to show private employment increased by 113,000 in June, down modestly from 122,000 in May. If realised, and assuming labour force participation remains relatively steady, that pace of hiring should be enough to keep labour market conditions broadly stable given population growth is now running much slower than it was a few years ago.
The employment component of the ISM manufacturing survey will also be worth watching, although it's unlikely to provide the strongest signal on the labour market. Summer shutdowns and factory retooling can distort hiring patterns at this time of year, while manufacturing accounts for a relatively small share of US employment. The ISM services survey, due early next week, should provide a better read on broader hiring conditions.
The other key event today is Kevin Warsh's appearance on a panel with several other central bankers at the conclusion of the ECB's Sintra conference in Portugal. The discussion runs for an hour. Warsh made it clear after last month's FOMC meeting that he had little interest in providing forward guidance, so expectations should be kept in check. Even so, markets will be parsing every word he says. If he maintains his recent emphasis on returning inflation to target, it's unlikely to do anything to dissuade traders from continuing to price the risk of Fed rate hikes in the months ahead, even if a move as early as July still looks a stretch.
A swing low or potential bull trap?
Source: TradingView
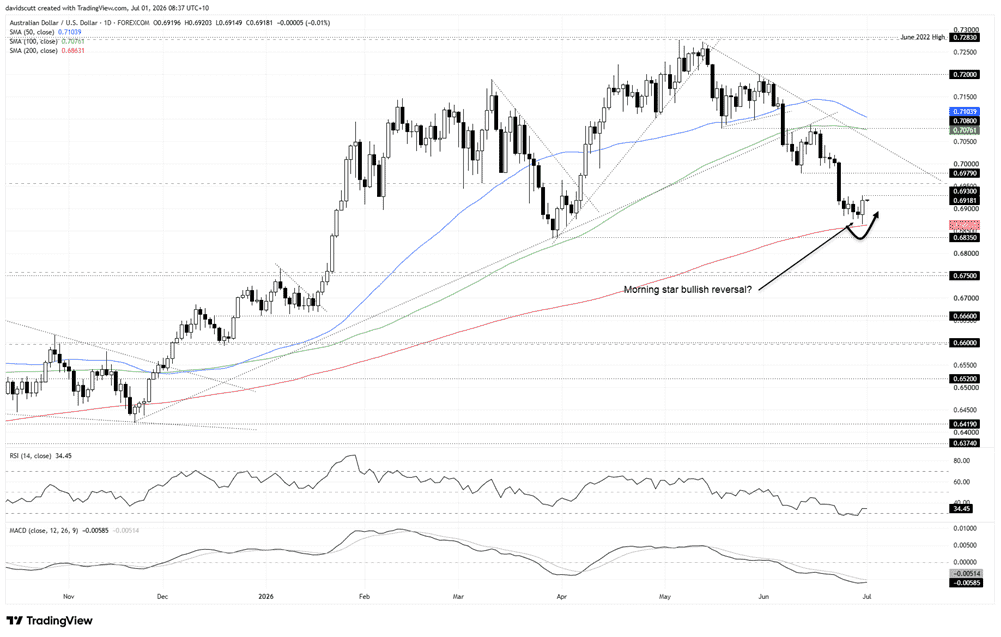
AUD/USD remains in a clear downtrend beneath the 50 and 100-day moving averages, printing a series of lower highs and lower lows since the start of May. However, the decline has stalled over the past week, leaving the pair perched just above the 200-day moving average.
That makes the 200-day moving average and the March swing low at 0.6835 the immediate levels to watch. A break of both would strengthen the case for another leg lower, exposing the 38.2% Fibonacci retracement of the April 2025-May 2026 bull move at 0.6757, followed by former resistance at 0.6750.
The oscillators continue to favour selling into strength, but the signal is becoming less convincing. RSI continues to print lower highs and remains above, but not far from, oversold territory, suggesting downside momentum remains in the ascendancy without strengthening further. MACD tells a similar story. The bearish crossover from May remains intact with the indicator still below the signal line and in negative territory, but the two lines are beginning to converge.
That dovetails with the recent price action. While far from textbook, the past three sessions resemble a morning star reversal pattern following an established downtrend. It doesn't invalidate the broader bearish trend, but it does suggest a swing low may be in place.
If buyers can build on Tuesday's rebound, 0.6930 is the first level to watch after capping the advance overnight. Above that sits the 23.6% Fibonacci retracement of the April 2025-May 2026 bull move at 0.6956, followed by 0.6979, the breakdown point from the latest leg lower.
Resistance stands in the way
Source: TradingView
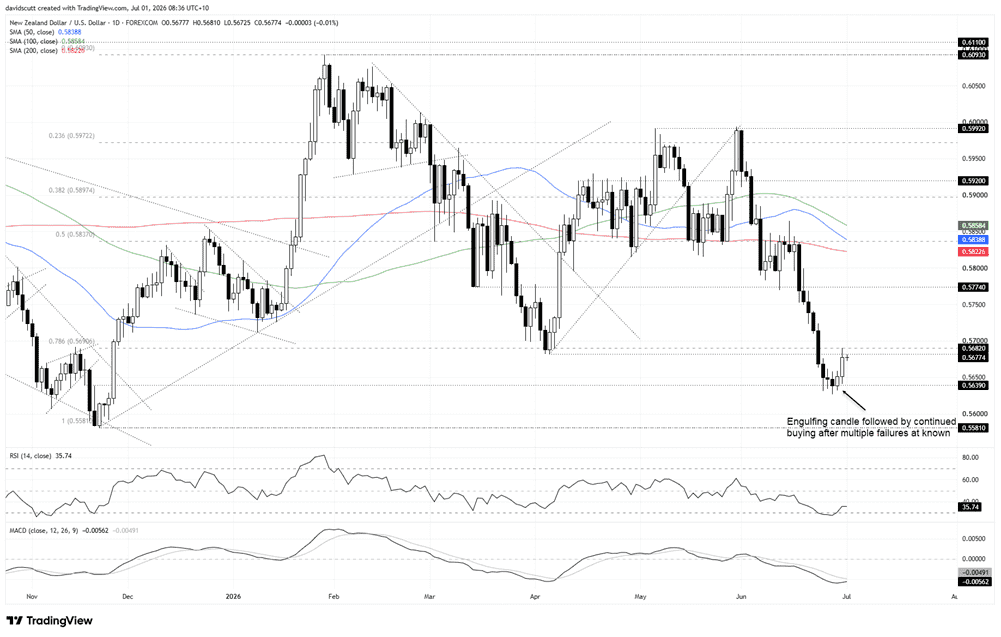
NZD/USD also remains in a broader downtrend, but unlike the Aussie, the recent price action provides a slightly more convincing case that a corrective bounce may be developing.
The immediate focus sits overhead between 0.5676, the April swing low, and the 78.6% Fibonacci retracement of the November 2025-January 2026 bull move. The pair stalled in that zone on Tuesday. A break and close above it would strengthen the case for a corrective rebound, exposing 0.5774, a level that has repeatedly acted as both support and resistance this year.
On the downside, 0.5639 is the key level to watch after marking the low late last week. An engulfing candle followed by Tuesday's follow-through suggests a swing low may be in place. However, a break beneath 0.5639 would put the focus back on the November 2025 swing low at 0.5581.
The oscillators continue to favour selling into strength, although the bearish signal is beginning to weaken. RSI has recovered from oversold territory to around 35 but continues to print lower highs. MACD remains below the signal line and in negative territory, although the two lines continue to converge. It's not yet a cautionary signal for the bears, but it's moving in that direction should recent price action continue.
Latest market news




Open an account in minutes
Experience award-winning platforms with fast and secure execution, and enjoy tight spreads from 0.5 pts on FX and 0.3 pts on indices.
Economic calendar
Web Trader platform
Our sophisticated web-based platform is packed with features.
Related articles
USDJPY Forecast Intervention Fears Clash with Dollar Strength
Recent trading sessions have produced mixed results for the Japanese yen. By the end of last week, USD/JPY had fallen by more than 1.00%, reflecting a modest recovery in the yen. However, the start of this week has seen the pair move slightly back in favor of the U.S. dollar, posting gains of around 0.04%.
Nasdaq 100 Forecast: NDX falls as oil jumps and Treasury yields rise
U.S. stocks are pointing to a weaker open on Monday after President Trump rejected an Iranian ceasefire, sending oil prices higher and fuelling inflationary concerns and pushing Treasury yields higher.

AUD/USD forecast: Currency Pair of the Week | September 28, 2026
The week has started with stocks, gold, silver and bitcoin all falling, as crude oil rebounded and bond yields pushed further higher. Trump refusing to agree to Tehran’s proposal to re-open the Strait of Hormuz has left the markets disappointed. Still, reports that mediators are expected to hold talks with the two sides on an amended version of the 7-day proposal that Iran presented, keeps hopes alive that we may see some progress.

This report is intended for general circulation only. It should not be construed as a recommendation, or an offer (or solicitation of an offer) to buy or sell any financial products. The information provided does not take into account your specific investment objectives, financial situation or particular needs. Before you act on any recommendation that may be contained in this report, independent advice ought to be sought from a financial adviser regarding the suitability of the investment product, taking into account your specific investment objectives, financial situation or particular needs.
StoneX Financial Pte. Ltd., may distribute reports produced by its respective foreign entities or affiliates within the StoneX group of companies or third parties pursuant to an arrangement under Regulation 32C of the Financial Advisers Regulations. Where the report is distributed to a person in Singapore who is not an accredited investor, expert investor or an institutional investor (as defined in the Securities Futures Act), StoneX Financial Pte. Ltd. accepts legal responsibility to such persons for the contents of the report only to the extent required by law. Singapore recipients should contact StoneX Financial Pte. Ltd. at 6826 9988 for matters arising from, or in connection with the report.
In the case of all other recipients of this report, to the extent permitted by applicable laws and regulations neither StoneX Financial Pte. Ltd. nor its associated companies will be responsible or liable for any loss or damage incurred arising out of, or in connection with, any use of the information contained in this report and all such liability is hereby expressly disclaimed. No representation or warranty is made, express or implied, that the content of this report is complete or accurate.
StoneX Financial Pte. Ltd. is not under any obligation to update this report.
Trading CFDs carries a high level of risk that may not be suitable for some investors. Consider your investment objectives, level of experience, financial resources, risk appetite and other relevant circumstances carefully. The possibility exists that you could lose some or all of your investments, including your initial deposits. If in doubt, please seek independent expert advice. Visit www.forex.com/en-sg/terms-and-policies for the complete Risk Disclosure Statement.