




AUD/USD, USD/JPY, USD/CNH analysis: Asian Open – 29/08/2023
Despite an exciting start to Monday's Asian session, which saw some of China's stock market indices rally over 4% (and then hand much of it back), it was a quiet session in Europe and the US due to the UK public holiday. USD/JPY has stalled around a key resistance zone. USD/CNH looks appealing to bullish eyes, and AUD/USD (aka "the battler") is refusing to simply roll over and fall below 64 cents.
Share this:

- Trading volumes were much lower during the European session due to the UK public holiday on Monday
- This means a lot of the supposed ‘Doji’s’ and general indecision patterns can largely be looked past, as they formed on a day of low trading activity over any high-volumed battle between bulls and bears
- Whilst China’s equity markets were quick to rally out of the gate on Monday, they failed to hold on to most of their gains after regulators announced measures to boost market sentiment
- The China A50 had a daily high to low range of over 5%, the CSI 300 initially rose 4.6% and the Hang Seng 2.5%, yet all handed back a decent chunk of those earlier gains
- Whilst the announcement of lower stamp duty, margin ratio’s and commissions helped the initial pump, I cannot see if changing the views of fund managers who are either bearish or on the sideline with due to bearish fundamentals. So whilst the measures may help support markets to a degree, we’ll need to see a stimulatory bazooka to materially send China’s equity markets higher.
- Australian retail sales rose 0.5% in July, above the 0.3% expected and -0.8% prior. It seems Australian consumers aren’t quite ready to roll over, with July’s 0.5% figure also exceeding its 12-month average of 0.16% and long-term average of 0.48%. But it is hardly on fire either, so I don’t think there’s any immediate cause for concern regarding another RBA hike. Perhaps that could change if inflation doesn’t behave in Wednesday’s report.
- Wall Street rose for a second day despite Powell’s hint at one more Fed hike, although Monday’s bullish opening gaps were only met with modest gains in the session

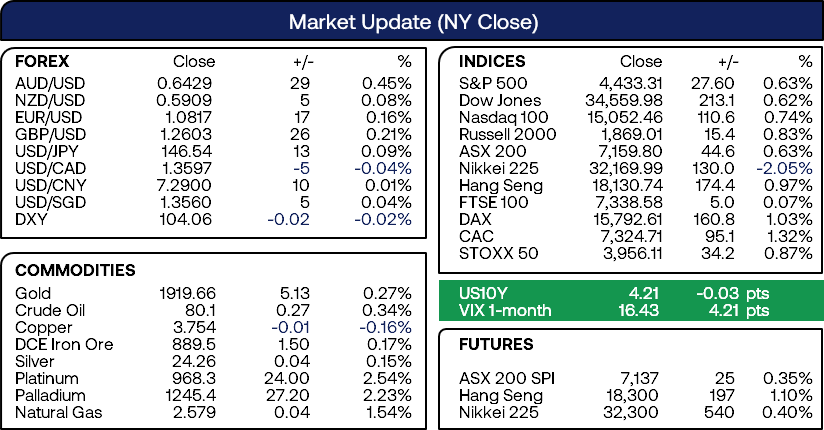
Events in focus (AEDT):
- 09:30 – Japan’s unemployment rate, jobs/applications ratio and 2-year JGB auction
- 17:40 – RBA assistant governor (soon to be governor) speaks on “Climate Change and Central Banks”
- 00:00 – US consumer sentiment (Conference Board), US JOLTS job openings
ASX 200 at a glance:
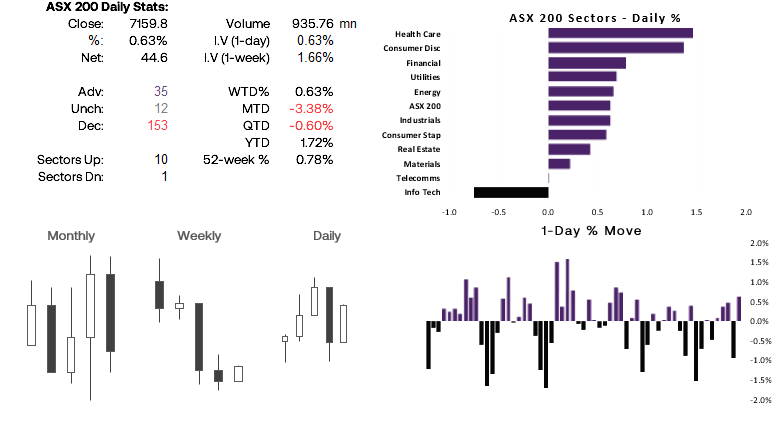
- The ASX 200 enjoyed its most bullish day in 22, although it has not exactly outperformed over the past month which means it could achieve that stat with a modest inside day.
- Given light trade overnight, I suspect the ASX 200 might remain within Thursday – Friday’s range, somewhere between 7100 – 7200.

USD/JPY technical analysis (daily chart):
I want to highlight the significance of the current levels that USD/JPY has stalled at. Whether that creates a tradeable opportunity is perhaps another conversation, but it could at least help explain why the market is hesitant to simply break higher.
Yesterday’s small-ranged candle (due to lower trading activity) is meandering around the 146.59 high, which was set on November 10 due to a soft US CPI report and subsequent plunge on USD/JPY (and the US dollar in general). USD/JPY also perfectly respected that November 10 high on August 23, so it is clearly a level traders are closely watching. And even if USD/JPY manages to break this level today or this week, there is also a strong volume node around 147.1 – and such levels can behave as both a magnet or support/resistance level.
Add to the fact that the US02Y-JP02Y spread has also stalled beneath its own March high, and that risks of verbal (or actual) intervention increase with each leg higher on USD/JPY, bulls may want to instead seek dips over breakouts.
Countertrend bears may prefer to fade such moves. But keep in mind that USD/JPY has a tendency to toy with a decent break of levels before reversing lower (at least that is what I have observed recently), so perhaps a better approach could be to wait for the breakout of resistance to then be coupled with a reversal back beneath the breakout level, and essentially waiting for it to be deemed a ‘fakeout’ before seeking shorting.
USD/CNH technical analysis (daily chart):
USD/CNH remains in an established uptrend on the daily chart, although it has pulled back slightly from its YTD highs and formed a consolidation above the June highs and 20-day EMA. Note that the US02y-CN02Y spread has already broken to cycle high to suggest further upside potential for USD/CNH over the near-term. Bulls could seek dips around the current cycle lows with a initial target around 7.3500, and potentially hold on to see if it can break above the 2022 high. However, even if prices instead decide to pull back further from current levels, the trend structure is firmly bullish enough to reconsider longs around trend support or the 2019/2022 highs.
AUD/USD technical analysis (1-hour chart):
AUD/USD formed a bullish inside day as ‘the battler’ continues to defy the strong US dollar and simply roll over beneath 64c. We showed the long-term trend support level projected from the pandemic low in yesterday’s Asian Open report, and until that level breaks then I favour an upside bounce to catch bears off guard. Yet due to the lower levels of anticipated volatility, traders may want to refer to much lower timeframes and seek ‘the scraps’ or step aside until volatility returns.
The 30-minutes charts chows that AUD/USD held above key support levels following Jerome Powell’s speech on Friday, and has since formed two higher lows. Given the scrappy nature of price action I am a little sceptical of traditional breakouts, and would prefer to seek long opportunities at lower support levels if we see prices pull back and form another higher low. Otherwise, not trade seems like a good trade without the arrival of a weak-USD catalyst.
View the full economic calendar
View the full economic calendar
-- Written by Matt Simpson
Follow Matt on Twitter @cLeverEdge
How to trade with City Index
You can trade with City Index by following these four easy steps:
- Open an account, or log in if you’re already a customer
• Open an account in the UK
• Open an account in Australia
• Open an account in Singapore
- Search for the market you want to trade in our award-winning platform
- Choose your position and size, and your stop and limit levels
- Place the trade
Related tags:
Latest market news




Open an account in minutes
Experience award-winning platforms with fast and secure execution, and enjoy tight spreads from 0.5 pts on FX and 0.3 pts on indices.
Economic calendar
Web Trader platform
Our sophisticated web-based platform is packed with features.
Related articles
EUR/USD Forecast: Euro Struggles to Find Support Even After U.S. PCE Data
The euro continues to face a challenging environment in the short term. The currency has struggled to regain ground against a U.S. dollar that remains firmly supported, a dynamic reflected in EUR/USD, which has now recorded three consecutive losing sessions and a decline of roughly 0.6%.
Canadian Dollar Forecast: USD/CAD Four-Week Rally Eyes Yearly Highs 9 30 2026
USD/CAD has advanced in 14 of the past 15 sessions, but stretched momentum raises the stakes as major resistance and NFP come into focus.

British Pound Technical Outlook: GBP/USD Rebound Challenges September Downtrend 9 30 2026
Sterling has rallied sharply from key support, with GBP/USD at an inflection point that could determine whether a larger recovery is underway.
This report is intended for general circulation only. It should not be construed as a recommendation, or an offer (or solicitation of an offer) to buy or sell any financial products. The information provided does not take into account your specific investment objectives, financial situation or particular needs. Before you act on any recommendation that may be contained in this report, independent advice ought to be sought from a financial adviser regarding the suitability of the investment product, taking into account your specific investment objectives, financial situation or particular needs.
StoneX Financial Pte. Ltd., may distribute reports produced by its respective foreign entities or affiliates within the StoneX group of companies or third parties pursuant to an arrangement under Regulation 32C of the Financial Advisers Regulations. Where the report is distributed to a person in Singapore who is not an accredited investor, expert investor or an institutional investor (as defined in the Securities Futures Act), StoneX Financial Pte. Ltd. accepts legal responsibility to such persons for the contents of the report only to the extent required by law. Singapore recipients should contact StoneX Financial Pte. Ltd. at 6826 9988 for matters arising from, or in connection with the report.
In the case of all other recipients of this report, to the extent permitted by applicable laws and regulations neither StoneX Financial Pte. Ltd. nor its associated companies will be responsible or liable for any loss or damage incurred arising out of, or in connection with, any use of the information contained in this report and all such liability is hereby expressly disclaimed. No representation or warranty is made, express or implied, that the content of this report is complete or accurate.
StoneX Financial Pte. Ltd. is not under any obligation to update this report.
Trading CFDs carries a high level of risk that may not be suitable for some investors. Consider your investment objectives, level of experience, financial resources, risk appetite and other relevant circumstances carefully. The possibility exists that you could lose some or all of your investments, including your initial deposits. If in doubt, please seek independent expert advice. Visit www.forex.com/en-sg/terms-and-policies for the complete Risk Disclosure Statement.