





AUD/USD weekly outlook: AUD falls below 200-day SMA on rising US yields, election jitters
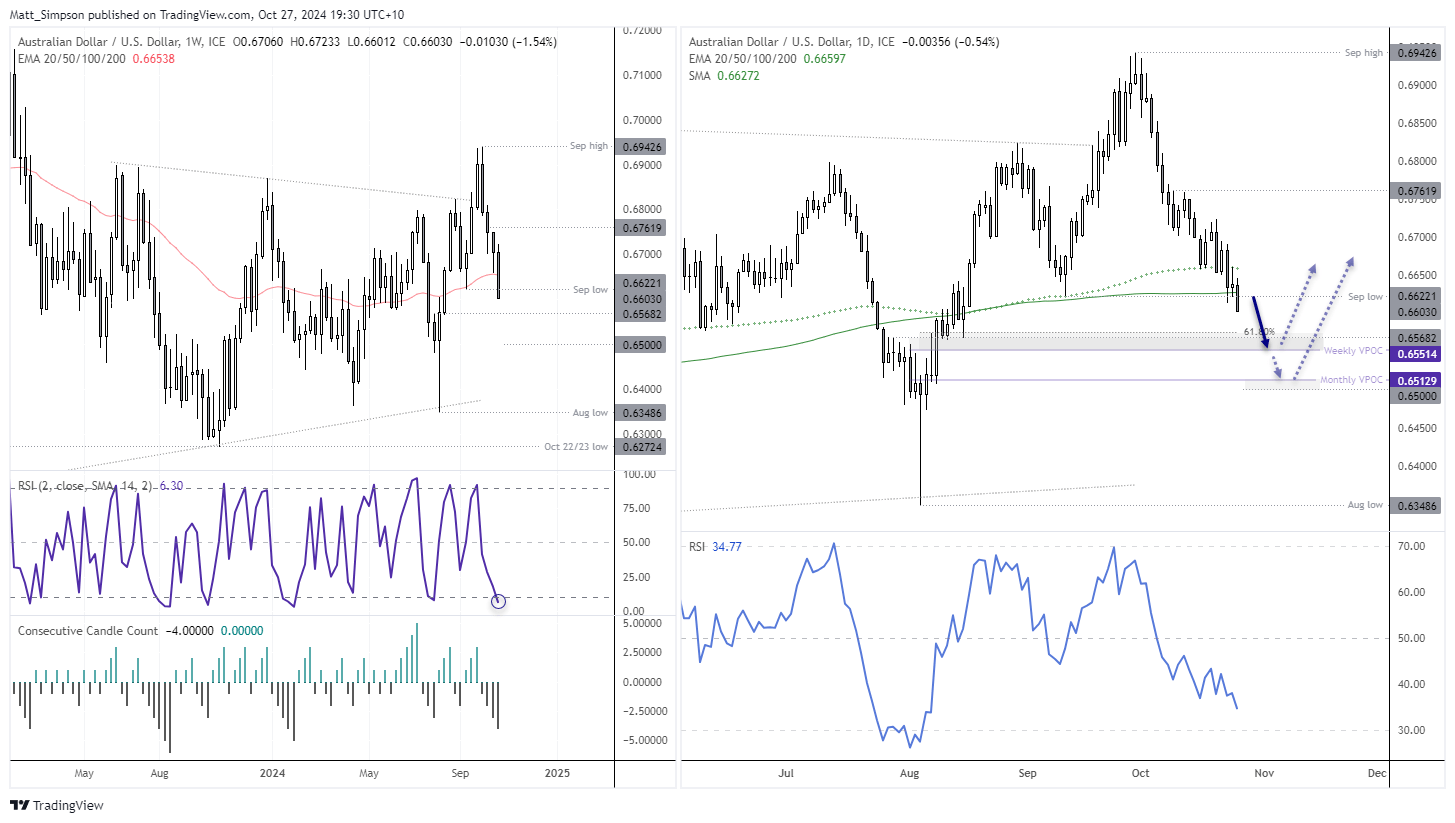
The selloff on AUD/USD extended into its fourth week, and closed beneath the 200-day average on Friday. The Aussie shows the potential to fall for a fifth week, should Trump continue to gain traction in election polls and US data outperforms.
Share this:

- AUD/USD fell for a fourth week and closed beneath its 200-day SMA on Friday
- Election jitters with Trump rising in the polls and higher US yields appear to be behind the ‘risk-off’ moves for AUD/USD
- Australia’s quarterly CPI is the main domestic event, although I doubt it will soften enough to warrant a dovish RBA
The US election is fast approaching
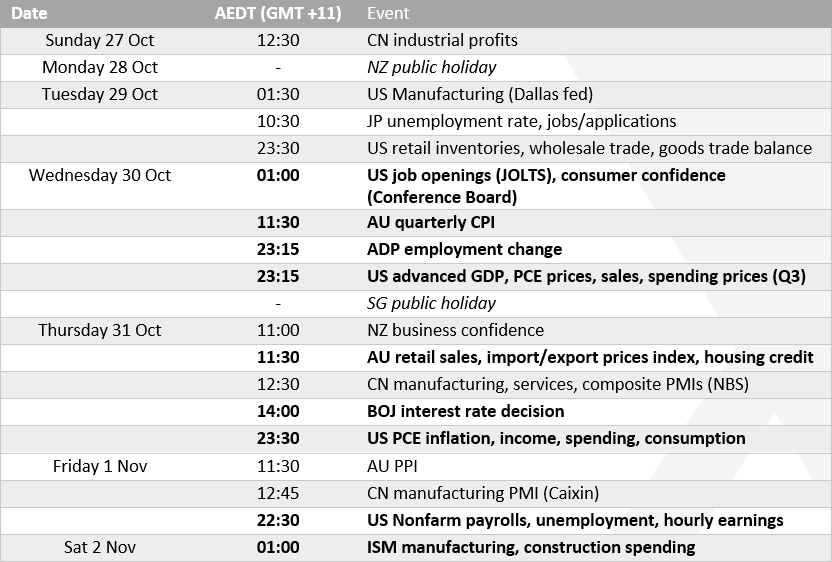
We can breeze past Monday and Tuesday with little to nothing of great interest in the calendar. Although traders will need to keep an eye on election headlines as it is beginning to make an impact on sentiment, and that means AUD/USD can get caught in the crosswinds. But from Wednesday onwards the economic calendar really heats up.
Australia’s quarterly CPI report
Trimmed mean is the inflation figure to watch, if you had to watch just one. Although I doubt it will do much if a favour for the RBA, where rate cuts are concerned. While its 0.8% q/q print was its second lowest in three years, it was only marginally beneath its 0.88% post-pandemic average. The four years prior to the pandemic averaged 0.41% q/q, and the annual rate of trimmed mean is also a hefty 3.9% y/y. And as the name suggests, trimmed mean has had volatility squeezed out of it, so rarely deviates too far from the prior read. Perhaps the bigger risk here is if we see trimmed mean quarterly rise 0.8% or higher and spark calls for another hike.
Still, traders will react if headline CPI comes in soft, I just doubt it will make a material impact on the RBA who are still mulling over whether a cut or hike is more likely, if or when it happens at all.
Australian retail sales also warrants a look on Thursday, to see if consumers maintained their spending momentum. August’s figures saw a rise of 0.7% m/m to mark its second strongest increase of the year. The 3.1% y/y rate was its highest since May 2023. This hardly screams “rate cut”.
Two key US reports then cap the week off, with PCE inflation on Thursday and nonfarm payrolls on Friday. If recent data is anything to go by, both could exceed estimates and provide further support for yields. If coupled with Trump increasing his lead on election polls, AUD/USD bulls could be in for another tough week.
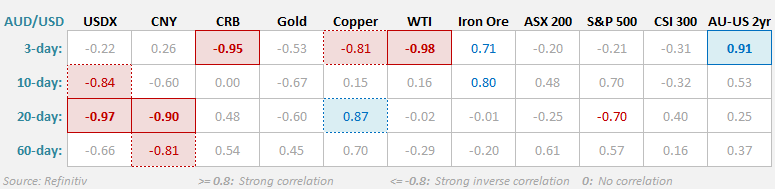
AUD/USD correlation table:
- The positive correlation with yield differentials returned last week, with the 3-day rolling correlation between AUD/USD and the AU-US 2-year spread rising to 0.91
- The inverse relationship between the USD index and AUD/USD remains firm on the 2-week (10-day) and 4-week (20-day) timeframes
- A strong relationship between the Chinese yuan is also in play with USD/CNY scoring -0.9 and -0.81 on the 20-day and 60-day timeframes
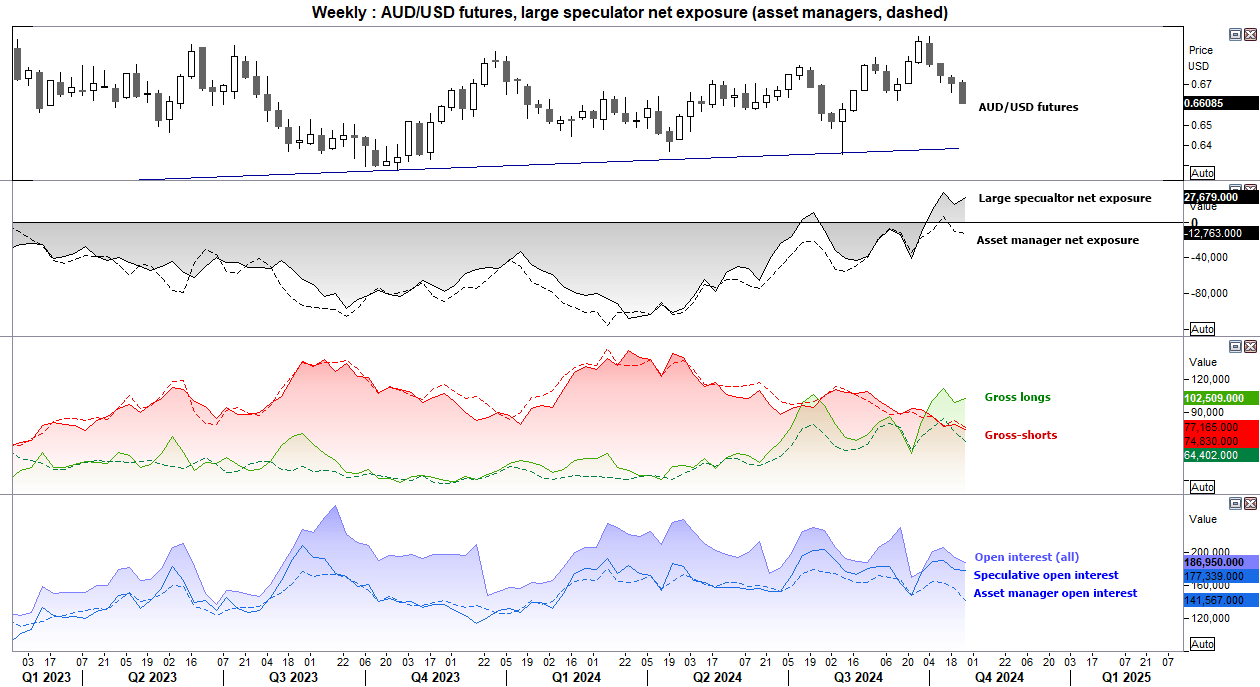
AUD/USD futures – market positioning from the COT report:
Large speculators may have had their fingers burned last week, given they increased gross longs and trimmed shorts in the week up to last Tuesday, only to see prices continue lower through to Friday’s close. Asset managers trimmed both longs and shorts and appear to be de-risking ahead of the US election. I suspect we’ll large speculators trimmed longs in the next report.
AUD/USD technical analysis
The weekly RSI (2) fell to its lowest level since late January at 6.5. While this warns of an oversold market, note that AUD/USD went on to print new lows in the first week of February before the price low was set. And while AUD/USD has already fallen for four consecutive weeks, it fell for five weeks at the beginning of the year, and six weeks in August 2023.
And if US data continues to outperform and polls suggest a Trump win, AUD/USD could easily fall for a fifth week.
The daily chart show prices closed beneath the September low 200-day SMA. Yet the daily RSI (14) is not yet oversold, and it looks like it wants to break beneath 66c. Bears may look to fade into any retracements towards the 200-day SMA (0.6627) or the 200-day EMA (0.6660) in anticipation for a move down to 0.6550, near a weekly VPOC (volume point of control), or even 0.6500 near a monthly VPOC.
-- Written by Matt Simpson
Follow Matt on Twitter @cLeverEdge
How to trade with City Index
You can trade with City Index by following these four easy steps:
- Open an account, or log in if you’re already a customer
• Open an account in the UK
• Open an account in Australia
• Open an account in Singapore
- Search for the market you want to trade in our award-winning platform
- Choose your position and size, and your stop and limit levels
- Place the trade
Latest market news




Open an account in minutes
Experience award-winning platforms with fast and secure execution, and enjoy tight spreads from 0.5 pts on FX and 0.3 pts on indices.
Economic calendar
Web Trader platform
Our sophisticated web-based platform is packed with features.
Related articles
EUR/USD Q4 2026 Outlook: Euro at a Crossroads as Fed, ECB Tighten 9 25 2026
EUR/USD enters Q4 at a pivotal inflection point as competing Fed-ECB policy paths and persistent inflation risks collide with major technical support.


AUD/USD Q4 Outlook: RBA and Fed Hikes Set the Tone
AUD/USD enters Q4 with RBA and Fed hikes in focus as sticky inflation, rising unemployment and US dollar strength shape the Australian dollar.

USD/JPY Q4 2026 Outlook: Hawkish Fed Pricing Clashes With Intervention Risk
The year-end tug-of-war is clear: hawkish Fed pricing supports USD/JPY, while intervention risk limits the upside.

This report is intended for general circulation only. It should not be construed as a recommendation, or an offer (or solicitation of an offer) to buy or sell any financial products. The information provided does not take into account your specific investment objectives, financial situation or particular needs. Before you act on any recommendation that may be contained in this report, independent advice ought to be sought from a financial adviser regarding the suitability of the investment product, taking into account your specific investment objectives, financial situation or particular needs.
StoneX Financial Pte. Ltd., may distribute reports produced by its respective foreign entities or affiliates within the StoneX group of companies or third parties pursuant to an arrangement under Regulation 32C of the Financial Advisers Regulations. Where the report is distributed to a person in Singapore who is not an accredited investor, expert investor or an institutional investor (as defined in the Securities Futures Act), StoneX Financial Pte. Ltd. accepts legal responsibility to such persons for the contents of the report only to the extent required by law. Singapore recipients should contact StoneX Financial Pte. Ltd. at 6826 9988 for matters arising from, or in connection with the report.
In the case of all other recipients of this report, to the extent permitted by applicable laws and regulations neither StoneX Financial Pte. Ltd. nor its associated companies will be responsible or liable for any loss or damage incurred arising out of, or in connection with, any use of the information contained in this report and all such liability is hereby expressly disclaimed. No representation or warranty is made, express or implied, that the content of this report is complete or accurate.
StoneX Financial Pte. Ltd. is not under any obligation to update this report.
Trading CFDs carries a high level of risk that may not be suitable for some investors. Consider your investment objectives, level of experience, financial resources, risk appetite and other relevant circumstances carefully. The possibility exists that you could lose some or all of your investments, including your initial deposits. If in doubt, please seek independent expert advice. Visit www.forex.com/en-sg/terms-and-policies for the complete Risk Disclosure Statement.