



AUD/USD and NZD/USD highly correlated with USD/CNH
Traders can use the correlation coefficient on the 240-minute timeframe to help them determine where AUD/USD and NZD/USD may be headed next.
Share this:

USD/CNH has been on the move as fears of additional lockdowns due to covid grip the markets. Lockdowns could lead to slower production and slower growth. Shanghai is currently entering its fourth week of lockdowns and fears are that Beijing could be next. As a result, the Yuan has sold off, causing USD/CNH to move higher.
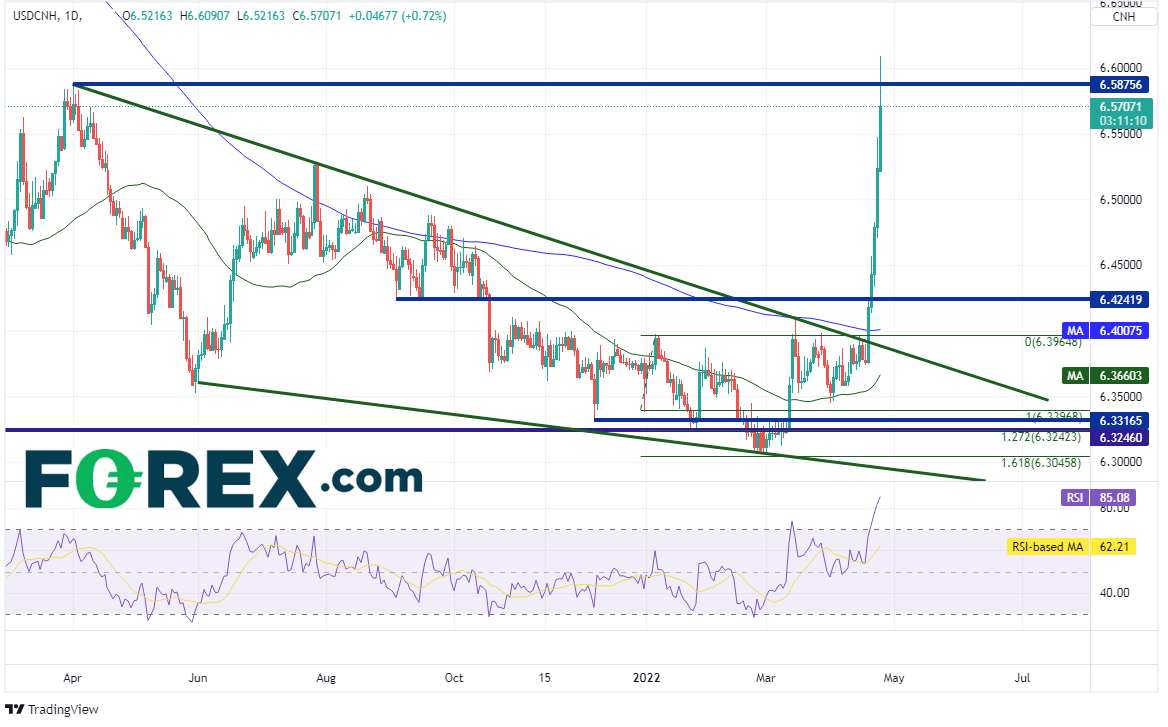
On a daily timeframe, USD/CNH broke out of its descending wedge on April 19th and hasn’t looked back. The target for the breakout of a descending wedge is a 100% retracement of the wedge. The wedge began on April 1, 2021 at 6.5876 and began moving lower. Once price broke above the top trendline of the wedge at 6.3910, it only took 5 days to retracement the whole descending wedge!
Source: Tradingview, Stone X
If the markets worst fears do turn out to be true and China can’t avoid a longer-term slowdown, Australia and New Zealand are likely to take a hit as well, as they are both large exporters to China.
On a 240-minute timeframe, notice at the bottom of the chart that the correlation coefficient between AUD/USD and USD/CNH is -0.97. A reading of -1.00 means that there is a perfect negative correlation. In other words, when one currency pair moves higher, the other moves lower. A reading of -0.97 is extremely close! Therefore, if USD/CNH is ready for a correction, then AUD/USD should move higher. Also notice that the RSI on in oversold territory, an indication that the pair may be ready for a bounce. First resistance isn’t until 0.7347 and then 0.7458. The next support level is at 0.7095.

Source: Tradingview, Stone X
The correlation coefficient between NZD/USD and USD/CNH on a 240-minute timeframe is similar to the one of AUD/USD and USD/CNH at -0.94. Notice that the RSI here is also in oversold territory, indicating a possible bounce in price. First resistance in NZD/USD is at 0.6717 and then 0.6813. However, if price continues lower, the first support level for the pair isn’t until 0.6533.

Source: Tradingview, Stone X
USD/CNH has been moving higher for the last 5 trading sessions. As a result, AUD/USD and NZD/USD have been moving lower. Traders can use the correlation coefficient on the lower 240-minute timeframe between USD/CNH and the 2 pairs to help them determine where AUD/USD and NZD/USD may be headed next.
USD/CNH has been on the move as fears of additional lockdowns due to covid grip the markets. Lockdowns could lead to slower production and slower growth. Shanghai is currently entering its fourth week of lockdowns and fears are that Beijing could be next. As a result, the Yuan has sold off, causing USD/CNH to move higher.
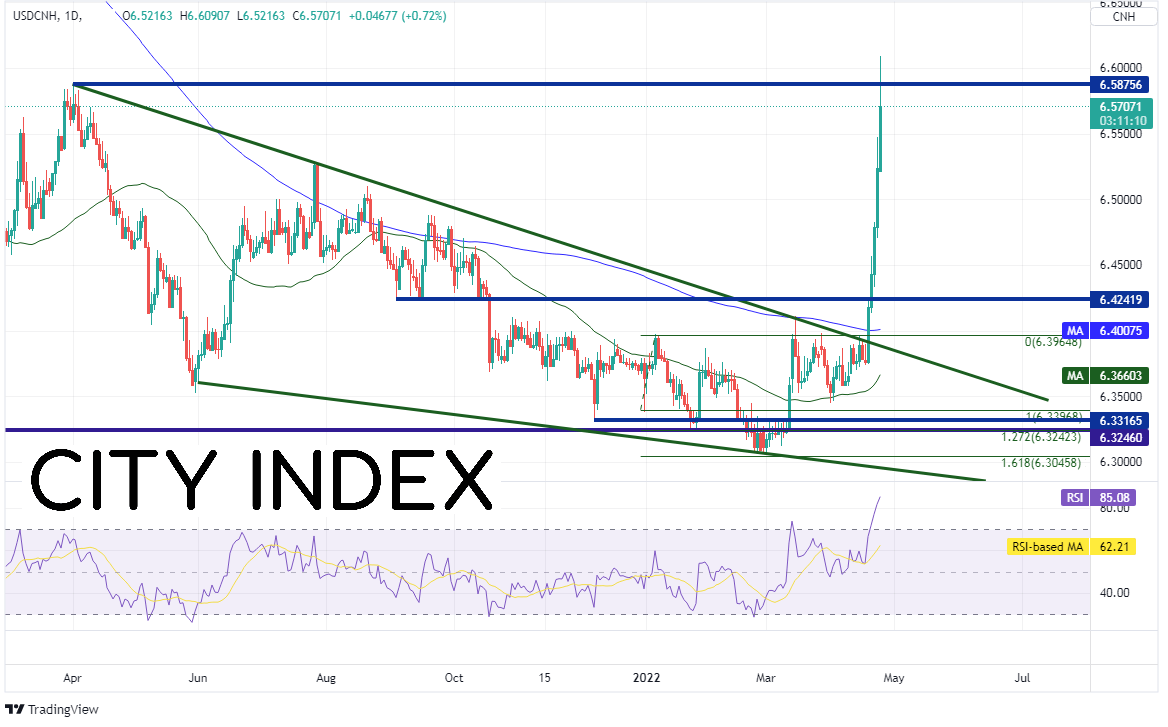
On a daily timeframe, USD/CNH broke out of its descending wedge on April 19th and hasn’t looked back. The target for the breakout of a descending wedge is a 100% retracement of the wedge. The wedge began on April 1, 2021 at 6.5876 and began moving lower. Once price broke above the top trendline of the wedge at 6.3910, it only took 5 days to retracement the whole descending wedge!
Source: Tradingview, Stone X
Trade USD/CNH now: Login or Open a new account!
• Open an account in the UK
• Open an account in Australia
• Open an account in Singapore
If the markets worst fears do turn out to be true and China can’t avoid a longer-term slowdown, Australia and New Zealand are likely to take a hit as well, as they are both large exporters to China.
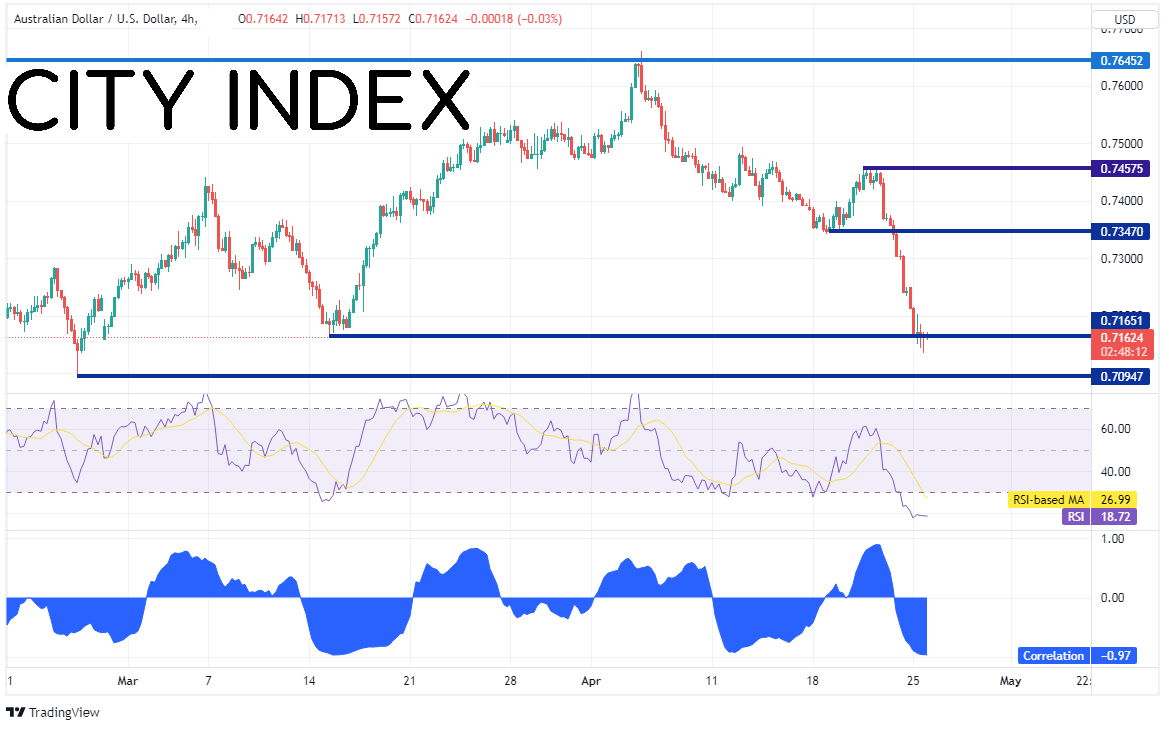
On a 240-minute timeframe, notice at the bottom of the chart that the correlation coefficient between AUD/USD and USD/CNH is -0.97. A reading of -1.00 means that there is a perfect negative correlation. In other words, when one currency pair moves higher, the other moves lower. A reading of -0.97 is extremely close! Therefore, if USD/CNH is ready for a correction, then AUD/USD should move higher. Also notice that the RSI on in oversold territory, an indication that the pair may be ready for a bounce. First resistance isn’t until 0.7347 and then 0.7458. The next support level is at 0.7095.
Source: Tradingview, Stone X
Trade AUD/USD now: Login or Open a new account!
• Open an account in the UK
• Open an account in Australia
• Open an account in Singapore
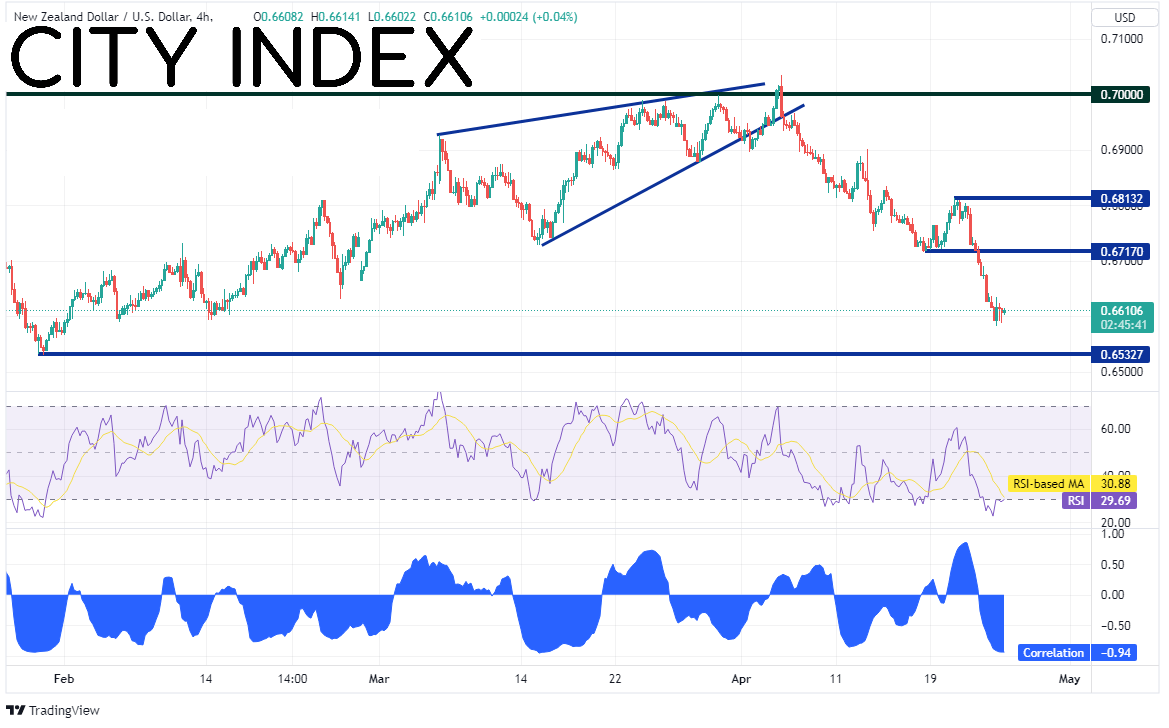
The correlation coefficient between NZD/USD and USD/CNH on a 240-minute timeframe is similar to the one of AUD/USD and USD/CNH at -0.94. Notice that the RSI here is also in oversold territory, indicating a possible bounce in price. First resistance in NZD/USD is at 0.6717 and then 0.6813. However, if price continues lower, the first support level for the pair isn’t until 0.6533.
Source: Tradingview, Stone X
Trade NZD/USD now: Login or Open a new account!
• Open an account in the UK
• Open an account in Australia
• Open an account in Singapore
USD/CNH has been moving higher for the last 5 trading sessions. As a result, AUD/USD and NZD/USD have been moving lower. Traders can use the correlation coefficient on the lower 240-minute timeframe between USD/CNH and the 2 pairs to help them determine where AUD/USD and NZD/USD may be headed next.
Learn more about forex trading opportunities.
Related tags:
Latest market news




Open an account in minutes
Experience award-winning platforms with fast and secure execution, and enjoy tight spreads from 0.5 pts on FX and 0.3 pts on indices.
Economic calendar
Web Trader platform
Our sophisticated web-based platform is packed with features.
Related articles
EUR/USD Forecast: Euro Struggles to Find Support Even After U.S. PCE Data
The euro continues to face a challenging environment in the short term. The currency has struggled to regain ground against a U.S. dollar that remains firmly supported, a dynamic reflected in EUR/USD, which has now recorded three consecutive losing sessions and a decline of roughly 0.6%.
Canadian Dollar Forecast: USD/CAD Four-Week Rally Eyes Yearly Highs 9 30 2026
USD/CAD has advanced in 14 of the past 15 sessions, but stretched momentum raises the stakes as major resistance and NFP come into focus.


British Pound Technical Outlook: GBP/USD Rebound Challenges September Downtrend 9 30 2026
Sterling has rallied sharply from key support, with GBP/USD at an inflection point that could determine whether a larger recovery is underway.
This report is intended for general circulation only. It should not be construed as a recommendation, or an offer (or solicitation of an offer) to buy or sell any financial products. The information provided does not take into account your specific investment objectives, financial situation or particular needs. Before you act on any recommendation that may be contained in this report, independent advice ought to be sought from a financial adviser regarding the suitability of the investment product, taking into account your specific investment objectives, financial situation or particular needs.
StoneX Financial Pte. Ltd., may distribute reports produced by its respective foreign entities or affiliates within the StoneX group of companies or third parties pursuant to an arrangement under Regulation 32C of the Financial Advisers Regulations. Where the report is distributed to a person in Singapore who is not an accredited investor, expert investor or an institutional investor (as defined in the Securities Futures Act), StoneX Financial Pte. Ltd. accepts legal responsibility to such persons for the contents of the report only to the extent required by law. Singapore recipients should contact StoneX Financial Pte. Ltd. at 6826 9988 for matters arising from, or in connection with the report.
In the case of all other recipients of this report, to the extent permitted by applicable laws and regulations neither StoneX Financial Pte. Ltd. nor its associated companies will be responsible or liable for any loss or damage incurred arising out of, or in connection with, any use of the information contained in this report and all such liability is hereby expressly disclaimed. No representation or warranty is made, express or implied, that the content of this report is complete or accurate.
StoneX Financial Pte. Ltd. is not under any obligation to update this report.
Trading CFDs carries a high level of risk that may not be suitable for some investors. Consider your investment objectives, level of experience, financial resources, risk appetite and other relevant circumstances carefully. The possibility exists that you could lose some or all of your investments, including your initial deposits. If in doubt, please seek independent expert advice. Visit www.forex.com/en-sg/terms-and-policies for the complete Risk Disclosure Statement.