



S&P 500 Forecast: SPX Continues to Drift Away from Record Highs
Recent trading sessions have done little to restore confidence in the equity market. Over the last four sessions, the S&P 500 has declined by nearly 1.00%, a move that highlights growing short-term weakness and keeps the index moving further away from its record-high territory.
Share this:

Recent trading sessions have done little to restore confidence in the equity market. Over the last four sessions, the S&P 500 has declined by nearly 1.00%, a move that highlights growing short-term weakness and keeps the index moving further away from its record-high territory.
This development is particularly relevant because it coincides with slowing market activity and increasing caution among investors. For now, selling pressure continues to be supported by the strength of safe-haven assets such as U.S. Treasury bonds and by concerns that the Federal Reserve may maintain a relatively hawkish stance over the coming months. As long as these factors remain in place, downside pressure could continue to influence SPX price action in the sessions ahead.

Short-Term Confidence Remains Under Pressure
Market sentiment toward risk assets continues to show signs of weakness. This is largely driven by the growing appeal of more defensive markets and by ongoing uncertainty surrounding upcoming Federal Reserve decisions, particularly ahead of key releases such as Friday's Nonfarm Payrolls (NFP) report, which measures changes in U.S. employment.
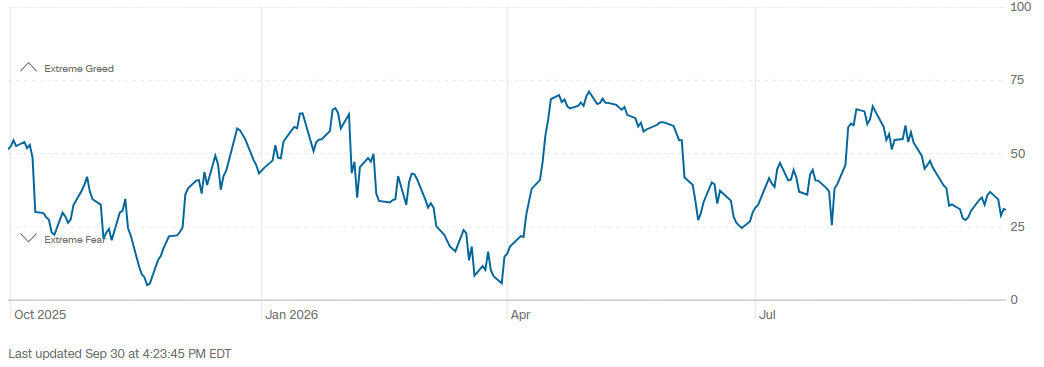
This cautious backdrop is clearly reflected in sentiment indicators such as CNN's Fear & Greed Index, which currently stands near 31 points, moving increasingly closer to the "Extreme Fear" zone. Recent readings have struggled to recover, suggesting that confidence in risk assets remains limited in the short term.
Source: CNN
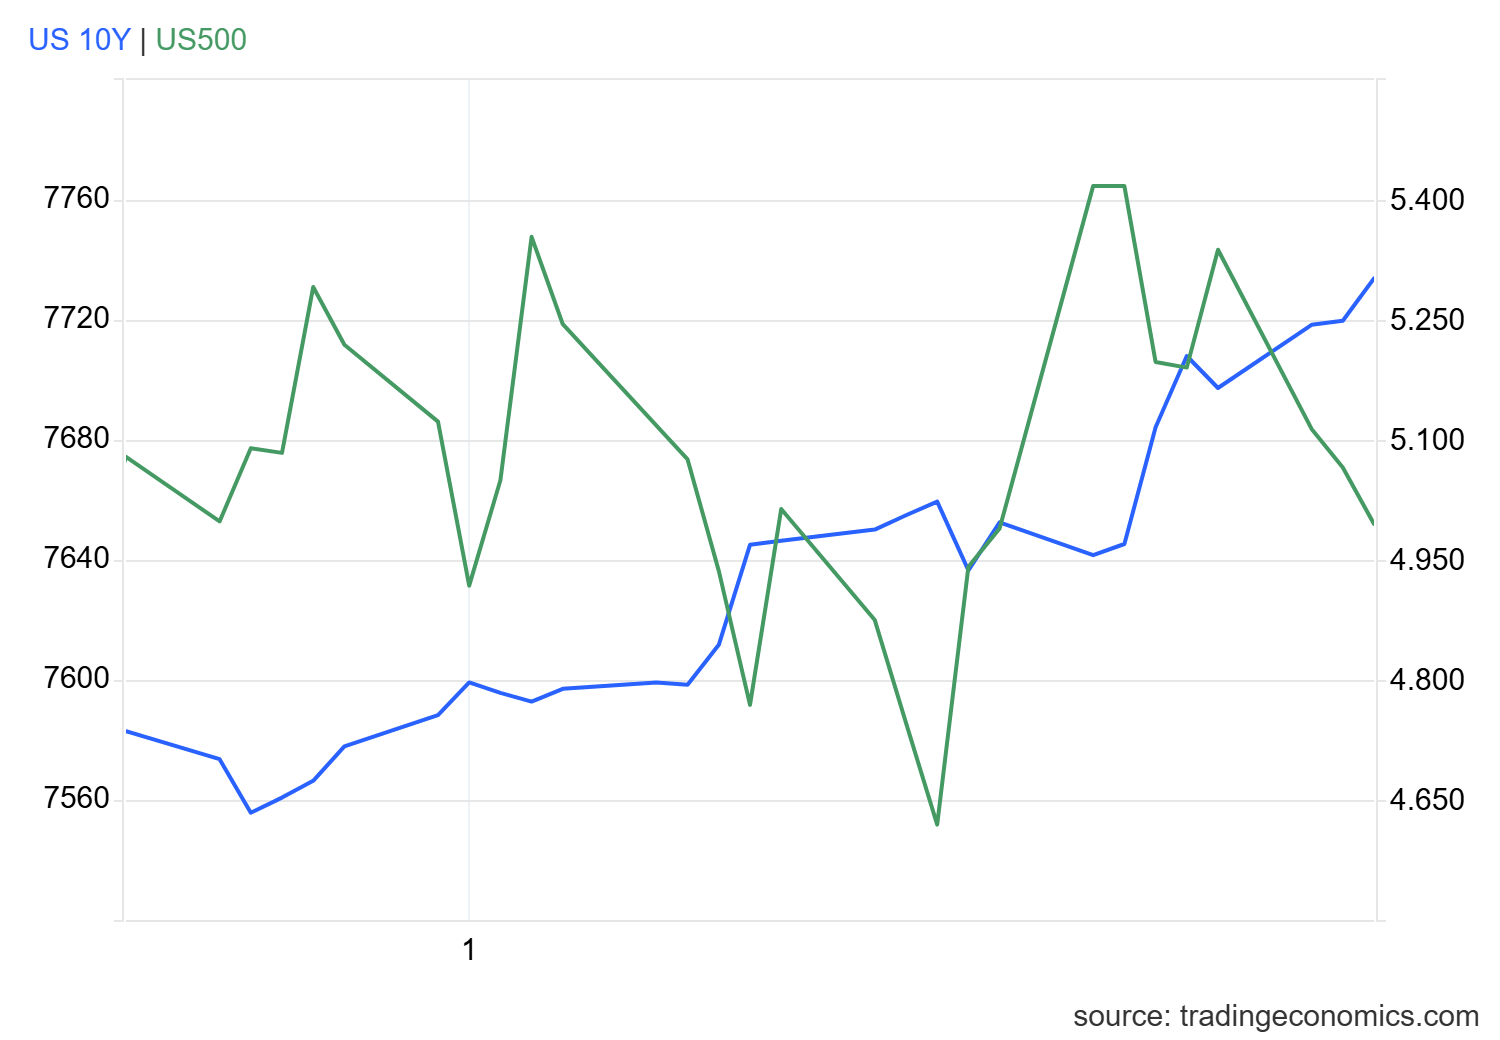
What is particularly important is that this deterioration in sentiment is occurring while bond yields continue to move higher. U.S. 10-year Treasury yields are currently trading slightly above 5.3%, a development that may be encouraging capital flows toward more defensive assets while reducing the relative attractiveness of risk-oriented investments.
Recent sessions have also highlighted an inverse relationship between both markets. As Treasury yields continue to rise, the S&P 500 has gradually lost momentum, reflecting the caution that remains present across equity markets and the growing appeal of fixed-income assets.
Source: TradingEconomics
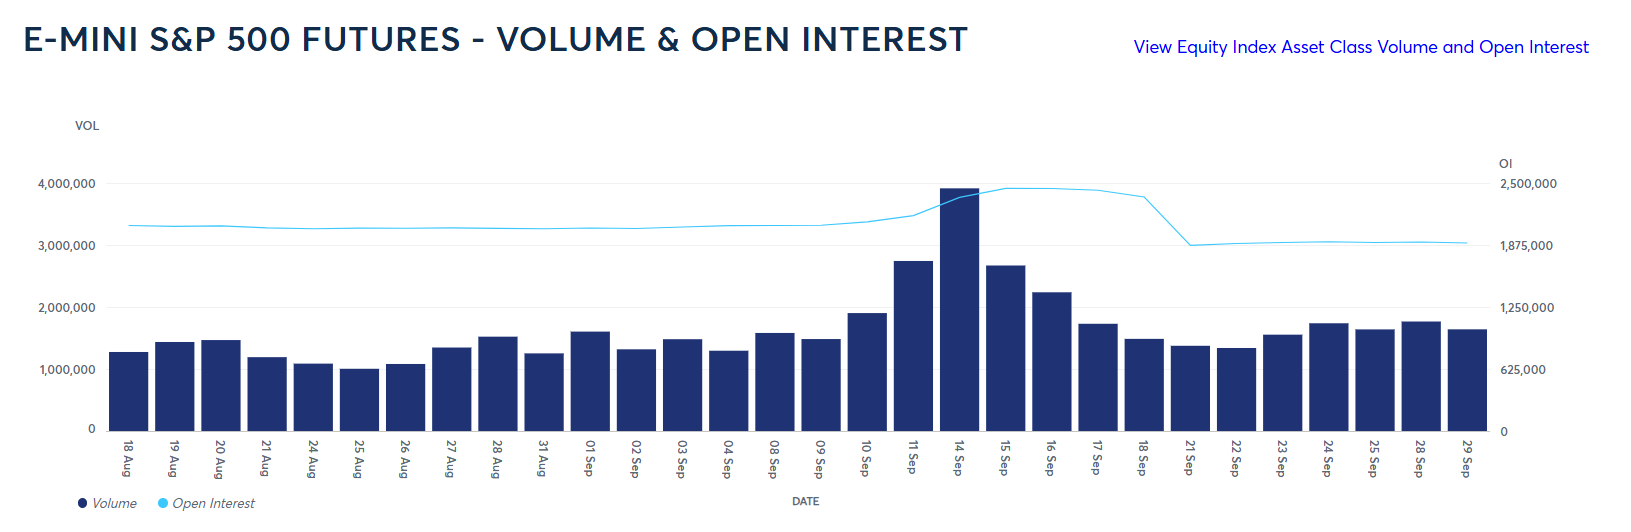
A similar trend can be observed in the E-mini S&P 500 Futures market. Recent data continues to show relatively moderate trading activity. On September 29, approximately 1.6 million contracts were traded, well below the nearly 4 million contracts recorded on September 14.
This decline in activity may reflect a more cautious stance among market participants, potentially linked to concerns surrounding the Federal Reserve and the continued attractiveness of the bond market.
Source: CMEGROUP
Taking all of this into account, demand for the SPX appears to be losing momentum in the short term. This development coincides with weaker confidence readings, caution surrounding the Fed, and rising bond yields. As a result, selling pressure could remain a relevant component of S&P 500 price action over the coming sessions.
S&P 500 Technical Forecast
Source: StoneX, Tradingview
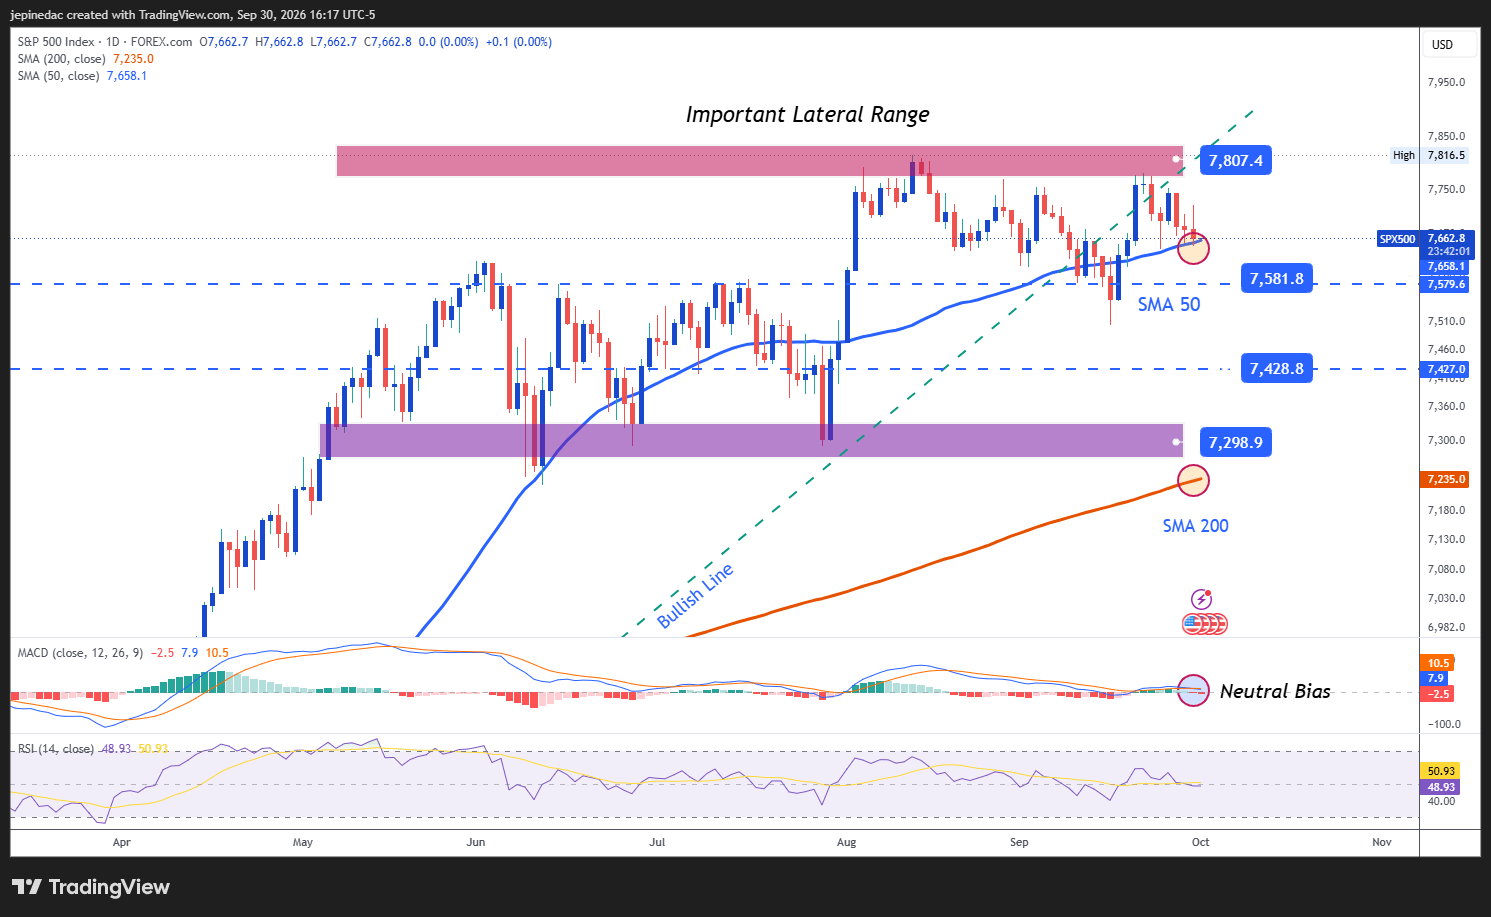
- The trading range remains the dominant structure: For much of 2026, SPX price action has lacked a consistent directional trend, preventing the development of a more established market structure. As a result, the index continues to trade within a broad consolidation range that remains the dominant technical pattern on the daily chart. Unless price can break through the main boundaries of this structure, the current lack of direction could remain a key feature of market behavior in the weeks ahead.
- RSI: Recent RSI readings continue to hover near the 50 neutral level, signaling that the balance between buyers and sellers remains relatively stable over the last 14 sessions. As long as this reading persists, a lack of directional conviction may continue to dominate short-term price action.
- MACD: A similar picture can be observed in the MACD, whose histogram continues to trade very close to the 0 neutral line. This reading reflects balance in short-term moving-average momentum and continues to support the view that the index remains in a consolidation phase.
Key Levels:
- 7,800 Points – Key Resistance: This area corresponds to the index's record highs and remains the most important upside reference on the chart. A move back toward this level could restore a more constructive bullish bias and bring renewed attention to the positive structure observed earlier in the year.
- 7,580 Points – Near-Term Barrier: A level that coincides with the 50-period simple moving average and with important retracement zones observed in previous weeks. As long as price action remains close to this area, the current neutral tone could persist and continue supporting the broad trading range that dominates the chart.
- 7,420 Points – Key Support: An area aligned with important lows observed over recent months and currently the most significant downside reference on the chart. Price action moving toward this level could reinforce a more dominant bearish bias and potentially open the door to the formation of a short-term downtrend.
Written by Julian Pineda, CFA, CMT – Market Analyst
Follow him on: @julianpineda25



Open an account in minutes
Experience award-winning platforms with fast and secure execution, and enjoy tight spreads from 0.5 pts on FX and 0.3 pts on indices.
Economic calendar
Web Trader platform
Our sophisticated web-based platform is packed with features.
Related articles

Dow Jones forecast: Stock markets under pressure from multiple sources
When looking at the major tech-heavy US indices like the S&P 500 or the Nasdaq 100, you wouldn’t think that the stock market is particularly weak. Yet, beneath the surface, the market is far from healthy right now. Investors are evidently just piling into the big tech and AI names, and as a result, market breadth is deteriorating. Other indices like the small cap Russell 2000 and the Dow Jones are starting to reflect that weakness.


Nikkei breakout accelerates as yen weakness returns
Nikkei has started October with a powerful breakout, helped by renewed yen weakness and strong upside momentum


S&P 500 Forecast: SPX Continues to Drift Away from Record Highs
Recent trading sessions have done little to restore confidence in the equity market. Over the last four sessions, the S&P 500 has declined by nearly 1.00%, a move that highlights growing short-term weakness and keeps the index moving further away from its record-high territory.
This report is intended for general circulation only. It should not be construed as a recommendation, or an offer (or solicitation of an offer) to buy or sell any financial products. The information provided does not take into account your specific investment objectives, financial situation or particular needs. Before you act on any recommendation that may be contained in this report, independent advice ought to be sought from a financial adviser regarding the suitability of the investment product, taking into account your specific investment objectives, financial situation or particular needs.
StoneX Financial Pte. Ltd., may distribute reports produced by its respective foreign entities or affiliates within the StoneX group of companies or third parties pursuant to an arrangement under Regulation 32C of the Financial Advisers Regulations. Where the report is distributed to a person in Singapore who is not an accredited investor, expert investor or an institutional investor (as defined in the Securities Futures Act), StoneX Financial Pte. Ltd. accepts legal responsibility to such persons for the contents of the report only to the extent required by law. Singapore recipients should contact StoneX Financial Pte. Ltd. at 6826 9988 for matters arising from, or in connection with the report.
In the case of all other recipients of this report, to the extent permitted by applicable laws and regulations neither StoneX Financial Pte. Ltd. nor its associated companies will be responsible or liable for any loss or damage incurred arising out of, or in connection with, any use of the information contained in this report and all such liability is hereby expressly disclaimed. No representation or warranty is made, express or implied, that the content of this report is complete or accurate.
StoneX Financial Pte. Ltd. is not under any obligation to update this report.
Trading CFDs carries a high level of risk that may not be suitable for some investors. Consider your investment objectives, level of experience, financial resources, risk appetite and other relevant circumstances carefully. The possibility exists that you could lose some or all of your investments, including your initial deposits. If in doubt, please seek independent expert advice. Visit www.forex.com/en-sg/terms-and-policies for the complete Risk Disclosure Statement.