


US dollar outlook: Nasdaq breakdown raises stakes for EUR/USD, USD/JPY
A potential Democratic sweep of Congress is adding to the AI trade's headaches, with Nasdaq 100 futures breaking below a major technical level. The implications for the dollar could be significant.
Share this:

- Democratic sweep expectations threaten AI sentiment
- Nasdaq threatens breakdown through key level
- US dollar correlations with yields, tech persist
- EUR/USD upside builds, USD/JPY remains rangebound
The US dollar is coming under pressure during Asian trade as prediction markets move sharply towards the prospect of Democrats securing a clean sweep of Congress in the midterm elections. The perception that Democratic control could create a less AI-friendly policy environment is weighing on Nasdaq 100 futures, with the knock-on effects extending to Treasury yields and the dollar. As we've seen repeatedly in recent weeks, AI sentiment has become closely tied to perceptions of the US nominal growth outlook, leaving the dollar particularly sensitive to shifts in tech stocks and bond yields.
Democratic sweep expectations surge
Prediction markets are swinging sharply in favour of a Democratic clean sweep of Congress as US midterm election voting closes, with Polymarket pricing climbing above 90%, up from 75% before the vote. That's been replicated in the probability of the Senate flipping blue, with Democratic control now priced above 90%, while the House is almost a lock. And we're not talking about small sums being wagered here, with nearly $1.5 billion bet across prediction platforms, according to Reuters.
The concern for markets is that a Democrat-controlled Congress could usher in a less AI-friendly environment, with tighter regulation and greater scrutiny of the enormous sums being poured into data centres potentially slowing the pace of the buildout. That's hardly welcome news for a sector already facing growing questions about the cost of the AI boom and whether the returns will justify the investment.
Nasdaq breaks the line
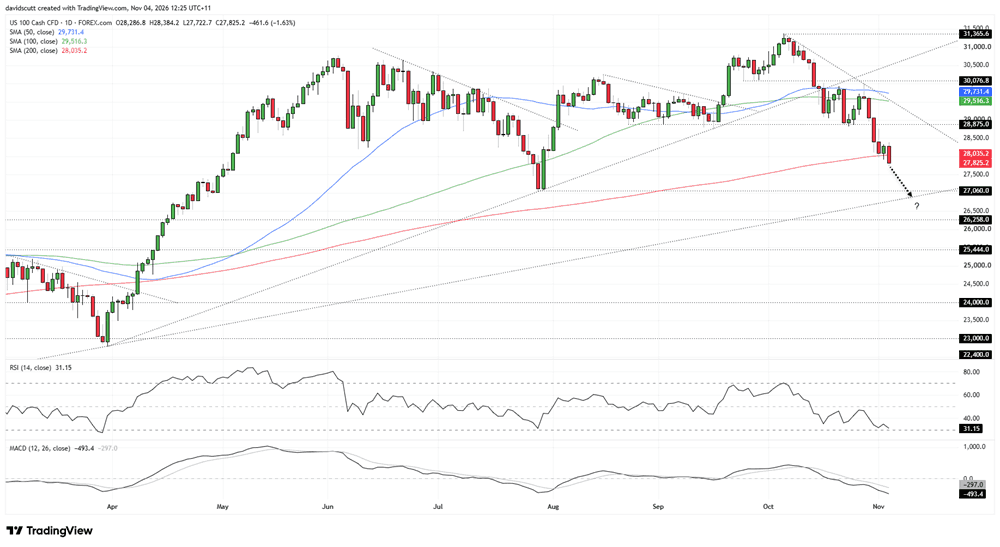
Already sitting in a strong downtrend, our Nasdaq 100 contract has sliced decisively through the 200-day moving average it had been testing over the previous two sessions during Asian trade on Wednesday, extending the rout from the record high set in early October. RSI (14) continues to set lower lows, indicating downside pressure is building, while MACD confirms the move, pulling further away from its signal line in negative territory.
Source: TradingView
The break raises the risk that the index is embarking on a new bearish trend, bringing the July swing low at 27,060 into focus. That level also coincides with long-term uptrend support drawn from the April 2025 Liberation Day lows. Not only is the 200-day moving average now the key level to watch overhead for anyone trading the contract, but it could also go a long way towards determining the outlook for the US dollar and Treasury yields, given the strong relationship we've seen recently between AI sentiment and US nominal growth expectations.
The dollar's AI connection
Source: LSEG
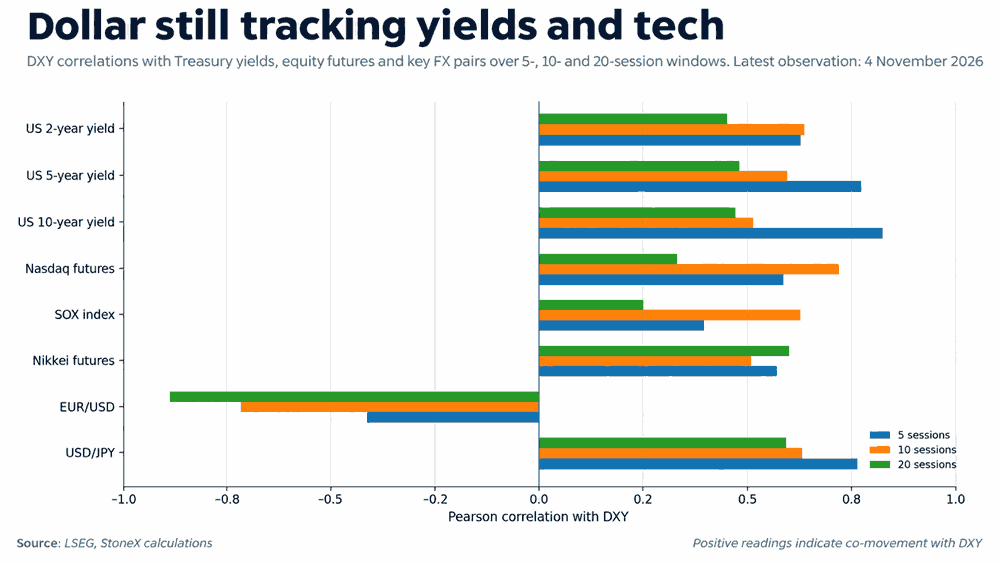
That relationship is evident in the correlation analysis above, with the US dollar index recording positive correlations of 0.82 with US ten-year Treasury yields and 0.59 with Nasdaq 100 futures over the past five sessions. The relationship has also been persistent across longer time horizons, not only between the dollar, Treasury yields and tech stocks, but also in the dollar's relationship with EUR/USD and USD/JPY, as we'll explore shortly.
Source: TradingView
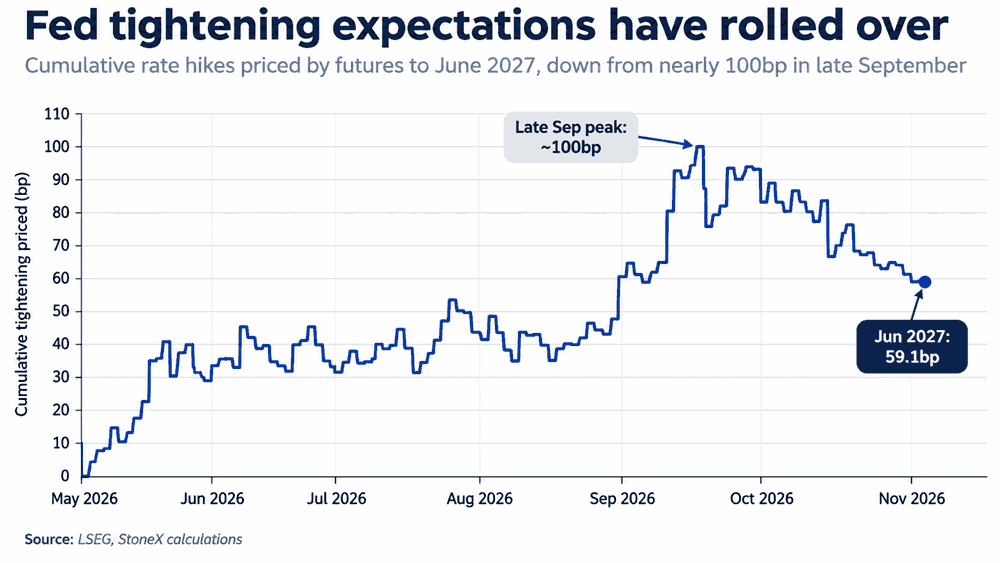
The AI wobbles have clearly had an impact on expectations for how much tightening the Federal Reserve will deliver over the next year, with markets now anticipating around 60 basis points of hikes by mid-2027, down from nearly 100 basis points just weeks ago. With the dollar closely tracking Treasury yields and tech stocks, that repricing adds another headwind for the greenback should it persist.
EUR/USD eyes a breakout
Source: TradingView
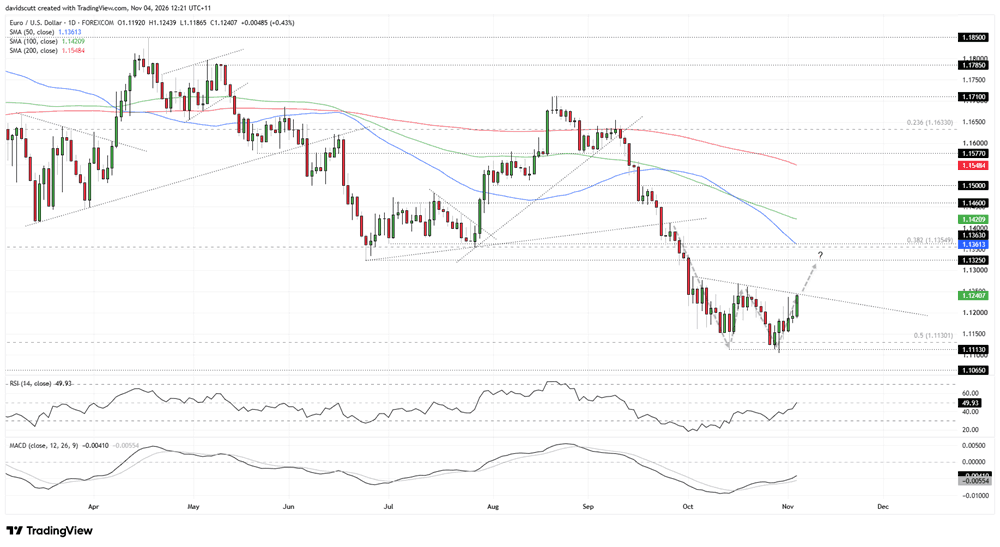
With deteriorating tech sentiment putting pressure on the US dollar, EUR/USD is now threatening to break the minor downtrend in place since the highs set in early October, located around 1.1250 today. The coiling price action heading into this test points to the risk of a topside breakout, potentially opening the door to a push towards 1.1325, the swing low set on June 24.
RSI (14) is on the cusp of moving above the neutral 50 level and continues to set higher lows, while MACD has staged a bullish crossover and is pulling further away from its signal line, although it remains in negative territory. Despite the challenges facing the euro area from energy insecurity and imported inflation, the deterioration in AI sentiment has been enough to push EUR/USD higher, underlining just how much influence the US side of the equation is having on the pair.
If EUR/USD breaks above the minor downtrend, longs could be established with a tight stop below for protection, targeting 1.1325. A backtest and bounce from the broken trendline would be preferred before entry, adding conviction to the setup. If the pair fails to break higher, it could instead point to a retest of the lower end of the range at 1.1113, where buyers have stepped in on each of the past three tests.
USD/JPY stuck on the tracks
Source: TradingView
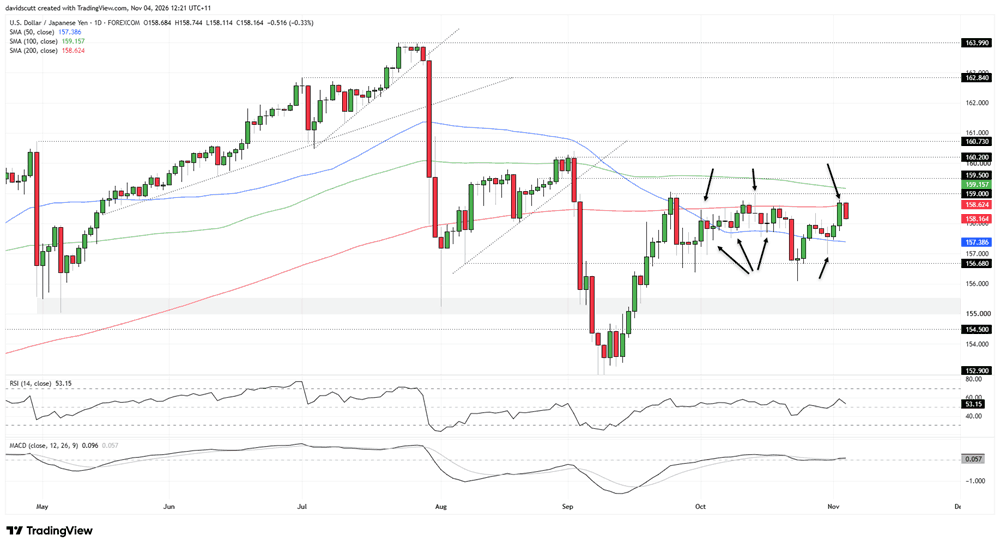
While upside risks for EUR/USD may be building this week, USD/JPY remains trapped between the train tracks, with resistance capping moves above the 200-day moving average, shown in red, and bids emerging beneath the 50-day moving average in blue. That's the immediate range to focus on, given how much time the pair has spent trading between the two over the past month, interrupted only by a fleeting downside break in late October.
Above the 200-day moving average, the upper end of the range in place since mid-September sits at 159, reinforced by the 100-day moving average just overhead at 159.15. Beyond that, 159.50 and 160.20 are other levels of note. Beneath the 50-day moving average, 157 marks where the pair bounced last Friday, followed by more pronounced support at 156.68, where buyers have repeatedly stepped in during the second half of this year.
While downside risks have diminished based on signals from RSI (14) and MACD, the broader message remains neutral, putting greater emphasis on price action. If the breakdown in the Nasdaq 100 sticks, it could add to downside risks for USD/JPY given its relationship with US growth expectations and Treasury yields. However, it's still too early to declare that a sustained move lower is underway.
Latest market news




Open an account in minutes
Experience award-winning platforms with fast and secure execution, and enjoy tight spreads from 0.5 pts on FX and 0.3 pts on indices.
Economic calendar
Web Trader platform
Our sophisticated web-based platform is packed with features.
Related articles
US dollar outlook: Nasdaq breakdown raises stakes for EUR/USD, USD/JPY
A potential Democratic sweep of Congress is adding to the AI trade's headaches, with Nasdaq 100 futures breaking below a major technical level. The implications for the dollar could be significant.
Yen Weakness Fuels USD/JPY and EUR/JPY Breakouts Ahead of Midterms
Yen weakness drives USD/JPY and EUR/JPY higher despite intervention risks, with traders eyeing 160 and 180 as US midterm results emerge.

US Dollar Short-term Outlook: USD Rally on the Line as Midterms, NFP Loom 11 3 2026
DXY is testing pivotal support, with the weekly range breakout likely to determine the next major leg of the trend as key event risk unfolds.

This report is intended for general circulation only. It should not be construed as a recommendation, or an offer (or solicitation of an offer) to buy or sell any financial products. The information provided does not take into account your specific investment objectives, financial situation or particular needs. Before you act on any recommendation that may be contained in this report, independent advice ought to be sought from a financial adviser regarding the suitability of the investment product, taking into account your specific investment objectives, financial situation or particular needs.
StoneX Financial Pte. Ltd., may distribute reports produced by its respective foreign entities or affiliates within the StoneX group of companies or third parties pursuant to an arrangement under Regulation 32C of the Financial Advisers Regulations. Where the report is distributed to a person in Singapore who is not an accredited investor, expert investor or an institutional investor (as defined in the Securities Futures Act), StoneX Financial Pte. Ltd. accepts legal responsibility to such persons for the contents of the report only to the extent required by law. Singapore recipients should contact StoneX Financial Pte. Ltd. at 6826 9988 for matters arising from, or in connection with the report.
In the case of all other recipients of this report, to the extent permitted by applicable laws and regulations neither StoneX Financial Pte. Ltd. nor its associated companies will be responsible or liable for any loss or damage incurred arising out of, or in connection with, any use of the information contained in this report and all such liability is hereby expressly disclaimed. No representation or warranty is made, express or implied, that the content of this report is complete or accurate.
StoneX Financial Pte. Ltd. is not under any obligation to update this report.
Trading CFDs carries a high level of risk that may not be suitable for some investors. Consider your investment objectives, level of experience, financial resources, risk appetite and other relevant circumstances carefully. The possibility exists that you could lose some or all of your investments, including your initial deposits. If in doubt, please seek independent expert advice. Visit www.forex.com/en-sg/terms-and-policies for the complete Risk Disclosure Statement.