






Aussie profit taking ahead of year end AUDUSD AUDJPY
After a large move in the Aussie this year, it may be time to take some profits ahead of year end.
Share this:

After a large move in the Australian Dollar this year, it may be time to take some profits ahead of year end. Markets could be very slow this week, barring any headline risk. However, with less participation in the markets due to the year end holidays, any moves that we do see have the possibility to be exaggerated, especially as we get closer to December 31st. If one is concerned about such volatility, he or she may want to consider taking some profits in Aussie before year end.
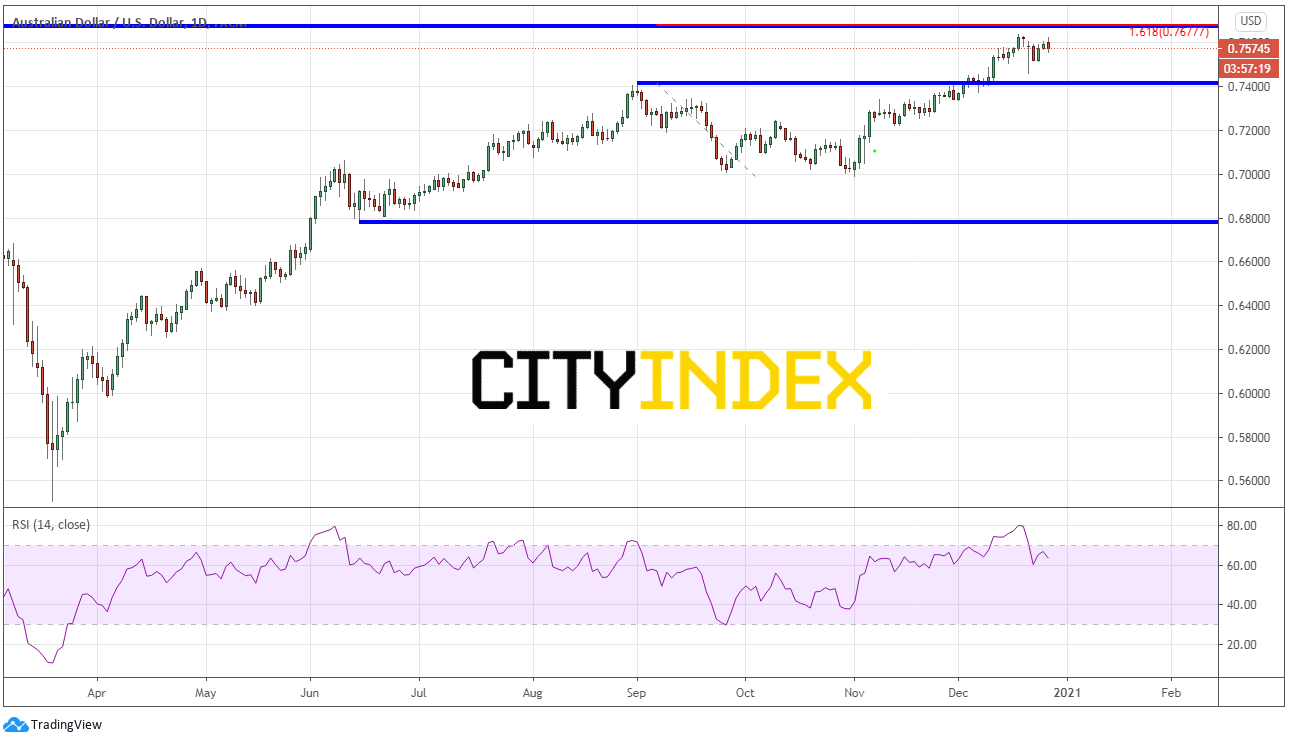
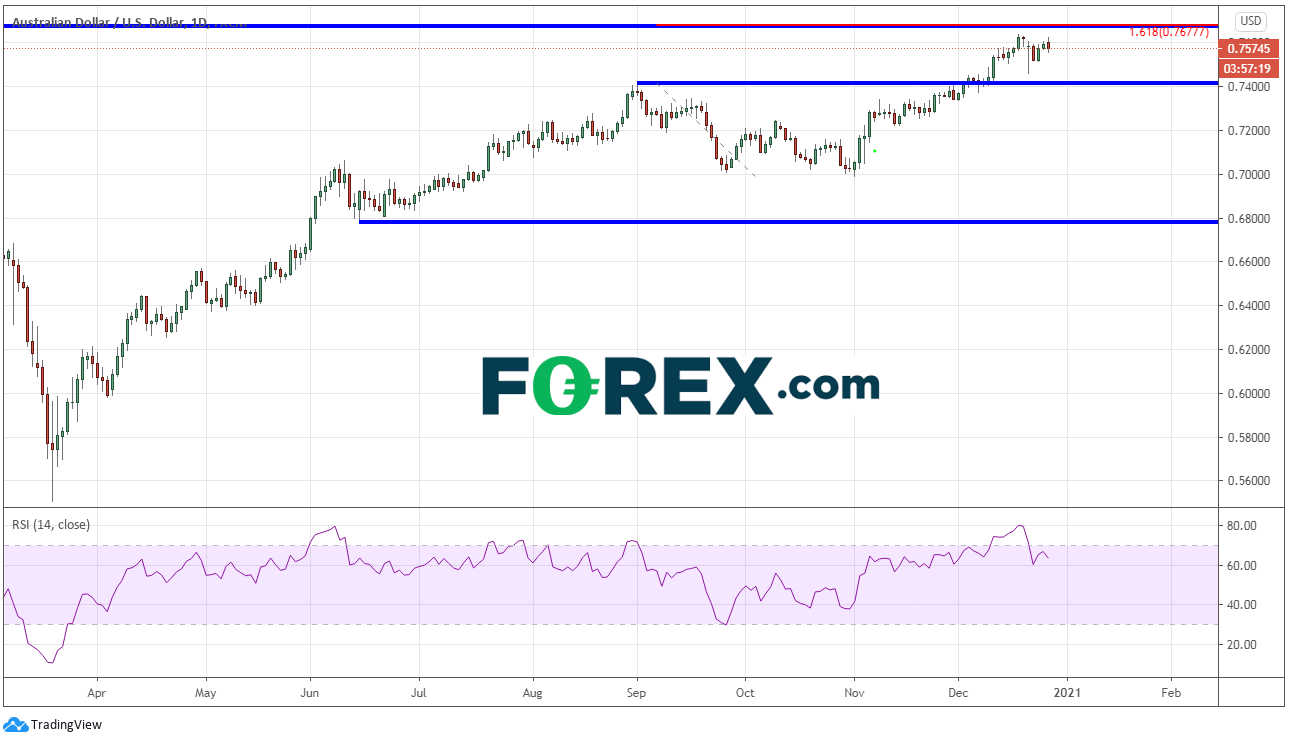
On March 19th, AUD/USD put in a low near 0.5506 and hasn’t looked back since. The pair reached a high of 0.7639 on December 17th and had pulled back slightly to 0.7461 before bouncing again to current levels near 0.7570. If traders who are long AUD/USD are worried about year-end risk, current levels may be a place to take some profits.
A daily chart shows that the pair is nearing resistance at the December 17th highs, as well as horizontal resistance just above from June 2018 near 0.7677. That same level also coincides with the 161.8% Fibonacci extension from the highs of September 1st to the lows of November 2nd.
Source: Tradingview, City Index
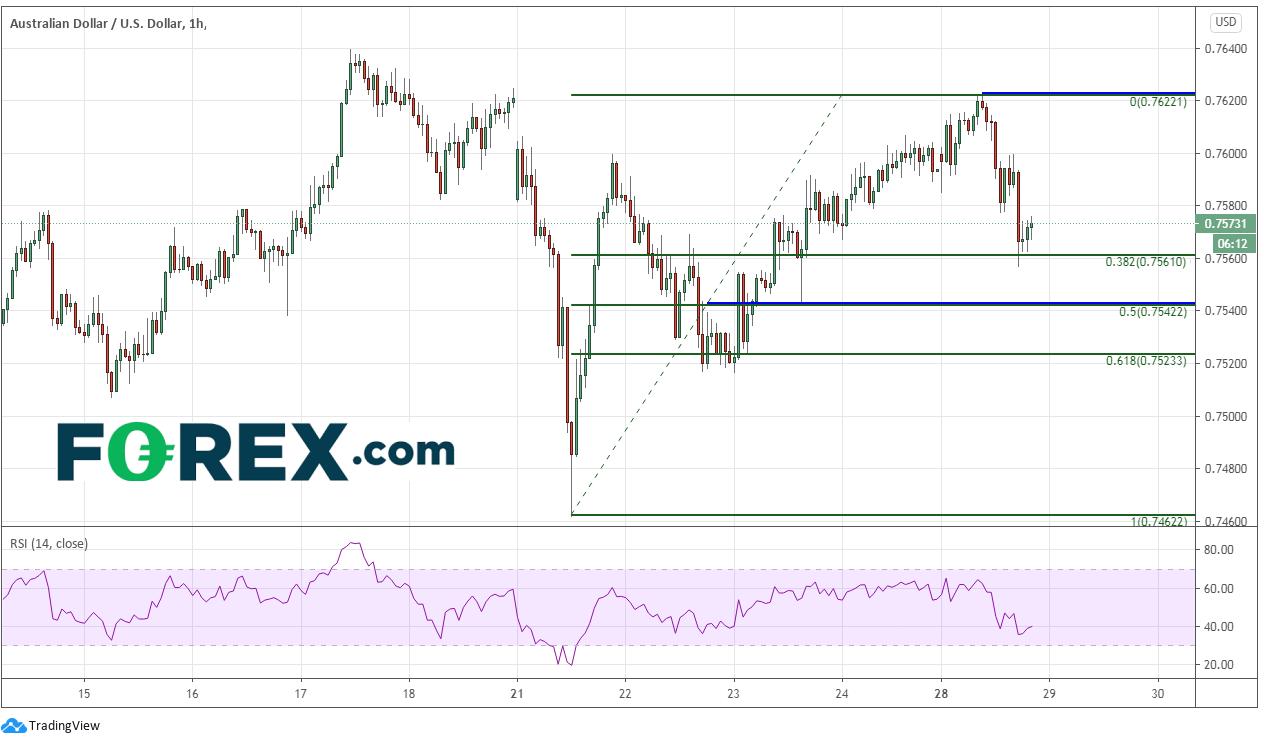
On a 60-minute timeframe, AUD/USD could not take out the highs of December 17th near 0.7640 and has pulled back to the 38.2% Fibonacci retracement from the lows of December 21st to todays highs, near 0.7561. Watch for bounces to 0.7580/0.7600 to be sold. Additional support below at horizontal support and the 50% retracement level from the same timeframe is near 0.7523. The 61.8% Fibonacci retracement level comes in near 0.7523.
Source: Tradingview, City Index
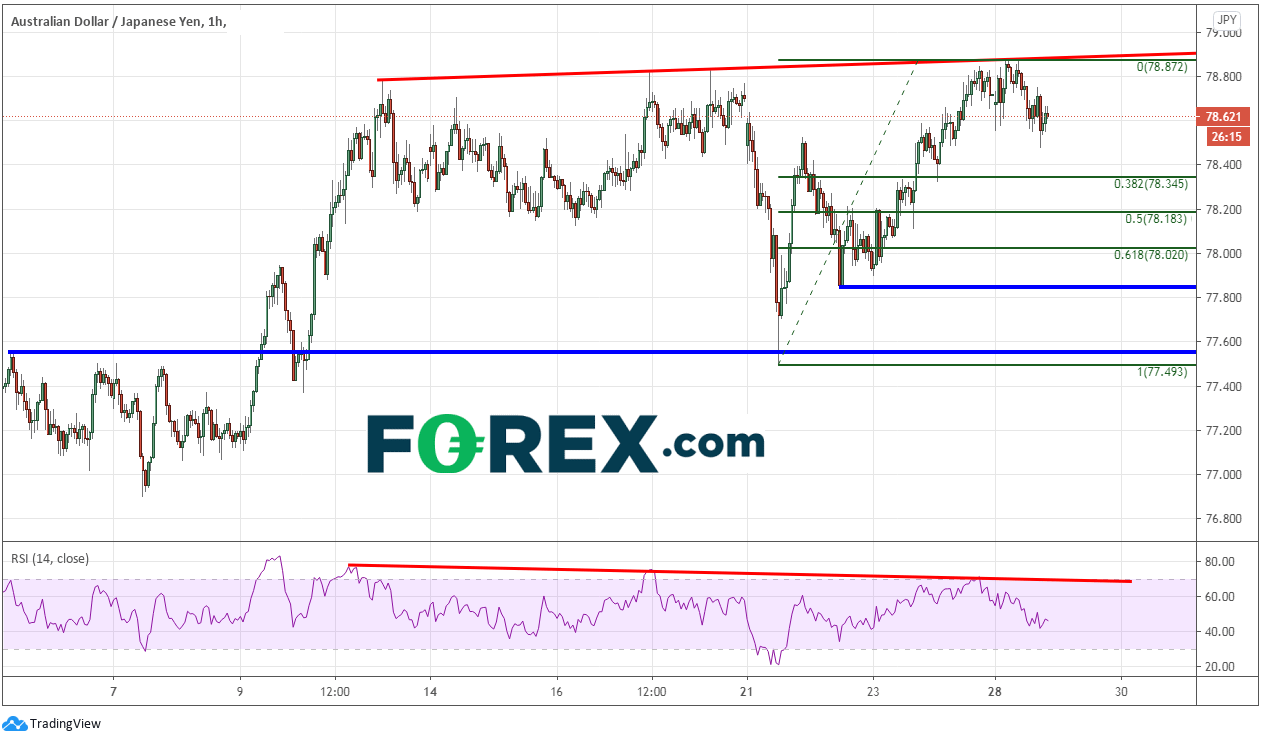
AUD/JPY has been moving in a similar pattern as AUD/USD since putting in lows on March 19th near 59.89. The pair rallied to new yearly highs today of 78.88. Since November 2nd, price has been rising in an ascending wedge pattern and is nearing the apex. If price breaks lower, the target for an ascending wedge is a 100% retracement of the wedge, which in this case is near 73.13. Long term resistance is above near 80.00.
Source: Tradingview, City Index
On a 60-minute timeframe, price has put in 3 higher highs while the RSI has put in 3 lower highs. This is an indication of a potential reversal in price. If price does move lower, support is at the 38.2% Fibonacci retracement level near 78.34, the 50% retracement level near 78.18 and the 61.8% Fibonacci retracement level near 78.02.
Source: Tradingview, City Index
If traders are concerned about year-end headline risk and are comfortably in the money on some Aussie pairs, current levels offer a nice reward if one is long from levels much lower!
Learn more about forex trading opportunities.
After a large move in the Australian Dollar this year, it may be time to take some profits ahead of year end. Markets could be very slow this week, barring any headline risk. However, with less participation in the markets due to the year end holidays, any moves that we do see have the possibility to be exaggerated, especially as we get closer to December 31st. If one is concerned about such volatility, he or she may want to consider taking some profits in Aussie before year end.
On March 19th, AUD/USD put in a low near 0.5506 and hasn’t looked back since. The pair reached a high of 0.7639 on December 17th and had pulled back slightly to 0.7461 before bouncing again to current levels near 0.7570. If traders who are long AUD/USD are worried about year-end risk, current levels may be a place to take some profits.
A daily chart shows that the pair is nearing resistance at the December 17th highs, as well as horizontal resistance just above from June 2018 near 0.7677. That same level also coincides with the 161.8% Fibonacci extension from the highs of September 1st to the lows of November 2nd.
Source: Tradingview, FOREX.com
On a 60-minute timeframe, AUD/USD could not take out the highs of December 17th near 0.7640 and has pulled back to the 38.2% Fibonacci retracement from the lows of December 21st to todays highs, near 0.7561. Watch for bounces to 0.7580/0.7600 to be sold. Additional support below at horizontal support and the 50% retracement level from the same timeframe is near 0.7523. The 61.8% Fibonacci retracement level comes in near 0.7523.
Source: Tradingview, FOREX.com
AUD/JPY has been moving in a similar pattern as AUD/USD since putting in lows on March 19th near 59.89. The pair rallied to new yearly highs today of 78.88. Since November 2nd, price has been rising in an ascending wedge pattern and is nearing the apex. If price breaks lower, the target for an ascending wedge is a 100% retracement of the wedge, which in this case is near 73.13. Long term resistance is above near 80.00.
Source: Tradingview, FOREX.com
On a 60-minute timeframe, price has put in 3 higher highs while the RSI has put in 3 lower highs. This is an indication of a potential reversal in price. If price does move lower, support is at the 38.2% Fibonacci retracement level near 78.34, the 50% retracement level near 78.18 and the 61.8% Fibonacci retracement level near 78.02.
Source: Tradingview, FOREX.com
If traders are concerned about year-end headline risk and are comfortably in the money on some Aussie pairs, current levels offer a nice reward if one is long from levels much lower!
Learn more about forex trading opportunities.
Latest market news




Open an account in minutes
Experience award-winning platforms with fast and secure execution, and enjoy tight spreads from 0.5 pts on FX and 0.3 pts on indices.
Economic calendar
Web Trader platform
Our sophisticated web-based platform is packed with features.
Related articles
Japanese Yen Outlook: USD/JPY, GBP/JPY, AUD/JPY Setups
USD/JPY and GBP/JPY show signs of stabilising, while AUD/JPY remains vulnerable as yen crosses deliver mixed technical signals.
EUR/USD Forecast: Euro Struggles to Find Support Even After U.S. PCE Data
The euro continues to face a challenging environment in the short term. The currency has struggled to regain ground against a U.S. dollar that remains firmly supported, a dynamic reflected in EUR/USD, which has now recorded three consecutive losing sessions and a decline of roughly 0.6%.

Canadian Dollar Forecast: USD/CAD Four-Week Rally Eyes Yearly Highs 9 30 2026
USD/CAD has advanced in 14 of the past 15 sessions, but stretched momentum raises the stakes as major resistance and NFP come into focus.

This report is intended for general circulation only. It should not be construed as a recommendation, or an offer (or solicitation of an offer) to buy or sell any financial products. The information provided does not take into account your specific investment objectives, financial situation or particular needs. Before you act on any recommendation that may be contained in this report, independent advice ought to be sought from a financial adviser regarding the suitability of the investment product, taking into account your specific investment objectives, financial situation or particular needs.
StoneX Financial Pte. Ltd., may distribute reports produced by its respective foreign entities or affiliates within the StoneX group of companies or third parties pursuant to an arrangement under Regulation 32C of the Financial Advisers Regulations. Where the report is distributed to a person in Singapore who is not an accredited investor, expert investor or an institutional investor (as defined in the Securities Futures Act), StoneX Financial Pte. Ltd. accepts legal responsibility to such persons for the contents of the report only to the extent required by law. Singapore recipients should contact StoneX Financial Pte. Ltd. at 6826 9988 for matters arising from, or in connection with the report.
In the case of all other recipients of this report, to the extent permitted by applicable laws and regulations neither StoneX Financial Pte. Ltd. nor its associated companies will be responsible or liable for any loss or damage incurred arising out of, or in connection with, any use of the information contained in this report and all such liability is hereby expressly disclaimed. No representation or warranty is made, express or implied, that the content of this report is complete or accurate.
StoneX Financial Pte. Ltd. is not under any obligation to update this report.
Trading CFDs carries a high level of risk that may not be suitable for some investors. Consider your investment objectives, level of experience, financial resources, risk appetite and other relevant circumstances carefully. The possibility exists that you could lose some or all of your investments, including your initial deposits. If in doubt, please seek independent expert advice. Visit www.forex.com/en-sg/terms-and-policies for the complete Risk Disclosure Statement.