



Japanese Yen Outlook: USD/JPY, GBP/JPY, AUD/JPY Setups
USD/JPY and GBP/JPY show signs of stabilising, while AUD/JPY remains vulnerable as yen crosses deliver mixed technical signals.
Share this:

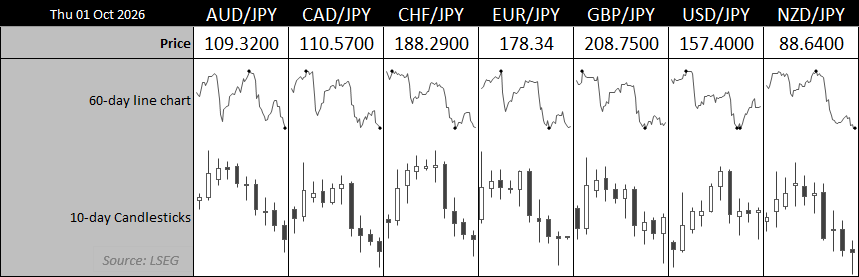
Japanese yen crosses are sending mixed technical signals. USD/JPY and GBP/JPY are showing signs of stabilising after recent declines, although both still face nearby resistance. AUD/JPY looks less convincing, with downside momentum keeping the March low and lower support levels in focus.
View related analysis:
Japanese Yen Setups Diverge Across USD/JPY, GBP/JPY and AUD/JPY
USD/JPY Technical Analysis: US Dollar vs Japanese Yen
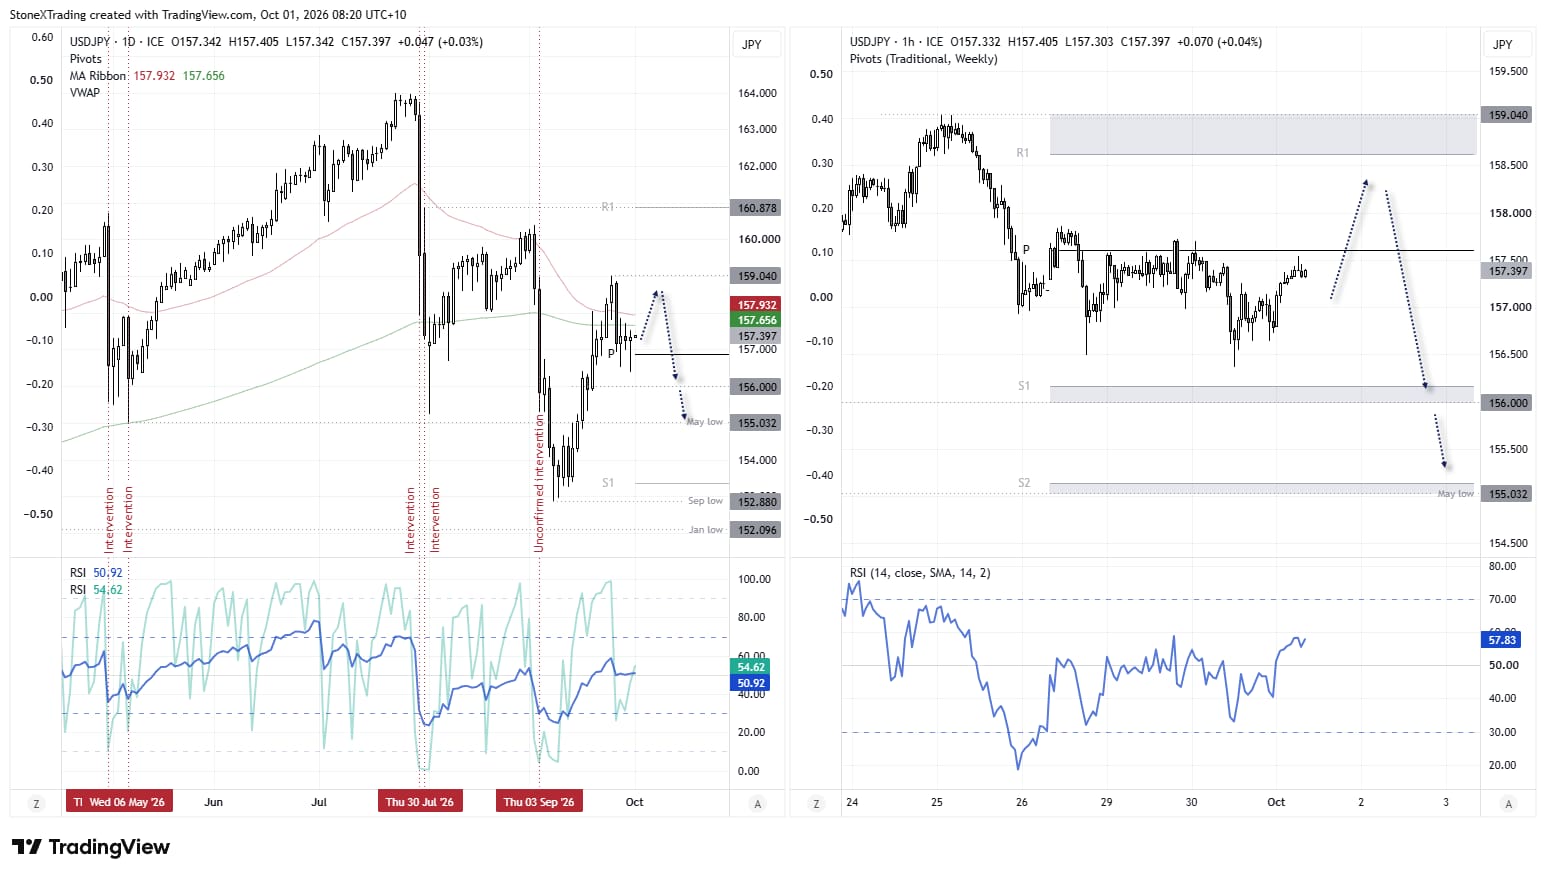
Friday’s bearish engulfing day suggests a near-term top is in place, though price action this week also suggests USD/JPY could recoup some of Friday’s losses. Three dojis have since formed, two with lower wicks to show demand above 156 and around the monthly pivot point.
The 200-day EMA and 50-day EMA are capping prices as resistance, so we could be in for some scrappy trade. And there may not be an immediate rush to get involved. Instead, recent price action could serve as a warning for bears to step aside and wait for a better opportunity.
Ideally, we’ll see evidence of a lower high relative to Thursday’s high just above 158. The 156 handle and May low at 155.03 are potential downside targets, a break beneath which brings the monthly S1 pivot into focus near the September low.
Source: ICE, TradingView

GBP/JPY Technical Analysis: British Pound vs Japanese Yen
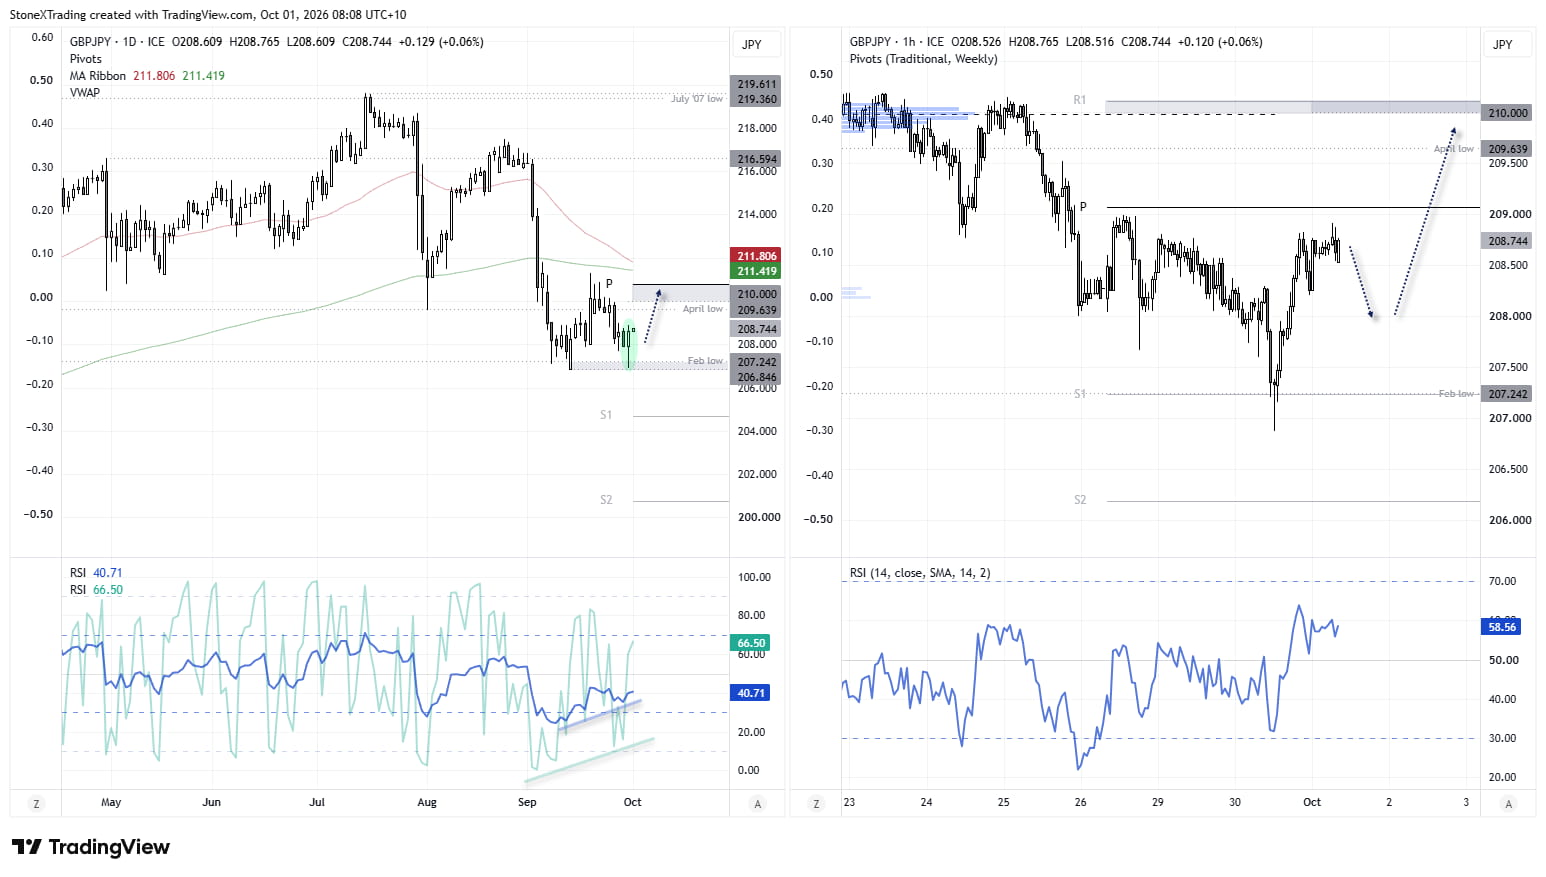
A bullish outside day formed on Wednesday to hint at a swing low. The fact that it occurred around the February and September lows adds to the near-term bullish case. Also note that the monthly S2 pivot is nearby for additional support.
The 1-hour chart shows that the rally has stalled just beneath the weekly pivot point, so perhaps a pullback is due. Bulls could seek dips within yesterday’s range while prices hold above 206.85. As this is a countertrend move, conservative upside targets seem more appropriate unless a decent bullish catalyst arrives.
The April low at 209.64 and the 210 handle - near the weekly R1 pivot and high-volume node - are potential upside targets for bulls over the near term.
Source: ICE, TradingView
AUD/JPY Technical Analysis: Australian Dollar vs Japanese Yen
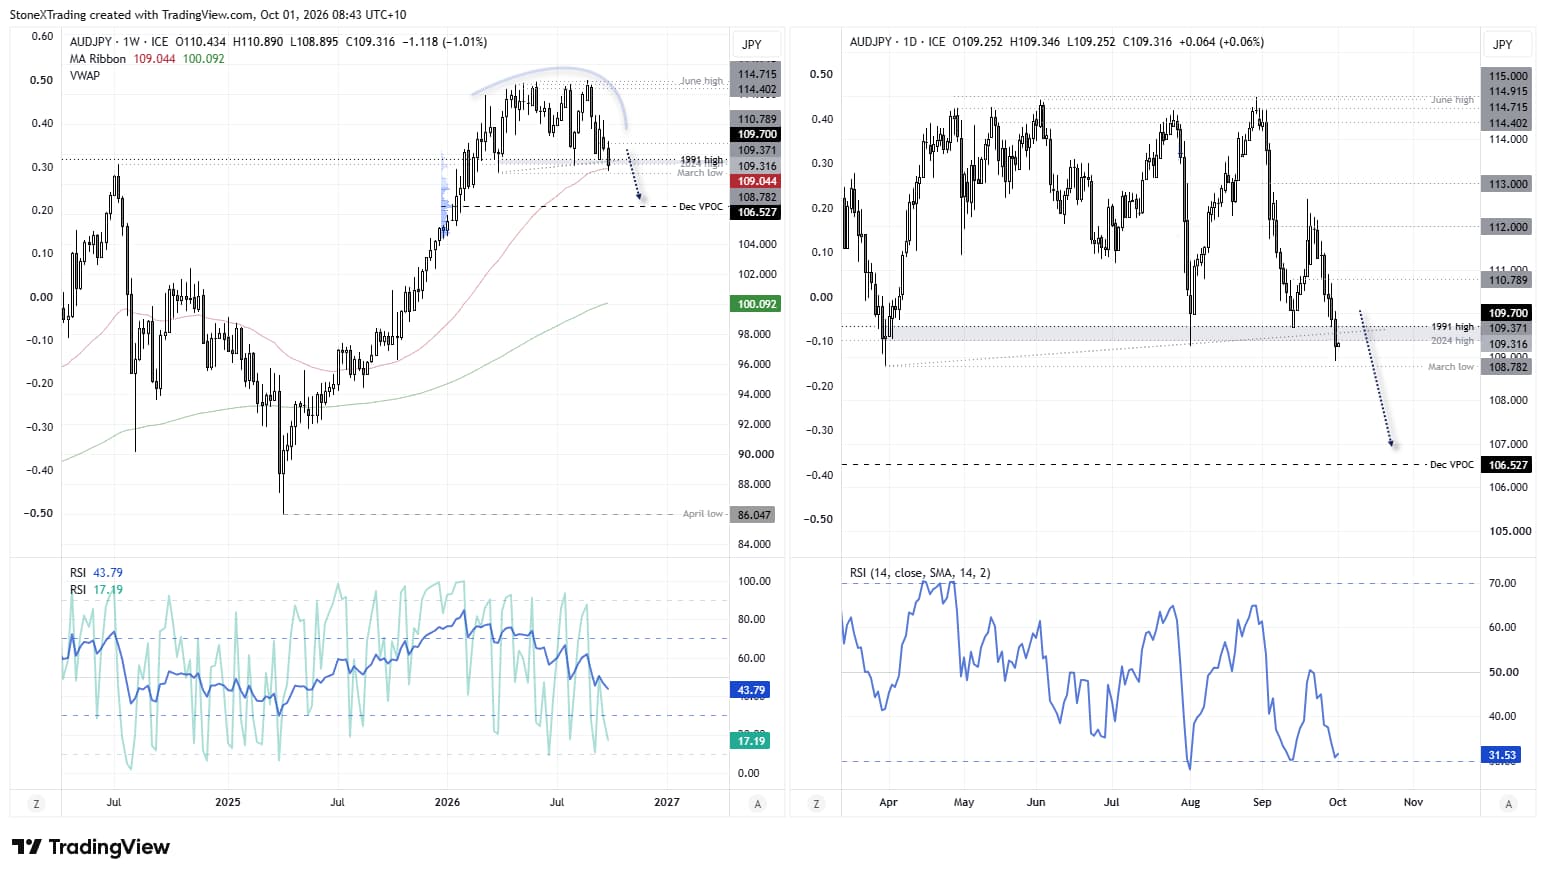
The Aussie yen is one of the few yen pairs that is not hinting at an imminent swing low. AUD/JPY is on track for a second consecutive weekly decline, and it appears that a much larger topping pattern is in play. It has found support at the 50-week EMA for now, though bearish momentum on the daily chart suggests AUD/JPY is also threatening to break the March low.
AUD/JPY remains on my ‘fade the rally’ watchlist, with a break of the March low bringing the 108 and 107 handles into focus, ahead of the December VPOC.
Source: ICE, TradingView
Related tags:
Latest market news



Open an account in minutes
Experience award-winning platforms with fast and secure execution, and enjoy tight spreads from 0.5 pts on FX and 0.3 pts on indices.
Economic calendar
Web Trader platform
Our sophisticated web-based platform is packed with features.
Related articles
US Dollar, GBP/USD, USD/CAD, USD/CHF, Gold Weekly Technical Outlook 11 2 2026
Sr. Technical Strategist Michael Boutros highlights the levels that matter on the USD Majors, commodities, and equity indices charts this week.

US Midterm Forecast: The Key Risks for Traders to Watch Through the US Elections
Prediction markets are pricing in nearly 75% odds of a Democratic sweep in this week’s US midterm elections, a development that would result in a split from the single party Republican rule of the past two years - what will it mean for markets?


GBP/USD outlook: Currency Pair of the Week | November 2, 2026
The GBP/USD heads into a crowded week of event risk, with the midterm elections, a Bank of England rate decision and Friday's non-farm payrolls report all capable of moving markets sharply. The greenback remains fundamentally well supported by a hawkish Federal Reserve, but much of that is already priced in, while the renewed sell-off in technology stocks has exposed its vulnerability.

This report is intended for general circulation only. It should not be construed as a recommendation, or an offer (or solicitation of an offer) to buy or sell any financial products. The information provided does not take into account your specific investment objectives, financial situation or particular needs. Before you act on any recommendation that may be contained in this report, independent advice ought to be sought from a financial adviser regarding the suitability of the investment product, taking into account your specific investment objectives, financial situation or particular needs.
StoneX Financial Pte. Ltd., may distribute reports produced by its respective foreign entities or affiliates within the StoneX group of companies or third parties pursuant to an arrangement under Regulation 32C of the Financial Advisers Regulations. Where the report is distributed to a person in Singapore who is not an accredited investor, expert investor or an institutional investor (as defined in the Securities Futures Act), StoneX Financial Pte. Ltd. accepts legal responsibility to such persons for the contents of the report only to the extent required by law. Singapore recipients should contact StoneX Financial Pte. Ltd. at 6826 9988 for matters arising from, or in connection with the report.
In the case of all other recipients of this report, to the extent permitted by applicable laws and regulations neither StoneX Financial Pte. Ltd. nor its associated companies will be responsible or liable for any loss or damage incurred arising out of, or in connection with, any use of the information contained in this report and all such liability is hereby expressly disclaimed. No representation or warranty is made, express or implied, that the content of this report is complete or accurate.
StoneX Financial Pte. Ltd. is not under any obligation to update this report.
Trading CFDs carries a high level of risk that may not be suitable for some investors. Consider your investment objectives, level of experience, financial resources, risk appetite and other relevant circumstances carefully. The possibility exists that you could lose some or all of your investments, including your initial deposits. If in doubt, please seek independent expert advice. Visit www.forex.com/en-sg/terms-and-policies for the complete Risk Disclosure Statement.