



Bitcoin and Silver Struggle Below Key Resistance as Dow Jones Hits Record Highs
Bitcoin and silver remain below key resistance levels as the Dow Jones reaches fresh record highs above 50,500. Explore the latest outlook for Bitcoin, silver, bond yields, the US dollar, and market sentiment.
Share this:

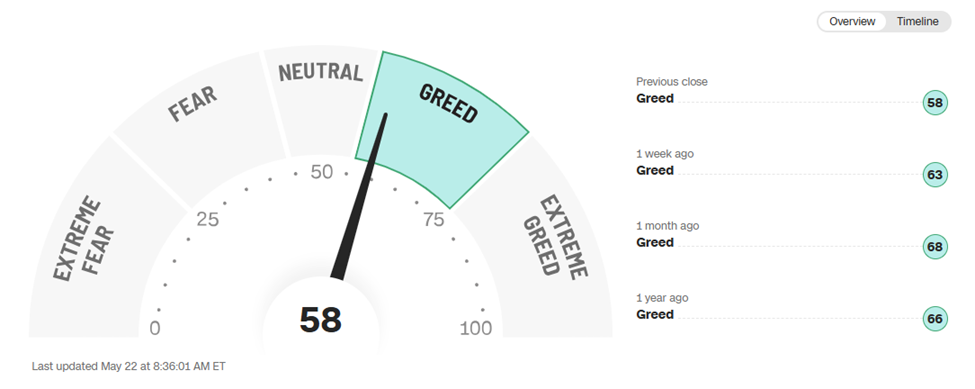
Bitcoin and silver continue to trade below key resistance levels near 78,000 and 77 respectively, while the Dow Jones tests fresh record highs above 50,500. Diverging risk sentiment remains in focus as the CNN Fear & Greed Index slips toward 58, US 10-year and 30-year bond yields retreat more than 2% from yearly highs, and WTI crude oil eases back toward the $95 mark amid early signs of recovering flows through the Strait of Hormuz.
At the same time, precious metals remain trapped near fragile support levels, the US Dollar Index (DXY) continues holding above 99, and Bitcoin remains capped below the key 78,000 resistance zone.
CNN Fear & Greed Index
Source: CNN
The Dow Jones is testing record highs above 50,600, while the Nasdaq and S&P 500 remain roughly 0.4% below their respective highs. This raises a similar question previously seen during silver’s earlier rally while gold remained muted: is this divergence a leading or lagging sentiment indicator? Previous Article: Silver Price Outlook: Lagging or Leading Gold?
Bitcoin Price Outlook: Weekly Time Frame – Log Scale
Source: TradingView
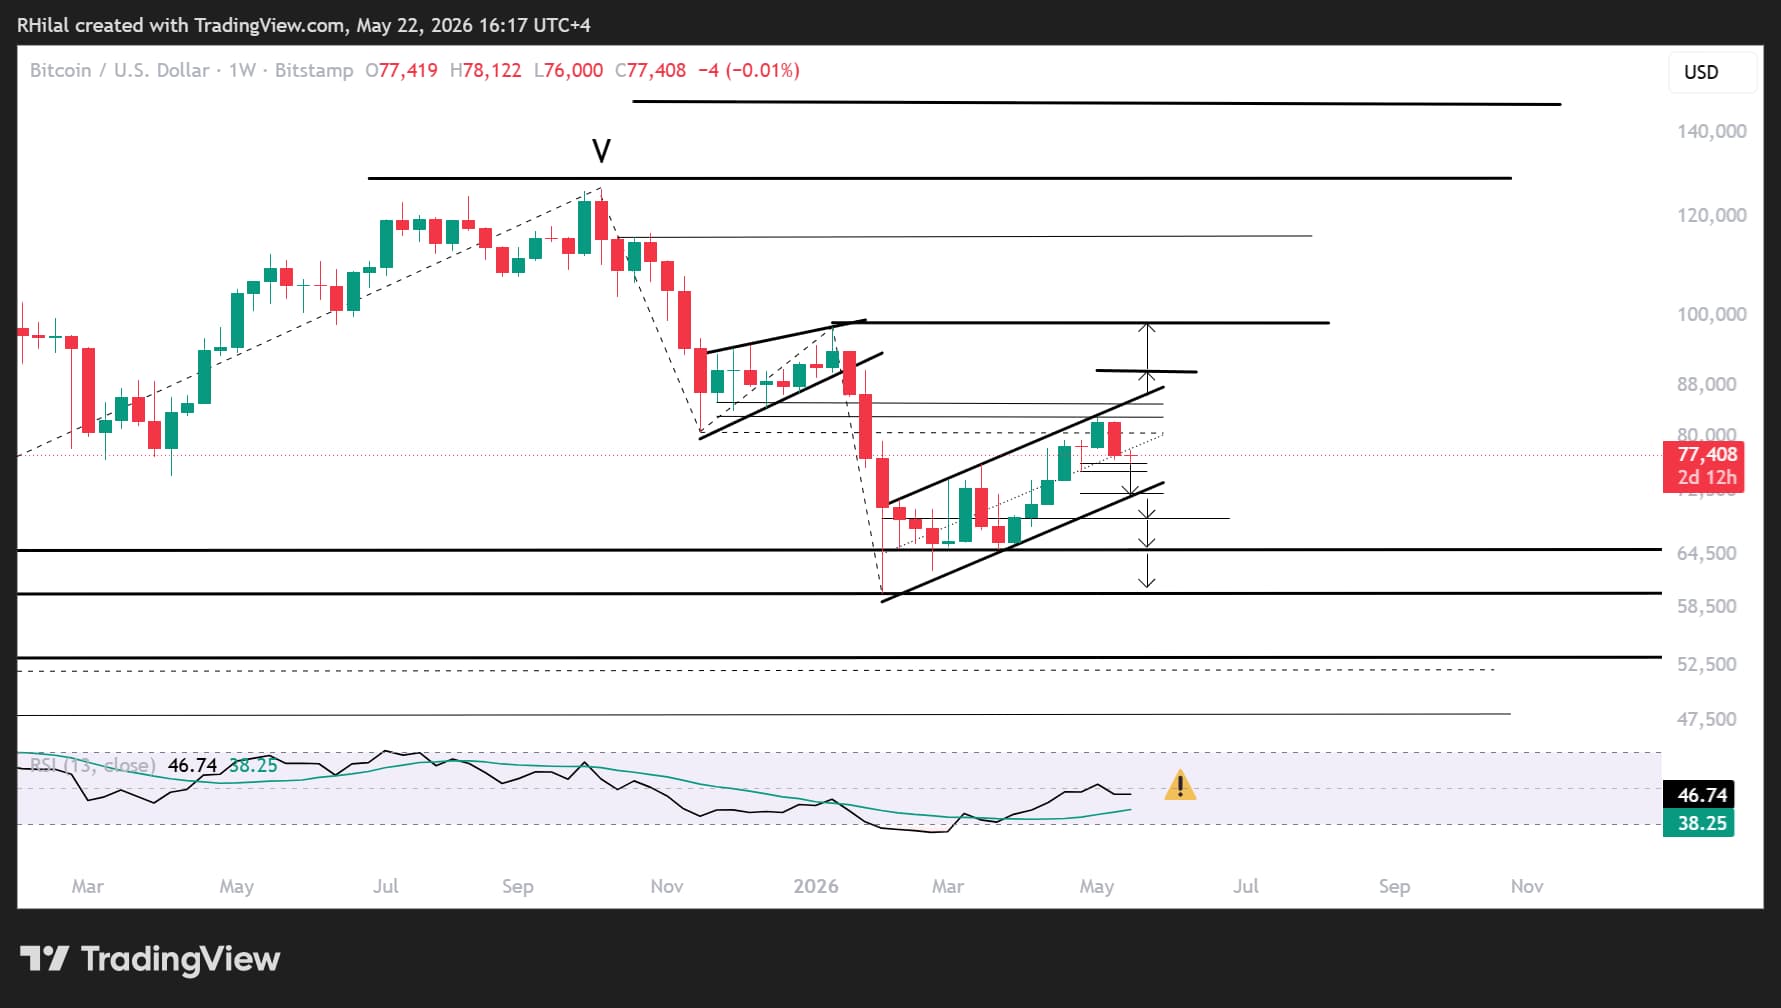
From a weekly perspective, a neutral-to-bearish bias is beginning to emerge based on several technical signals:
- A weekly bearish engulfing pattern forming near the midpoint of the respected ascending channel from this year’s lows
- Weekly RSI challenging the neutral 50 level
- Price action remaining below the 78,000 resistance zone
These factors are beginning to challenge the strong bullish rebound that developed from the 60,000 support region, exposing continuation risks while Bitcoin remains below the 83,000–85,000 resistance zone, upper channel boundary.
A sustained breakout above 85,000 would strengthen the bullish outlook toward 90,000 and 98,000, retesting the highs of 2026 and potentially confirming a continuation back above the 100,000 mark.
On the downside, a breakdown below the channel structure, particularly under 75,000 and the 72,000 lower channel boundary, would expose downside risks toward 65,000 and 60,000 once again before potentially confirming a deeper correction toward 53,000 and 48,000, which may present longer-term dip-buying opportunities.
Bitcoin Price Outlook: Daily Time Frame – Log Scale
Source: TradingView
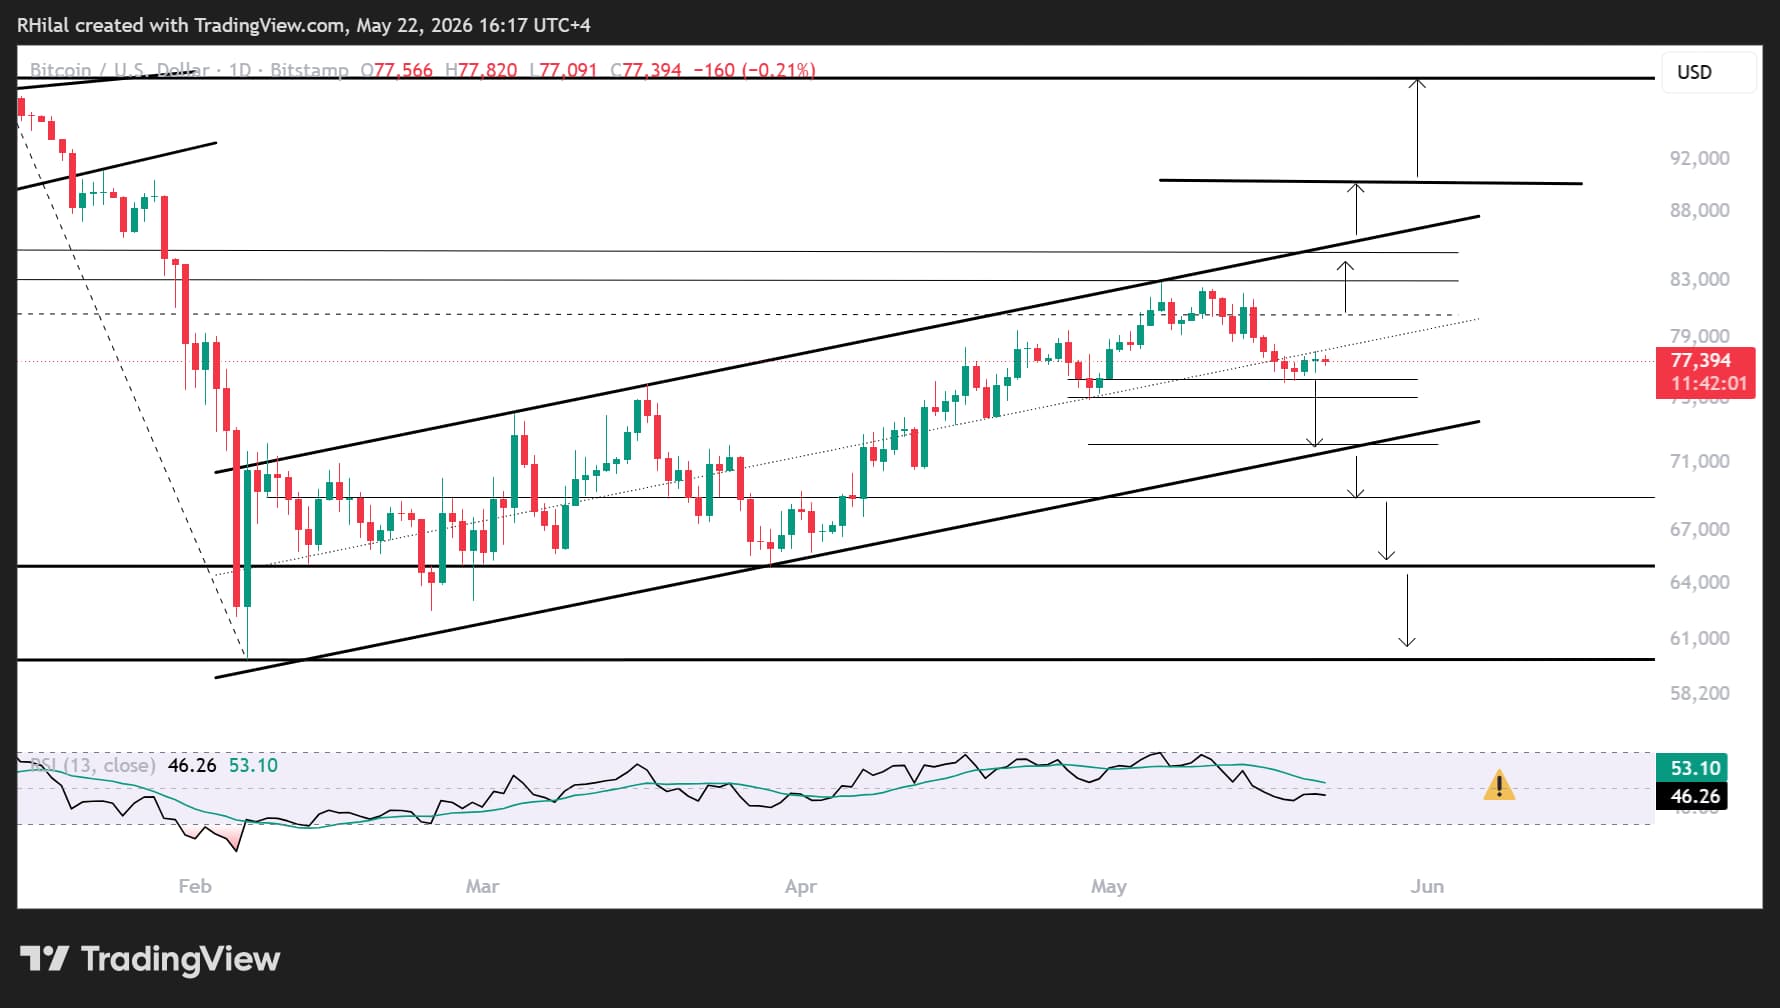
The daily time frame also reflects this cautious bias, with price action holding below the midpoint of the ascending channel and under the 78,000 resistance level, while RSI remains below the neutral 50 mark.
This keeps Bitcoin exposed to short-term drawdown risks unless the 78,000 and 86,000 resistance zones are cleared, as highlighted in the previous chart.
Interestingly, silver prices continue to trace a similar structure and momentum profile to Bitcoin, reflecting a growing correlation between speculative sentiment across both markets as of May 2026.
Silver Price Outlook: Daily Time Frame – Log Scale
Source: TradingView
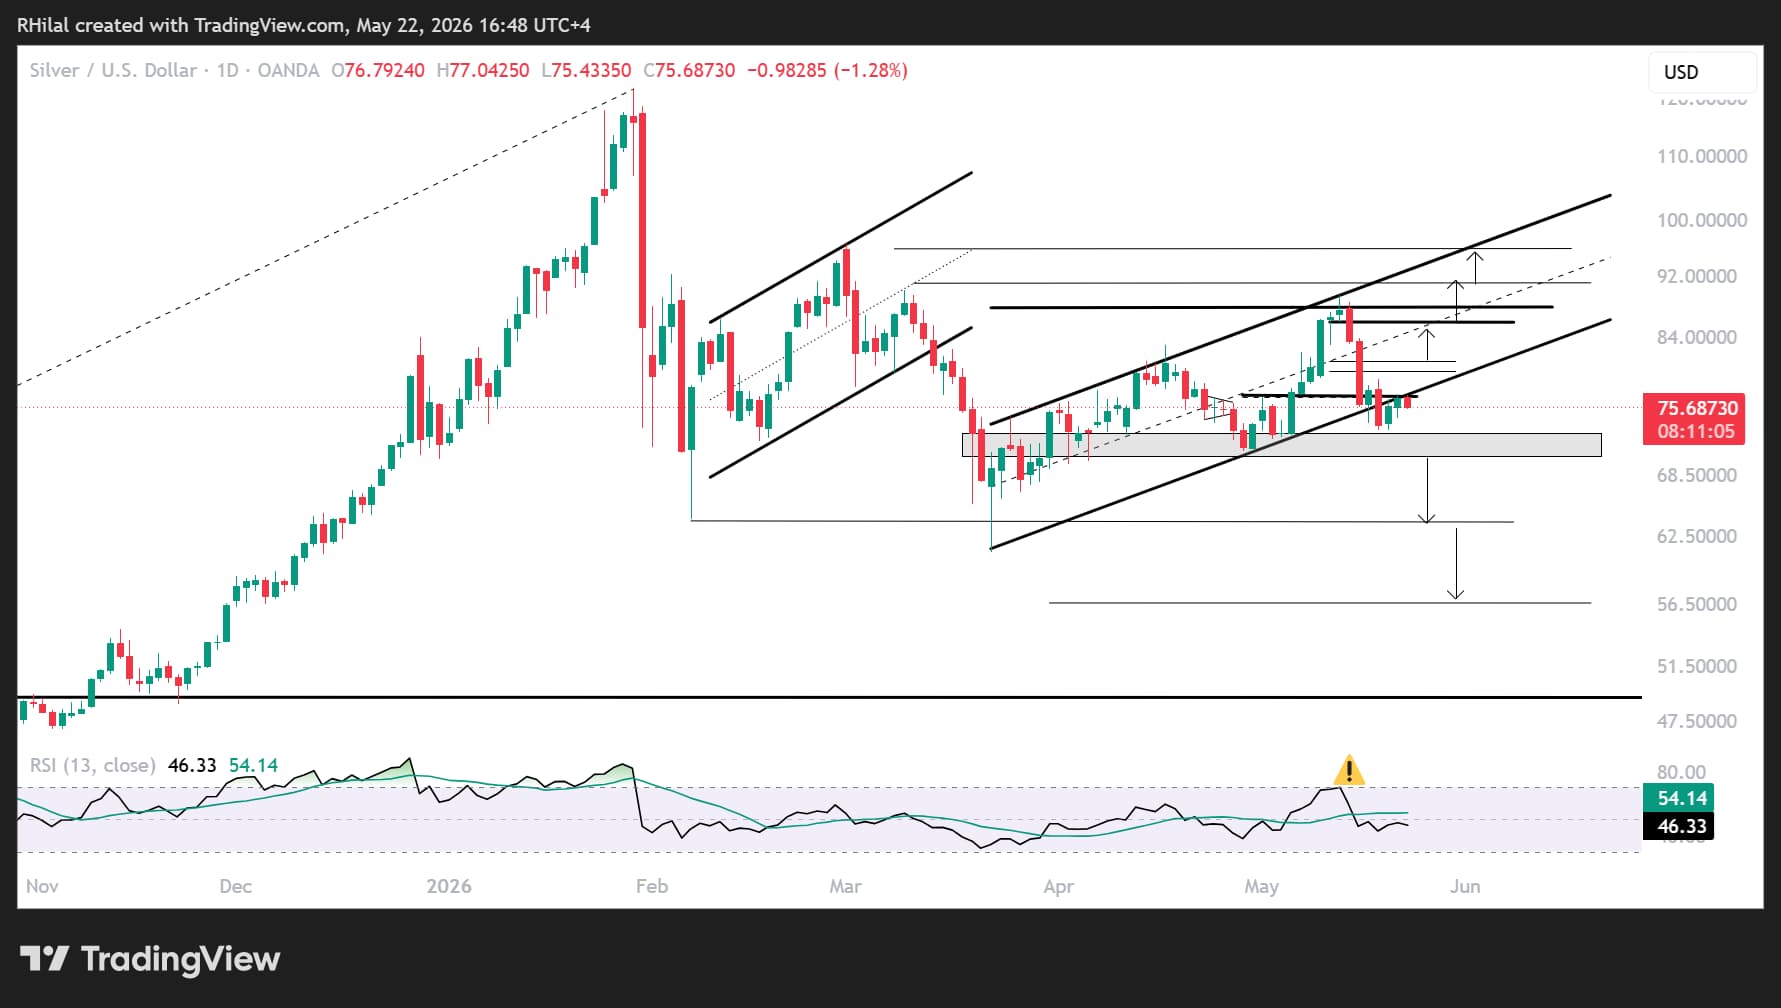
Silver price action remains below the lower boundary of a respected ascending channel extending from this year’s lows and continues to trade below the 77 resistance level.
This leaves the metal vulnerable toward the 72–70 support zone for either another bullish rejection or an extended drawdown toward this year’s lows near 63.80, followed by 56 and 48 — the previous multi-decade resistance zone on the silver chart since 1980, which may once again provide a longer-term bullish positioning opportunity.
On the upside, a breakout back into the channel above the 77 level would expose a short-term retest toward 81 before potentially confirming bullish continuation toward the channel midpoint and upper boundary near 86, 88, 92, and 96.
The April 2026 highs remain critical, as a breakout above them could either trigger another sharp pullback or confirm an extended breakout toward triple-digit silver prices and fresh record highs.
Written by Razan Hilal, CMT
Follow on X: @Rh_waves
Latest market news




Open an account in minutes
Experience award-winning platforms with fast and secure execution, and enjoy tight spreads from 0.5 pts on FX and 0.3 pts on indices.
Economic calendar
Web Trader platform
Our sophisticated web-based platform is packed with features.
Related articles
US Core PCE Preview: Stale or Significant for the Fed
Core PCE inflation takes center stage Wednesday, with traders watching for signs of renewed price pressure and clues on whether the Fed could hike again in October.
Gold Forecast: Are Bears Regaining Control of XAU/USD?
The start of the trading week has not been particularly favorable for gold. This can be seen in recent XAU/USD price action, with the metal falling nearly 4.00% over the last two trading sessions and bringing renewed attention to a bearish bias within the market.

Australian Dollar Forecast: AUD/USD Four-Week Slide Nears Critical Uptrend Support 9 29 2026
Aussie momentum has deteriorated sharply into quarter-end, with inflation, Core PCE and NFP on tap as AUD/USD closes in on a pivotal technical threshold.

This report is intended for general circulation only. It should not be construed as a recommendation, or an offer (or solicitation of an offer) to buy or sell any financial products. The information provided does not take into account your specific investment objectives, financial situation or particular needs. Before you act on any recommendation that may be contained in this report, independent advice ought to be sought from a financial adviser regarding the suitability of the investment product, taking into account your specific investment objectives, financial situation or particular needs.
StoneX Financial Pte. Ltd., may distribute reports produced by its respective foreign entities or affiliates within the StoneX group of companies or third parties pursuant to an arrangement under Regulation 32C of the Financial Advisers Regulations. Where the report is distributed to a person in Singapore who is not an accredited investor, expert investor or an institutional investor (as defined in the Securities Futures Act), StoneX Financial Pte. Ltd. accepts legal responsibility to such persons for the contents of the report only to the extent required by law. Singapore recipients should contact StoneX Financial Pte. Ltd. at 6826 9988 for matters arising from, or in connection with the report.
In the case of all other recipients of this report, to the extent permitted by applicable laws and regulations neither StoneX Financial Pte. Ltd. nor its associated companies will be responsible or liable for any loss or damage incurred arising out of, or in connection with, any use of the information contained in this report and all such liability is hereby expressly disclaimed. No representation or warranty is made, express or implied, that the content of this report is complete or accurate.
StoneX Financial Pte. Ltd. is not under any obligation to update this report.
Trading CFDs carries a high level of risk that may not be suitable for some investors. Consider your investment objectives, level of experience, financial resources, risk appetite and other relevant circumstances carefully. The possibility exists that you could lose some or all of your investments, including your initial deposits. If in doubt, please seek independent expert advice. Visit www.forex.com/en-sg/terms-and-policies for the complete Risk Disclosure Statement.