





Canadian Dollar Forecast: USD/CAD Tightening into Tariffs
USD/CAD started off Q1 with a dramatic flair as tariffs were supposed to come into play but then spent the next two months clawing back that move.
Share this:

Canadian Dollar, USD/CAD Talking Points:
- It was a strong start to Q1 for USD/CAD but the final two months of the year were pullbacks, with wide underside wicks on both February and March monthly candles.
- The broader bull pennant remains in-play, but of late, sellers have seemed to take a stronger role in the pair’s price action.
- On an even longer-term basis, the multi-year range remains of interest for USD/CAD but for that to fill-in, we’ll likely need to see bears take a step forward in Q2, at some point. Explained further below.
It started with a bang but ended with a whimper; well, for USD/CAD bulls, at least. The pair began its ascent in Q4 as the US Dollar rolled to fresh multi-year highs, and given the threat of tariffs on Canada and possible business disruptions, which would logically be countered with looser monetary policy, there was also a drive of CAD-weakness.
That all hit fever pitch at the February open, when the pair burst out to a fresh 20-plus year high, albeit temporarily; but as tariffs were pushed back to March, the pair relaxed, and prices pulled back below the 1.4500 level.
Since then – bulls haven’t been able to do much above 1.4500 and this keeps the longer-term range in order, which can be seen from the monthly chart below. Importantly, last month held a lower-high as well as a higher-low, illustrating the digestion of the prior bullish move. The bull pennant formation does remain in order so the tightening in price action over the past two months still does retain some form of bias as taken from the prior trend, which I’ll discuss deeper below.
USD/CAD Monthly Chart
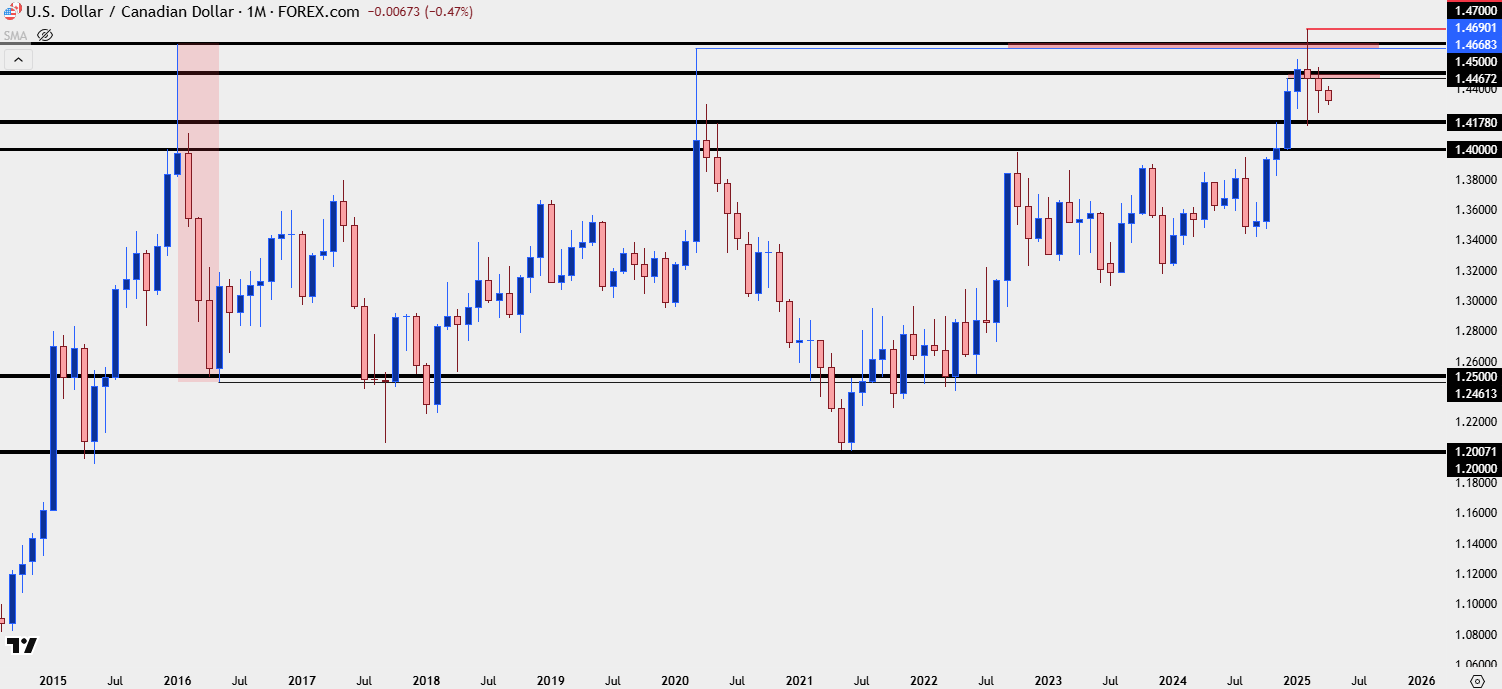 Chart prepared by James Stanley; data derived from Tradingview
USD/CAD Weekly
The weekly chart highlights that recent digestion (and congestion) fairly well. There’s been a series of both lower-highs and higher-lows, but there’s also been extended wicks on both sides of the past four weekly bars, indicating mean reversion tendencies from intra-week tests of highs and lows.
In and of itself, a symmetrical triangle and the wicks on the weekly do not come with a directional bias, as it’s more indicative of consolidation than anything. But, when taken with the prior bullish trend it can be construed as a bull pennant, which would offer some form of directional bias to the matter. The logic being the market just made a stern move-higher that’s obvious driven by demand; the fact that a larger pullback couldn’t show as the buyers that pushed the trend in the first place take profits on pullbacks indicates that there’s still a residual bullish backdrop in effect. That’s the price action logic for bull pennants, at least.
There could be some fundamental explanation behind this, as well, as the market has shown a more and more muted reaction to tariff threats since the initial explosion of fear in early-February, and I think that’s the expectation that President Trump will ultimately avoid trying to create a messy economic backdrop. But, we have to call this what it is – its uncertain, on both sides of the coin, and the beauty of price is that it largely factors in what’s known at the current time.
USD/CAD Weekly Price Chart
 Chart prepared by James Stanley; data derived from Tradingview
USD/CAD Daily – Strategy
I went over this in yesterday’s webinar but my expectation is for the longer-term range in USD/CAD to ultimately prevail. That said, it could take some time for bears to negate the bull pennant looked at above and they’ll likely need some help from the fundamental side of the equation. If I had to guess what could produce that, it would be some form of deal between the U.S. and Canada that produces a type of preferential trade relationship. I think that the idea of Canada becoming the 51st U.S. State isn’t really expected to happen; but it could be Trump asking for more than he knows is possible so that a compromise can be made in the middle. In this case, it could be Canada dropping all prior tariffs that apply on U.S. imports and the United States doing the same.
The complication for that type of compromise is that Canadian leadership is currently up in the air, with elections planned for later this month. But, given current PM Mark Carney’s desire to shore up support for his campaign, perhaps there could be a sort of truce that could be decided upon between him and President Trump.
Nonetheless, price action is what I want to follow for indication of trend, and at this point, there’s a short-term range to work with given that two months of digestion. The trader has a choice at that point – to either work with the mean reversion that the market has given or to wait for a break and then look to impart directional strategies.
I currently have USD/CAD testing support in the 1.4280-1.4300 zone, and there’s short-term resistance at 1.4371 and 1.4402; after which the 1.4500 level comes back into the picture. For directional strategies that’s the big spot in my opinion as bulls have been rebuffed there twice since the early-February flare.
For deeper support, I’m tracking 1.4240 which held twice in March (and produces a double bottom formation), after which 1.4151 marks the current three-month-low. For bearish directional strategies, I would want to see a daily candle close through 1.4100 for aggressive approaches and 1.4000 if looking for a bit more confirmation. And notably, that 1.4000 level is nearing confluence with the 200-day moving average in the pair.
USD/CAD Daily Chart
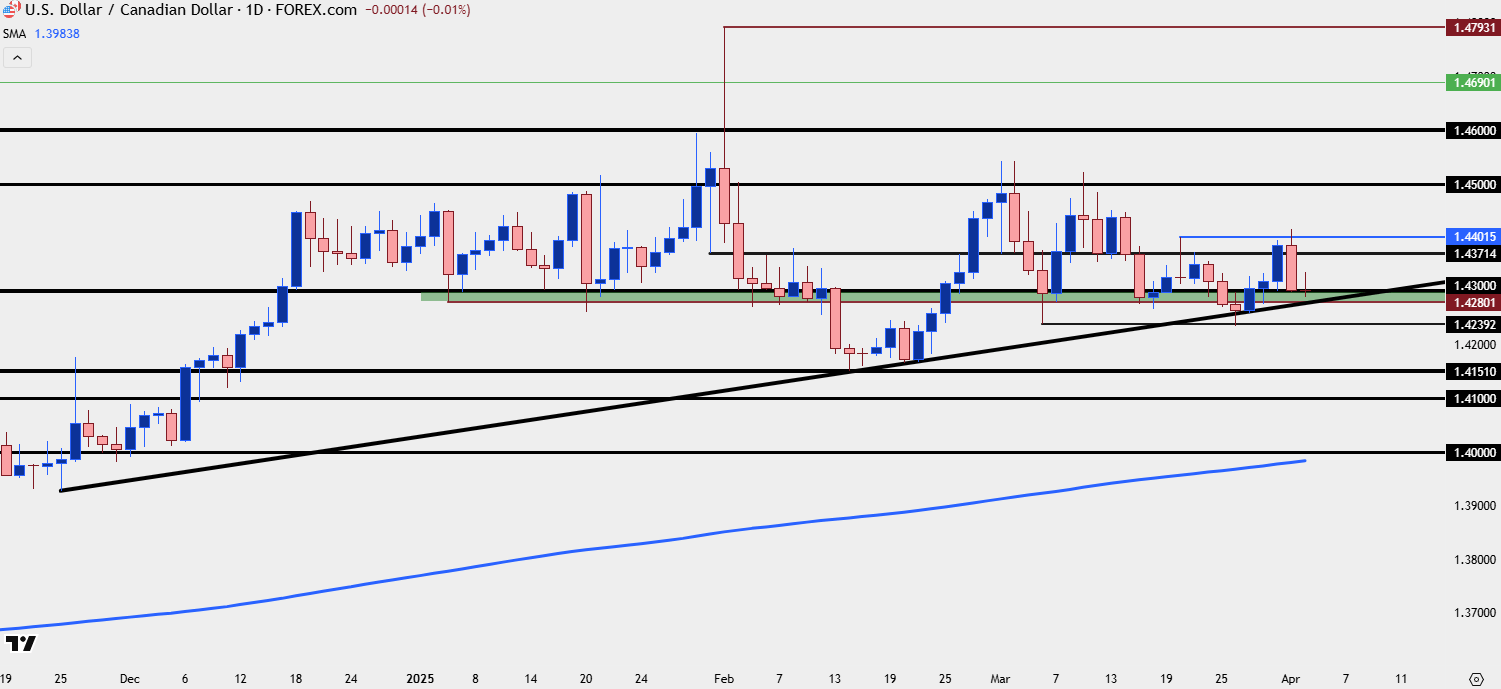 Chart prepared by James Stanley; data derived from Tradingview
--- written by James Stanley, Senior Strategist
Canadian Dollar, USD/CAD Talking Points:
- It was a strong start to Q1 for USD/CAD but the final two months of the year were pullbacks, with wide underside wicks on both February and March monthly candles.
- The broader bull pennant remains in-play, but of late, sellers have seemed to take a stronger role in the pair’s price action.
- On an even longer-term basis, the multi-year range remains of interest for USD/CAD but for that to fill-in, we’ll likely need to see bears take a step forward in Q2, at some point. Explained further below.
It started with a bang but ended with a whimper; well, for USD/CAD bulls, at least. The pair began its ascent in Q4 as the US Dollar rolled to fresh multi-year highs, and given the threat of tariffs on Canada and possible business disruptions, which would logically be countered with looser monetary policy, there was also a drive of CAD-weakness.
That all hit fever pitch at the February open, when the pair burst out to a fresh 20-plus year high, albeit temporarily; but as tariffs were pushed back to March, the pair relaxed, and prices pulled back below the 1.4500 level.
Since then – bulls haven’t been able to do much above 1.4500 and this keeps the longer-term range in order, which can be seen from the monthly chart below. Importantly, last month held a lower-high as well as a higher-low, illustrating the digestion of the prior bullish move. The bull pennant formation does remain in order so the tightening in price action over the past two months still does retain some form of bias as taken from the prior trend, which I’ll discuss deeper below.
USD/CAD Monthly Chart
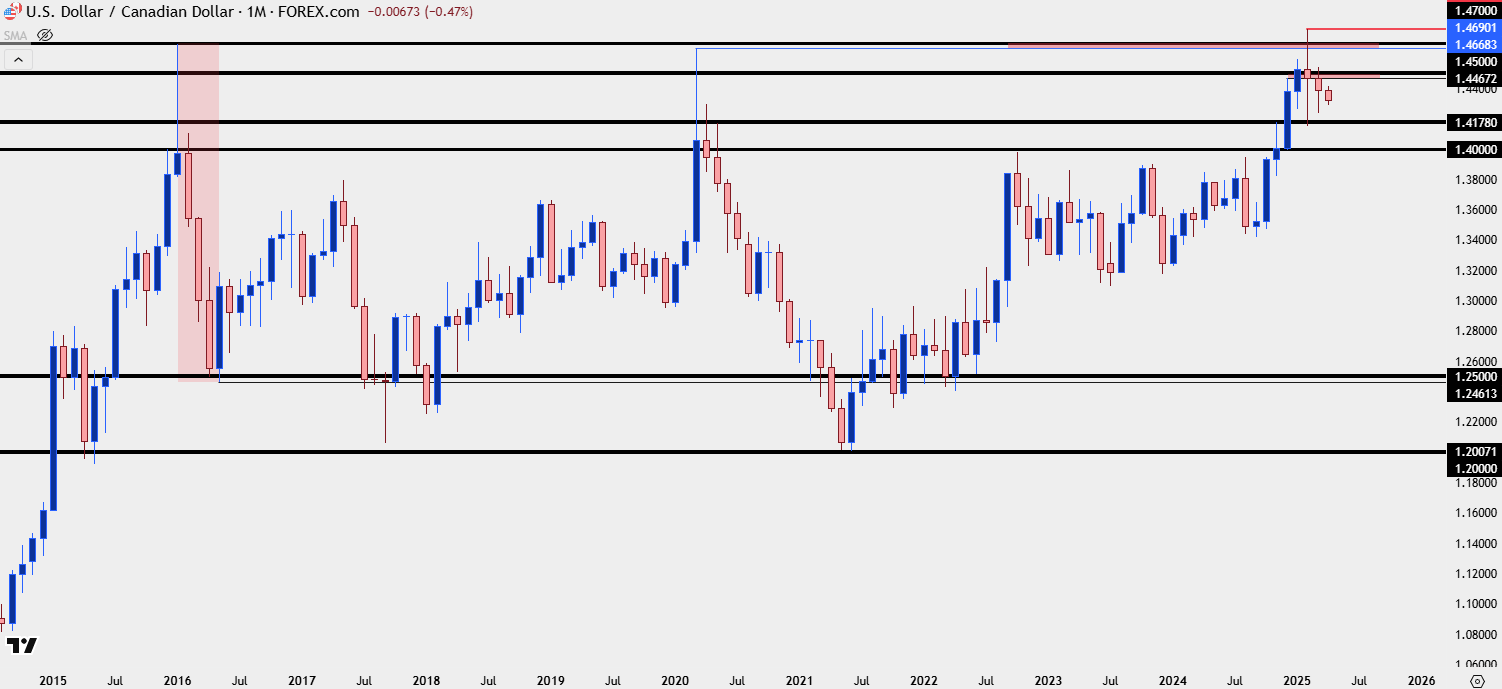 Chart prepared by James Stanley; data derived from Tradingview
USD/CAD Weekly
The weekly chart highlights that recent digestion (and congestion) fairly well. There’s been a series of both lower-highs and higher-lows, but there’s also been extended wicks on both sides of the past four weekly bars, indicating mean reversion tendencies from intra-week tests of highs and lows.
In and of itself, a symmetrical triangle and the wicks on the weekly do not come with a directional bias, as it’s more indicative of consolidation than anything. But, when taken with the prior bullish trend it can be construed as a bull pennant, which would offer some form of directional bias to the matter. The logic being the market just made a stern move-higher that’s obvious driven by demand; the fact that a larger pullback couldn’t show as the buyers that pushed the trend in the first place take profits on pullbacks indicates that there’s still a residual bullish backdrop in effect. That’s the price action logic for bull pennants, at least.
There could be some fundamental explanation behind this, as well, as the market has shown a more and more muted reaction to tariff threats since the initial explosion of fear in early-February, and I think that’s the expectation that President Trump will ultimately avoid trying to create a messy economic backdrop. But, we have to call this what it is – its uncertain, on both sides of the coin, and the beauty of price is that it largely factors in what’s known at the current time.
USD/CAD Weekly Price Chart
Chart prepared by James Stanley; data derived from Tradingview
USD/CAD Daily – Strategy
I went over this in yesterday’s webinar but my expectation is for the longer-term range in USD/CAD to ultimately prevail. That said, it could take some time for bears to negate the bull pennant looked at above and they’ll likely need some help from the fundamental side of the equation. If I had to guess what could produce that, it would be some form of deal between the U.S. and Canada that produces a type of preferential trade relationship. I think that the idea of Canada becoming the 51st U.S. State isn’t really expected to happen; but it could be Trump asking for more than he knows is possible so that a compromise can be made in the middle. In this case, it could be Canada dropping all prior tariffs that apply on U.S. imports and the United States doing the same.
The complication for that type of compromise is that Canadian leadership is currently up in the air, with elections planned for later this month. But, given current PM Mark Carney’s desire to shore up support for his campaign, perhaps there could be a sort of truce that could be decided upon between him and President Trump.
Nonetheless, price action is what I want to follow for indication of trend, and at this point, there’s a short-term range to work with given that two months of digestion. The trader has a choice at that point – to either work with the mean reversion that the market has given or to wait for a break and then look to impart directional strategies.
I currently have USD/CAD testing support in the 1.4280-1.4300 zone, and there’s short-term resistance at 1.4371 and 1.4402; after which the 1.4500 level comes back into the picture. For directional strategies that’s the big spot in my opinion as bulls have been rebuffed there twice since the early-February flare.
For deeper support, I’m tracking 1.4240 which held twice in March (and produces a double bottom formation), after which 1.4151 marks the current three-month-low. For bearish directional strategies, I would want to see a daily candle close through 1.4100 for aggressive approaches and 1.4000 if looking for a bit more confirmation. And notably, that 1.4000 level is nearing confluence with the 200-day moving average in the pair.
USD/CAD Daily Chart
Chart prepared by James Stanley; data derived from Tradingview
--- written by James Stanley, Senior Strategist
Related tags:
Latest market news




Open an account in minutes
Experience award-winning platforms with fast and secure execution, and enjoy tight spreads from 0.5 pts on FX and 0.3 pts on indices.
Economic calendar
Web Trader platform
Our sophisticated web-based platform is packed with features.
Related articles
RBA delivers 25bp hike, Bullock now the main event
The RBA delivered the expected 25bp hike, but Bullock’s press conference now looms as the bigger volatility risk for AUD/USD and the ASX 200.
Gold outlook: XAU/USD hammered, stretched and vulnerable to a sharp rebound
Gold is getting hammered for solid fundamental reasons, but history suggests extreme four-hourly oversold conditions can produce violent countertrend rallies.
Gold forecast: Rising yields become too hot for gold, but the outlook is far from bearish
Gold and silver prices took a plunge today, with the former down 3% and the latter falling some 5% by mid European session, before bouncing off their lows. The losses come after the metals remained largely supported until last week, despite the big dollar rally and surging bond yields as we have seen in recent weeks. But it simply got too much, and the metals succumbed to pressure today.

This report is intended for general circulation only. It should not be construed as a recommendation, or an offer (or solicitation of an offer) to buy or sell any financial products. The information provided does not take into account your specific investment objectives, financial situation or particular needs. Before you act on any recommendation that may be contained in this report, independent advice ought to be sought from a financial adviser regarding the suitability of the investment product, taking into account your specific investment objectives, financial situation or particular needs.
StoneX Financial Pte. Ltd., may distribute reports produced by its respective foreign entities or affiliates within the StoneX group of companies or third parties pursuant to an arrangement under Regulation 32C of the Financial Advisers Regulations. Where the report is distributed to a person in Singapore who is not an accredited investor, expert investor or an institutional investor (as defined in the Securities Futures Act), StoneX Financial Pte. Ltd. accepts legal responsibility to such persons for the contents of the report only to the extent required by law. Singapore recipients should contact StoneX Financial Pte. Ltd. at 6826 9988 for matters arising from, or in connection with the report.
In the case of all other recipients of this report, to the extent permitted by applicable laws and regulations neither StoneX Financial Pte. Ltd. nor its associated companies will be responsible or liable for any loss or damage incurred arising out of, or in connection with, any use of the information contained in this report and all such liability is hereby expressly disclaimed. No representation or warranty is made, express or implied, that the content of this report is complete or accurate.
StoneX Financial Pte. Ltd. is not under any obligation to update this report.
Trading CFDs carries a high level of risk that may not be suitable for some investors. Consider your investment objectives, level of experience, financial resources, risk appetite and other relevant circumstances carefully. The possibility exists that you could lose some or all of your investments, including your initial deposits. If in doubt, please seek independent expert advice. Visit www.forex.com/en-sg/terms-and-policies for the complete Risk Disclosure Statement.