



RBA delivers 25bp hike, Bullock now the main event
The RBA delivered the expected 25bp hike, but Bullock’s press conference now looms as the bigger volatility risk for AUD/USD and the ASX 200.
Share this:

- RBA lifts cash rate 25bp to 4.6%, as expected
- November hike probability sits around 44%
- AUD/USD coils near bear pennant support before Bullock presser
- ASX 200 remains trapped between 8,640 and 8,710
RBA keeps door open to further hikes
The RBA increased the overnight cash rate by 25 basis points to 4.6% at its September meeting, as widely expected by markets and economists alike. The decision was unanimous.
Unsurprisingly given the decision, the tone of the statement was hawkish, including a warning from the Board that it remains prepared to increase the cash rate further if needed to bring inflation sustainably back to target. That amounts to a conditional tightening bias.
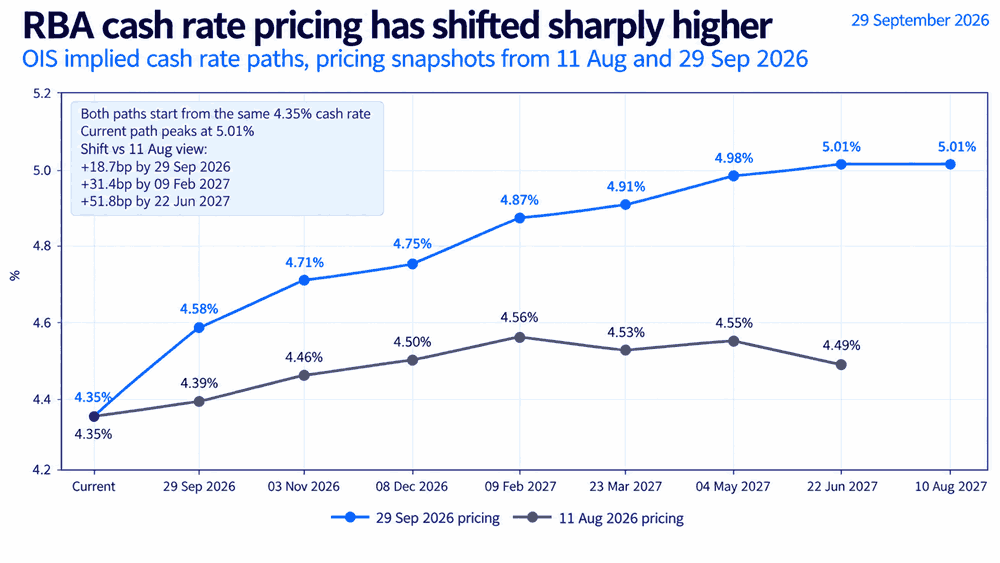
The message is important given we’ve seen a sizeable hawkish recalibration in Australia’s OIS curve since the RBA last met in early August. As highlighted by the accompanying graphic, markets had already moved to price in a considerably higher rate profile ahead of today’s decision, with the cash rate expected to top out above 5%.
Source: Bloomberg
Compared with August, the September statement carried a more hawkish assessment of both growth and inflation, although some of the inflation language had already been flagged by RBA Governor Michele Bullock last week.
The only genuinely new inflation point is that global energy prices are now much higher than assumed in the August forecast, which goes without saying, while recent inflation outcomes were also stronger than expected at the previous meeting. Remember, of course, we get the updated August inflation data tomorrow.
Interestingly, despite some spluttering in recent domestic data, the statement also suggests growth has surprised modestly to the upside relative to its prior forecast. The RBA says June-quarter output was stronger than expected at the margin, while today’s decision explicitly notes that both growth and inflation have been higher than expected.
The labour-market language was broadly unchanged, merely reflecting the higher unemployment profile already built into the August forecasts, so there was little surprise there.
Markets are currently assigning around a 44% probability of another 25 basis point increase in November, according to our futures-based model, having priced virtually no chance of such a move through most of August.
Can Bullock clear an already hawkish market bar?
That means the focus will be squarely on Bullock’s press conference which begins at 3:30pm AEST. The key question will be whether the Board discussed delivering a 50 basis point increase, which comes across as unlikely given the starting point, but would be potentially very influential if discussed.
If she reveals that the debate was effectively between 25 and 50 basis points, rather than between no change and 25, that would be a significantly more hawkish signal and could drive another adjustment higher in the expected rate path.
If, instead, she suggests 25 basis points was the clear choice and keeps the emphasis on incoming data, the scope for a further hawkish repricing may be more limited given how much has already been built into the curve.
AUD/USD waits on Bullock for direction
Source: TradingView
For AUD/USD, if there is to be a pickup in volatility, it will come down to whether Bullock sounds more or less hawkish than the rate profile already priced into the curve.
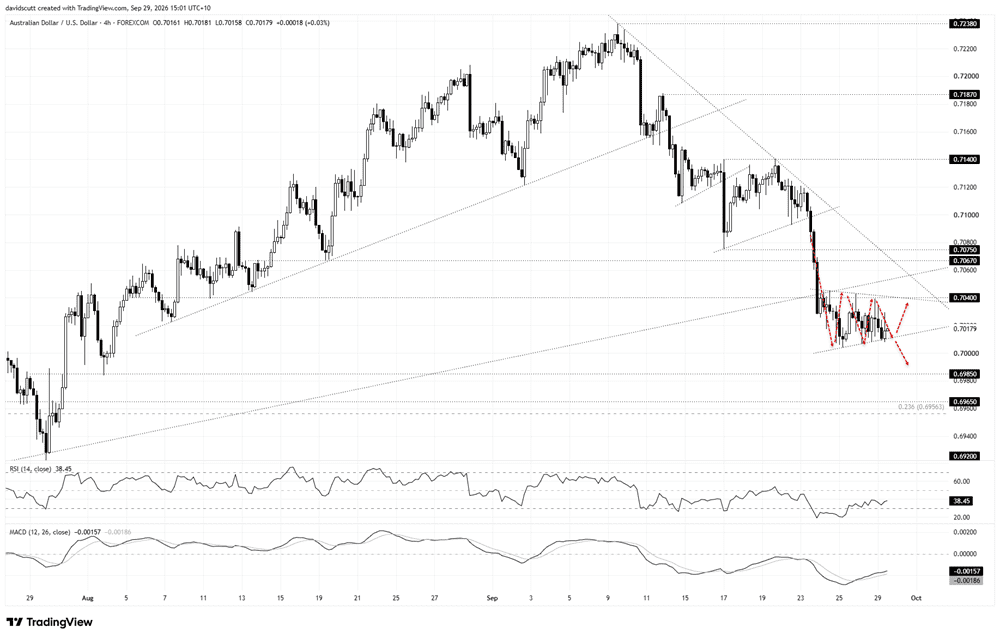
On the four-hourly chart, AUD/USD has already broken the long-running uptrend support that had been in place from the lows set in November last year. Around that time, the RBA abandoned its easing bias. Since then, the price has been coiling in a structure that resembles a bear pennant.
After multiple retests of the upper boundary, the price is now sitting towards the lower end of the structure. A more dovish press conference than currently priced would raise the risk of a downside break, with the lows hit earlier this week at 0.7004 the first level to watch.
A clean break beneath there would put 0.6985 in play, a minor level that has acted as both support and resistance during periods this year. Below that, the more meaningful downside target sits around 0.6960, coinciding with the 23.6% Fibonacci retracement of the April 2025 to May 2026 bull move.
Of course, if Bullock strikes a more hawkish tone, the confluence of the upper end of the pennant structure and 0.7040 resistance looms as the first test for bulls. A break above that would put the former uptrend support from the November lows back in play. Beyond there, downtrend resistance from the September highs would be the next hurdle, with 0.7067 and 0.7075 located nearby.
ASX 200 trapped in tight range
Source: TradingView
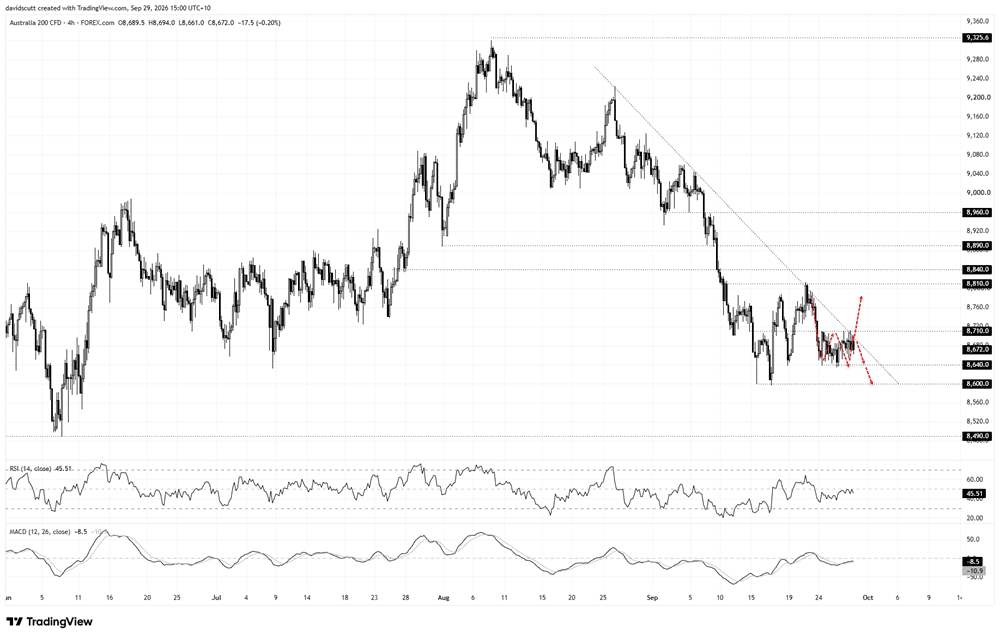
For the ASX 200, it finds itself pressing up against downtrend resistance running from the highs set in late August, along with horizontal resistance at 8,710, heading into the press conference.
Over the past week or so, the index has been unusually rangy, shifting in a very tight band between 8,710 on the top side and 8,640 on the downside. That is the immediate focus for trading around this decision.
With the message from the oscillators broadly neutral, I’m putting more emphasis on price action in evaluating how to proceed from here.
Clearly, a more hawkish outcome would likely see the market retest 8,640, a level that has repeatedly held over the past week. Beneath that, 8,600 is the next level of note, with a sustained break pointing to a potential unwind back towards 8,490.
While marginally the less favoured outcome at this point, if Bullock delivers a slightly less hawkish offering than markets expect, including hosing down any discussion about a potential 50 basis point move, it may be enough to see the index test the upper end of its current sideways range at 8,710, putting a potential breakout of minor downtrend resistance in play.
If we were to see a sustained break above 8,710, it may see the price push back towards 8,810, where it was capped last week and for periods earlier this month, with 8,840 and 8,890 the next levels after that.


Open an account in minutes
Experience award-winning platforms with fast and secure execution, and enjoy tight spreads from 0.5 pts on FX and 0.3 pts on indices.
Economic calendar
Web Trader platform
Our sophisticated web-based platform is packed with features.
Related articles
S&P 500, Nasdaq, Dow Forecast: Nasdaq Selloff Deepens as Dow Rally Stalls 10 24 2026
A failed S&P breakout and looming Nasdaq support test raise the stakes for next week’s Fed decision and October’s monthly close.

USD/JPY Weekly Outlook: AI earnings could overshadow the Fed and BoJ
AI sentiment has become a major driver of US Treasury yields and USD/JPY. With Microsoft, Alphabet and Amazon reporting this week, central bank decisions may have competition for traders' attention.

USD/JPY Forecast: Is Rising Japanese Inflation Supporting the Yen?
As the trading week comes to an end, one of the most relevant developments in the FX market has been the renewed strength of the Japanese yen. This can be seen in the recent performance of USD/JPY, which has fallen nearly 1.0% over the last two trading sessions, highlighting a meaningful recovery in the Japanese currency against the U.S. dollar.

This report is intended for general circulation only. It should not be construed as a recommendation, or an offer (or solicitation of an offer) to buy or sell any financial products. The information provided does not take into account your specific investment objectives, financial situation or particular needs. Before you act on any recommendation that may be contained in this report, independent advice ought to be sought from a financial adviser regarding the suitability of the investment product, taking into account your specific investment objectives, financial situation or particular needs.
StoneX Financial Pte. Ltd., may distribute reports produced by its respective foreign entities or affiliates within the StoneX group of companies or third parties pursuant to an arrangement under Regulation 32C of the Financial Advisers Regulations. Where the report is distributed to a person in Singapore who is not an accredited investor, expert investor or an institutional investor (as defined in the Securities Futures Act), StoneX Financial Pte. Ltd. accepts legal responsibility to such persons for the contents of the report only to the extent required by law. Singapore recipients should contact StoneX Financial Pte. Ltd. at 6826 9988 for matters arising from, or in connection with the report.
In the case of all other recipients of this report, to the extent permitted by applicable laws and regulations neither StoneX Financial Pte. Ltd. nor its associated companies will be responsible or liable for any loss or damage incurred arising out of, or in connection with, any use of the information contained in this report and all such liability is hereby expressly disclaimed. No representation or warranty is made, express or implied, that the content of this report is complete or accurate.
StoneX Financial Pte. Ltd. is not under any obligation to update this report.
Trading CFDs carries a high level of risk that may not be suitable for some investors. Consider your investment objectives, level of experience, financial resources, risk appetite and other relevant circumstances carefully. The possibility exists that you could lose some or all of your investments, including your initial deposits. If in doubt, please seek independent expert advice. Visit www.forex.com/en-sg/terms-and-policies for the complete Risk Disclosure Statement.