



AUD/USD Outlook: Macro Forces Collide Ahead of US, AU Inflation
Macro forces have hammered the Australian dollar, but could sticky inflation catch AUD/USD bears off guard after a bruising week?
Share this:

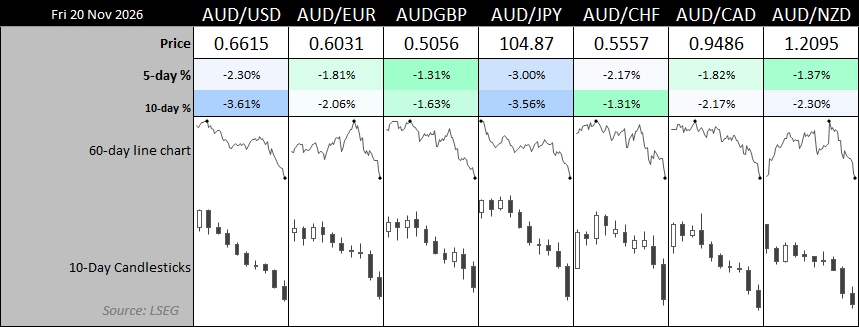
The Australian dollar suffered another bruising week, falling against all major currencies as domestic and global developments combined to undermine sentiment.
Weak Australian employment, deteriorating Chinese economic data, falling commodity prices and a hawkish Federal Reserve have all contributed to the sell-off. Meanwhile, Wall Street's increasingly volatile AI trade has added another layer of pressure.
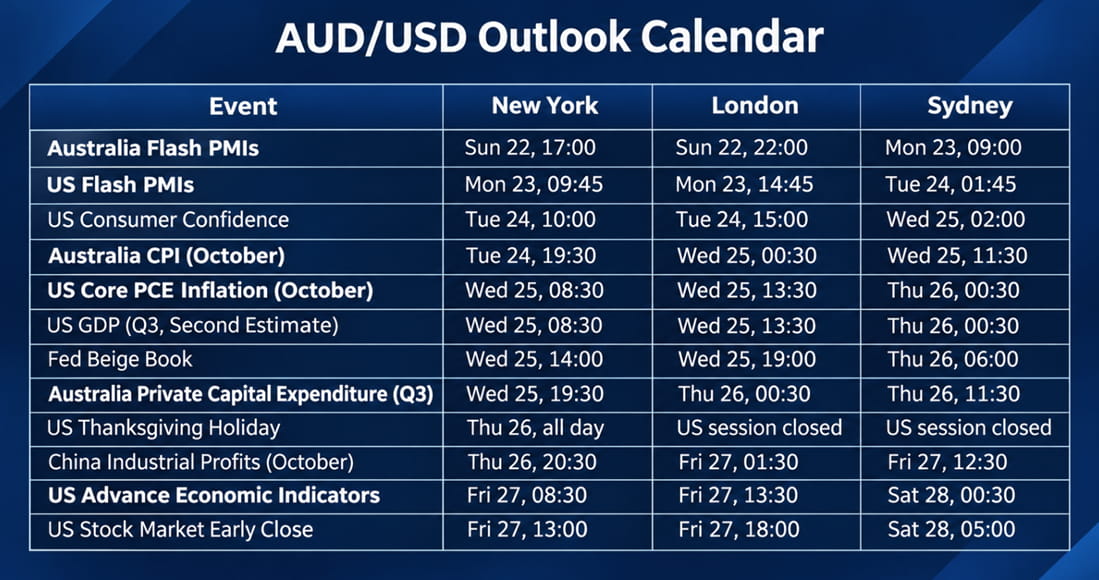
With Australian CPI and US PCE inflation due this week, traders face two major tests of the monetary policy divergence that has helped drive AUD/USD towards multi-month lows.
View related analysis:
AUD/USD Weekly Outlook: Australian CPI and US PCE Test Bearish Momentum
October's employment report was arguably the domestic catalyst, with unemployment rising to a five-year high of 4.9% and employment falling by around 80k over two months. The weak figures have seen markets abandon expectations of further RBA hikes and increasingly price cuts in 2027. That's quite a turnaround from just a month ago.
Meanwhile, hawkish Fed commentary and FOMC minutes have supported the US dollar, widening the divergence between Australian and US rate expectations. Disappointing Chinese economic data has added pressure to industrial metals and other commodities, while AI valuation concerns have weighed heavily on Wall Street and global risk appetite.
AUD/USD Weekly Outlook: Australian CPI and US PCE Take Centre Stage
Australian CPI Likely to Remain “Too High” for The RBA
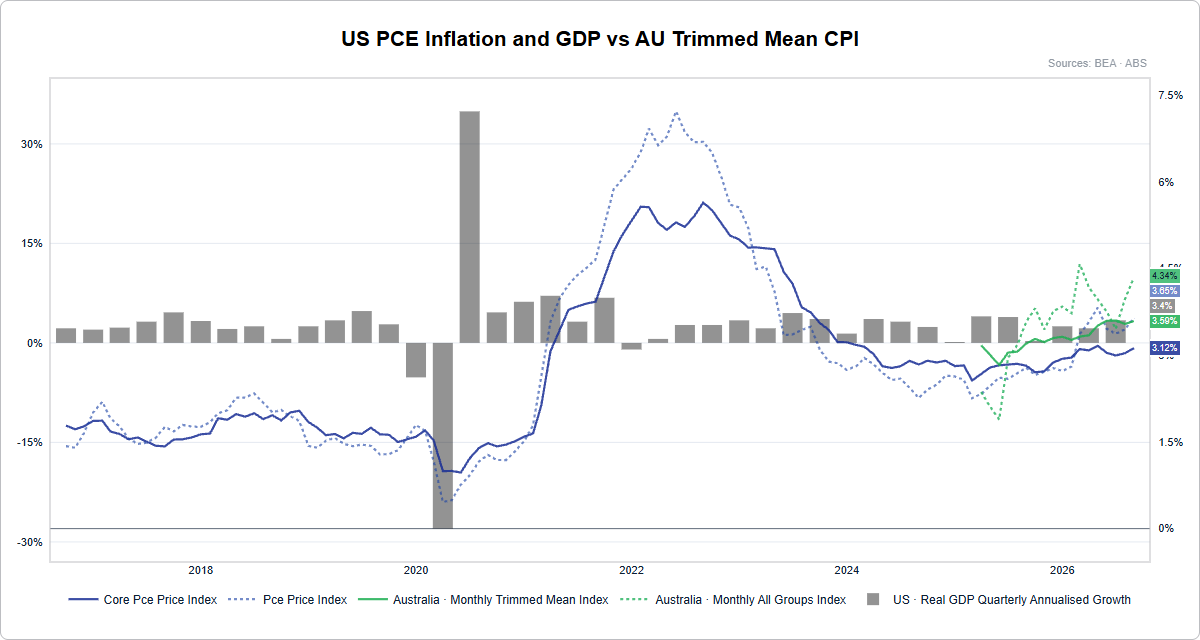
While sentiment is clearly stacked against the Australian dollar, Wednesday's monthly inflation report arguably stands the greatest chance of shaking bears out of their positions. Inflation remains too high for the RBA's liking, and even a softer-than-expected reading may not be enough to convince policymakers to abandon their tightening bias.
And with the recent decline in crude oil prices unlikely to have fully filtered through to October's petrol prices, a meaningfully soft inflation print seems unlikely. That leaves room for sticky inflation to challenge the market's newfound expectations of RBA cuts and trigger a short-covering rally in AUD/USD, even if the broader macro backdrop remains bearish.
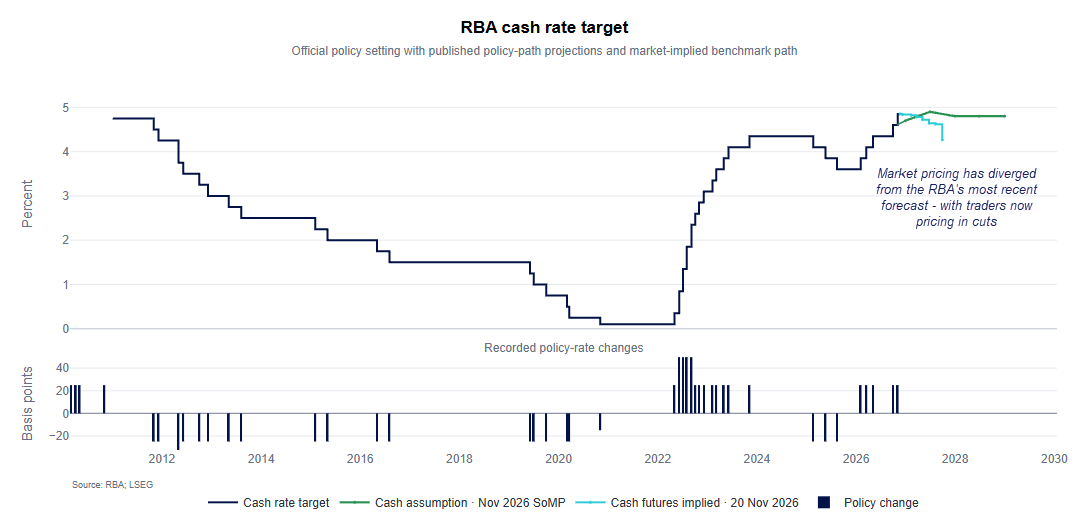
The RBA cash rate chart highlights just how dramatically monetary policy expectations have shifted. While the RBA's November cash-rate assumption remains close to 4.85%, futures markets now imply cuts throughout 2027, potentially taking rates towards 4.25%. That's quite a turnaround from a month ago, when markets were still betting on further hikes.

US PCE and GDP Could Reinforce the Dollar's Strength
Later on Wednesday, US core PCE inflation and the second estimate of Q3 GDP will test whether the Fed's increasingly hawkish stance is justified. Core PCE remains stubbornly above the Fed's 2% target, while economic growth has held up relatively well despite higher interest rates. Another hot inflation print, particularly alongside an upward GDP revision, could reinforce expectations of further Fed hikes and pile more pressure on AUD/USD.
However, with the US dollar having enjoyed a strong rally, softer inflation could encourage some profit-taking and provide temporary relief for the Aussie. Although, like Australian CPI, it may take a significant surprise to change the broader macro outlook.
AUD/USD Technical Analysis: Australian Dollar vs US Dollar
Bearish Options Positioning Reinforces AUD/USD Downtrend
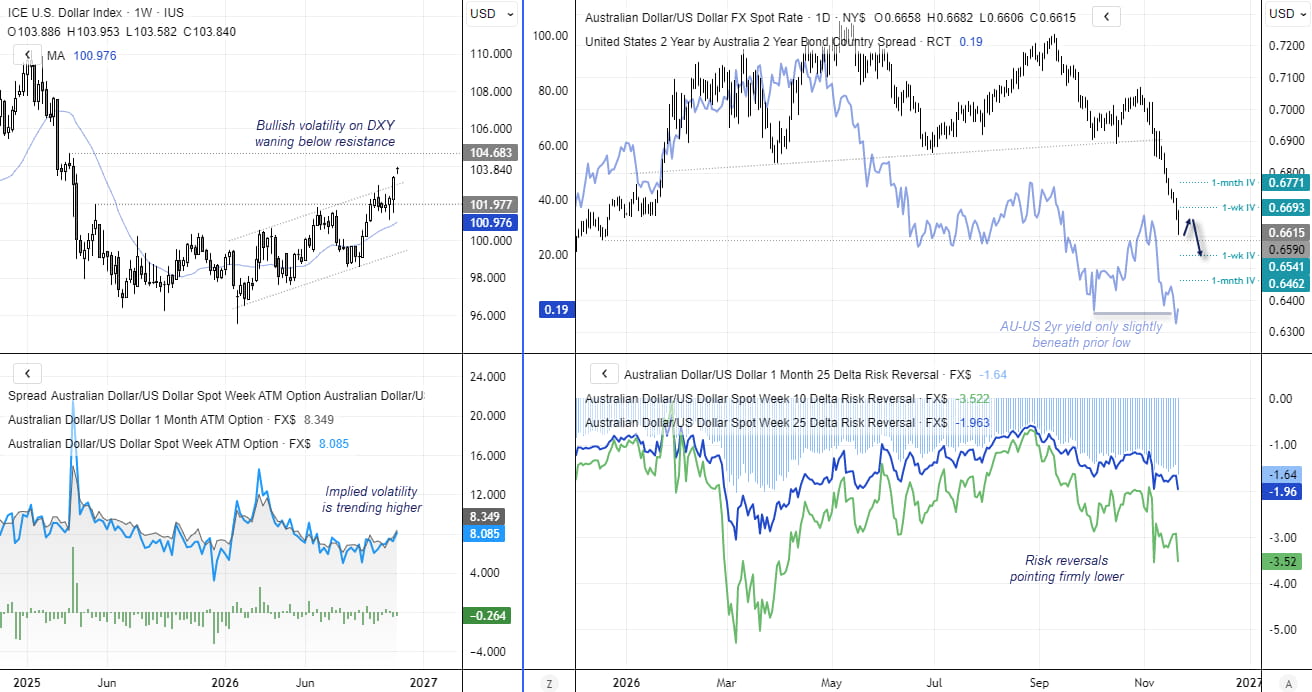
Momentum clearly favours Australian dollar bears, with price action offering no imminent signs of a trough. Options risk reversals are pointing sharply lower, indicating stronger demand for puts relative to calls, while implied volatility is rising. And despite a slight bounce into the weekend, the AU–US two-year yield differential remains under pressure.
If there are any glimmers of hope for bulls, it's the nearby 0.6590 support level and the relatively small bullish range on last week's US dollar index candle, which remains beneath resistance. But these are glimmers of hope at best, as macro forces like those we're witnessing can make mincemeat of support levels with ease.
Ultimately, bears seem likely to favour fading rallies unless the incoming CPI reports diverge enough from expectations to warrant a meaningful bounce in AUD/USD.
Source: CFTC (COT) CME, LSEG
AUD/USD Correlations Reveal Broad Macro Pressure
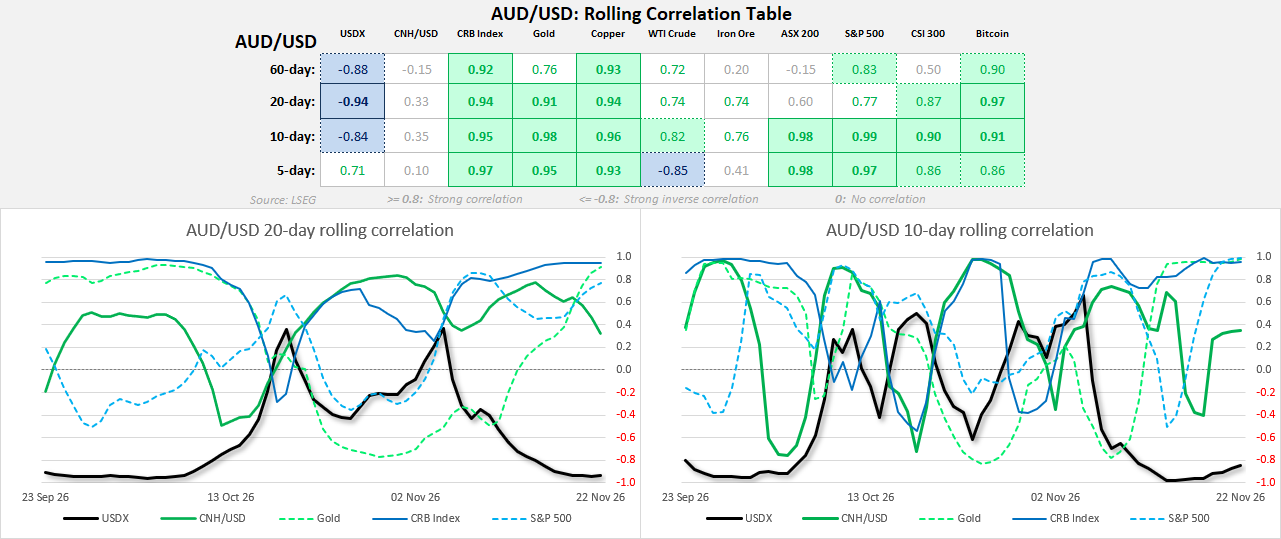
- You can tell macro forces are at play by the way AUD/USD's five-day correlations are mostly strong across currencies, commodities and indices. That said, it appears to have detached itself from the Chinese yuan.
- This suggests broader US dollar movements, commodity prices and global risk sentiment have become more influential than the yuan's recent performance.
- For traders, this means AUD/USD could remain highly sensitive to Wall Street and commodity markets, even in the absence of fresh Australian economic data.
- However, five-day correlations can change quickly, particularly during periods of heightened volatility.
For traders wanting a deeper understanding of futures positioning, I’ve also published a guide on how to read and interpret weekly COT data in forex markets.
For traders wanting a deeper understanding of futures positioning, I’ve also published a guide on how to read and interpret weekly COT data in forex markets.
AUD/USD COT Report: Record Shorts Raise Squeeze Risk
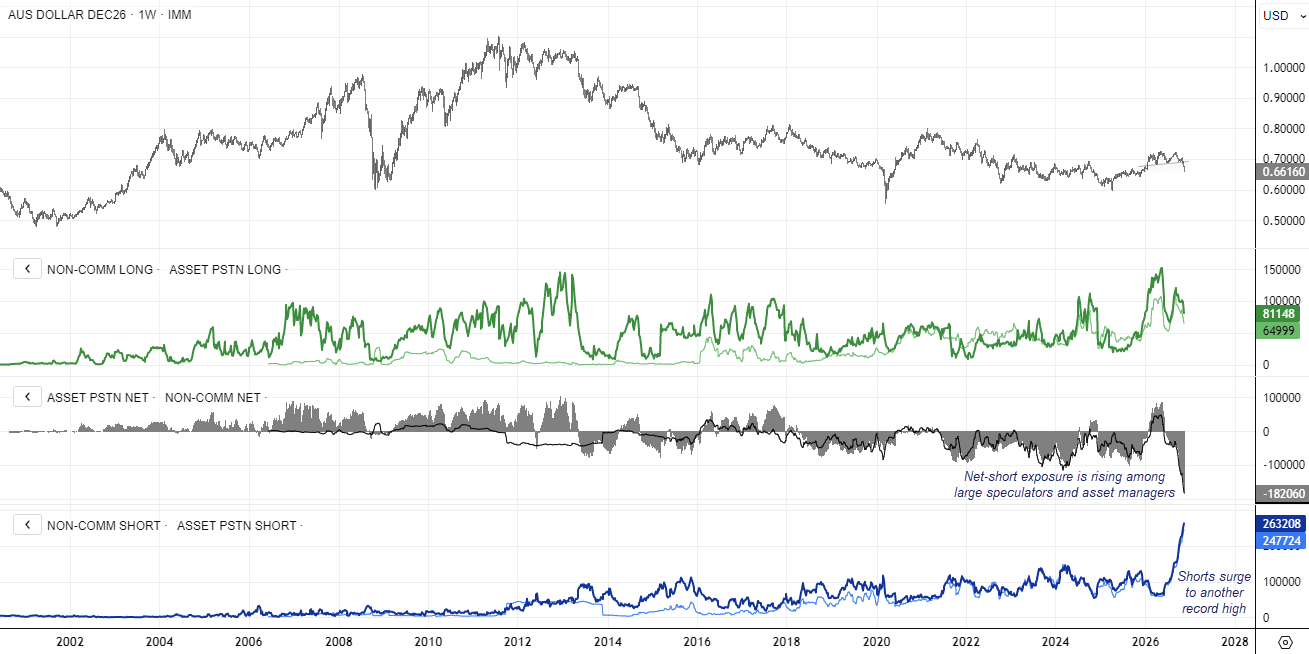
Bears are reaping the rewards of holding onto their record short exposure despite last month's bounce in the Australian dollar. And with momentum now on their side, there seems little appetite to close out those positions.
Of course, such crowded positioning is eventually going to burn some bearish fingers. But until we see evidence of a reversal in price action – and a convincing catalyst – bears seem unlikely to be shaken out of their AUD/USD shorts for now.
Source: CFTC (COT) CME, LSEG


Open an account in minutes
Experience award-winning platforms with fast and secure execution, and enjoy tight spreads from 0.5 pts on FX and 0.3 pts on indices.
Economic calendar
Web Trader platform
Our sophisticated web-based platform is packed with features.
Related articles

AUD/USD Outlook: Macro Forces Collide Ahead of US, AU Inflation
Macro forces have hammered the Australian dollar, but could sticky inflation catch AUD/USD bears off guard after a bruising week?

US Dollar Freight Train Drives EUR/USD, GBP/USD to Fresh Lows
A hawkish Fed and growing jitters around AI have pushed a continued rally in the Greenback, and there’s not yet an end in sight.

Japanese Yen Forecast: USD/JPY Bulls Falter at Major Resistance—Critical Range Break in Focus 11 20 2026
USD/JPY’s latest retreat puts the September recovery under scrutiny, with nearby support offering bulls their next opportunity to respond.

This report is intended for general circulation only. It should not be construed as a recommendation, or an offer (or solicitation of an offer) to buy or sell any financial products. The information provided does not take into account your specific investment objectives, financial situation or particular needs. Before you act on any recommendation that may be contained in this report, independent advice ought to be sought from a financial adviser regarding the suitability of the investment product, taking into account your specific investment objectives, financial situation or particular needs.
StoneX Financial Pte. Ltd., may distribute reports produced by its respective foreign entities or affiliates within the StoneX group of companies or third parties pursuant to an arrangement under Regulation 32C of the Financial Advisers Regulations. Where the report is distributed to a person in Singapore who is not an accredited investor, expert investor or an institutional investor (as defined in the Securities Futures Act), StoneX Financial Pte. Ltd. accepts legal responsibility to such persons for the contents of the report only to the extent required by law. Singapore recipients should contact StoneX Financial Pte. Ltd. at 6826 9988 for matters arising from, or in connection with the report.
In the case of all other recipients of this report, to the extent permitted by applicable laws and regulations neither StoneX Financial Pte. Ltd. nor its associated companies will be responsible or liable for any loss or damage incurred arising out of, or in connection with, any use of the information contained in this report and all such liability is hereby expressly disclaimed. No representation or warranty is made, express or implied, that the content of this report is complete or accurate.
StoneX Financial Pte. Ltd. is not under any obligation to update this report.
Trading CFDs carries a high level of risk that may not be suitable for some investors. Consider your investment objectives, level of experience, financial resources, risk appetite and other relevant circumstances carefully. The possibility exists that you could lose some or all of your investments, including your initial deposits. If in doubt, please seek independent expert advice. Visit www.forex.com/en-sg/terms-and-policies for the complete Risk Disclosure Statement.