



US Dollar Freight Train Drives EUR/USD, GBP/USD to Fresh Lows
A hawkish Fed and growing jitters around AI have pushed a continued rally in the Greenback, and there’s not yet an end in sight.
Share this:

US Dollar Talking Points:
- It was another strong week for the DXY basket as the currency rallied up to a fresh 19-month high. Extending the conversation from the Tuesday webinar, the weekly chart retains an open door for continuation following the jostling at support that led into the prior week.
- EUR/USD pushed below 1.1000 and bulls were unable to elict much of a pullback, and even GBP/USD, which had previously held strong, succumbed to the DXY rally.
- USD/JPY remains of interest as the pair has been bristling for breakout at the 160.00 handle. I looked into the pair on Thursday and the ‘s3’ support from that article has so far held the lows.
There’s a few different common reasons that we’ll see a prolonged USD rally, with the most obvious being higher inflation driving rate hike expectations. This is like what we saw back in 2022, as the Fed was gearing up to and eventually started hiking rates in near-historic fashion. But, there’s another driver that can show up and of late, it seems like that’s what we’ve been seeing as jitters around the AI bubble and the shifting backdrop of the Federal Reserve pushing flows into the USD, to go along with that higher rate backdrop.
As I’ll often look at in these pieces, currencies are unique: They’re the foundation of the global financial system and as such, for a currency to rally, it will deductively need other currencies to weaken. This can be somewhat obvious in a currency pair like the EUR/USD or GBP/USD, as even the strongest data in the world can fail to inspire a rally, provided that there’s even stronger data on the other side of the pair. But, in the US Dollar, where the global reserve is measured as a basket of currencies, commonly the DXY basket, that look can be, at times, confusing.
But as we had looked at in the webinar two weeks ago and then again last week, the failure from sellers to take over after five consecutive weeks of support tests has led into a clear case of bullish control.
US Dollar Weekly Chart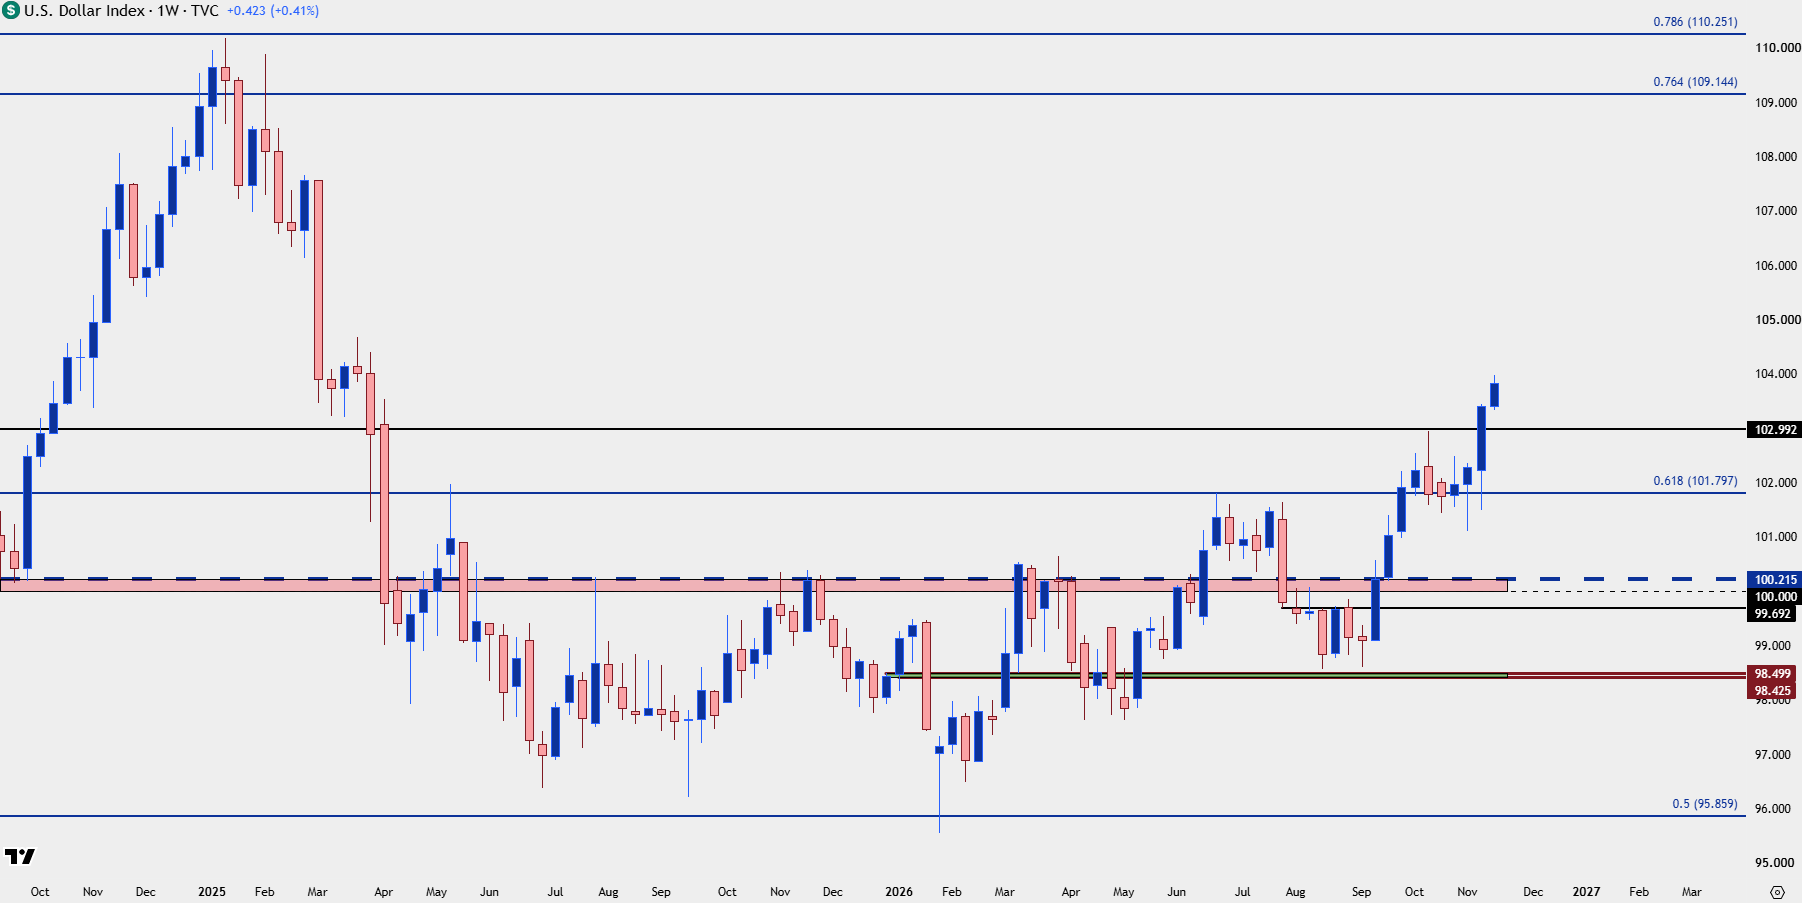
Chart prepared by James Stanley; data derived from Tradingview
EUR/USD
The fall in EUR/USD has been somewhat dramatic over the past few months, as the pair was setting up at the 1.1700 level just back in August and, already, sellers have prodded a 1.1000 break. Along the way, the pair went into oversold territory on the daily but that was just enough to pause the decline. As looked at in the webinar two weeks ago, the resistance hit at 1.1275 highlighted a strong response from sellers, and the mirror image of what that USD chart above showed.
Since then, EUR/USD has now dipped into oversold territory on the weekly chart. The last time this happened, January of 2025, price ultimately set a significant low. But as a case in point to the dangers of a lagging indicator like RSI, the prior instance saw the market repeatedly push into oversold during 2022, as sellers just continued to drive ahead.
EUR/USD Weekly Price Chart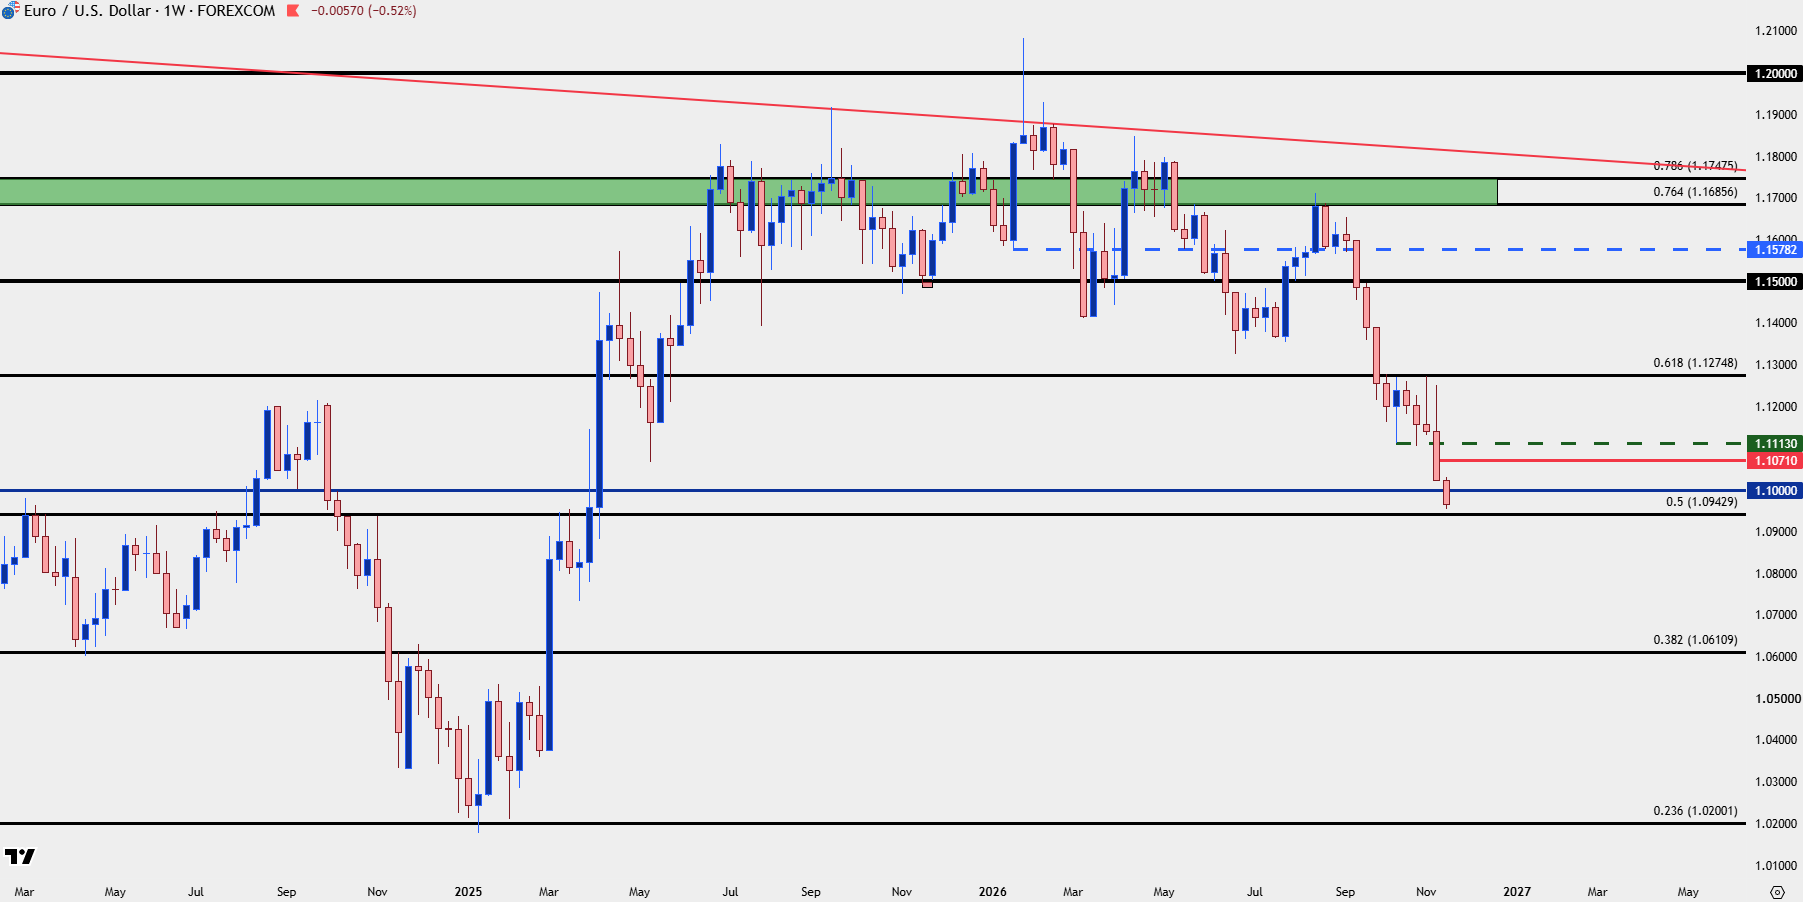
Chart prepared by James Stanley; data derived from Tradingview
EUR/USD Shorter-Term
I wrote about this on Thursday but surprisingly the 1.1000 level was unable to bring any lasting bids to the pair, and sellers just continued to drive until ultimately setting support around 1.0950.
From the four hour chart there’s now a descending triangle, which is a bearish formation, and this keeps the door open for sellers as we go into next week. If we do see a pullback, 1.1000 seems an opportune area to gauge response and 1.1071 and 1.1113 set up above that.
EUR/USD Four-Hour Chart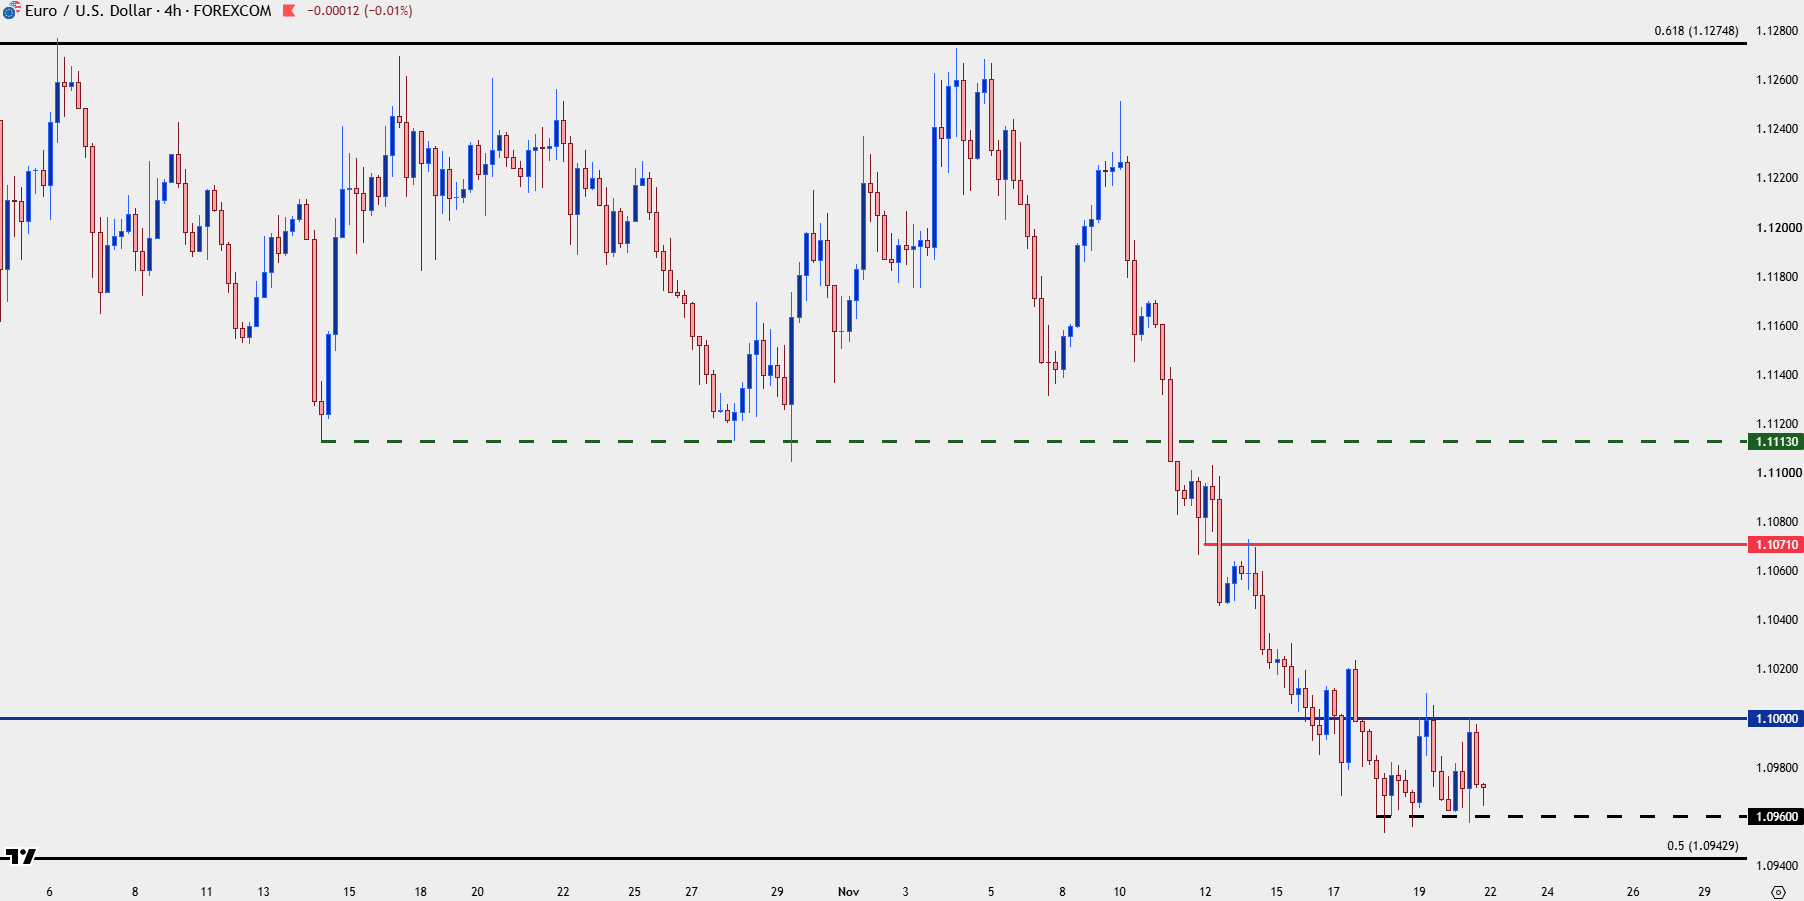
Chart prepared by James Stanley; data derived from Tradingview
GBP/USD
As looked at earlier this week, for USD-weakness themes, whether that’s pullback or reversal, GBP/USD seemed to be the cleanest shirt in the dirty laundry. But even that pair was unable to withstand the drive from Dollar bulls this week, and GBP/USD is now trading at a fresh yearly low.
At this point the weekly chart shows price at the bottom of the current bar and this is the kind of thing that keeps the door open for continuation as we go into next week.
As for support potential, the 1.3000 level stands out, but, realistically, we’re going to need to see a cooling in the current friction before that scenario can be entertained.
GBP/USD Weekly Price Chart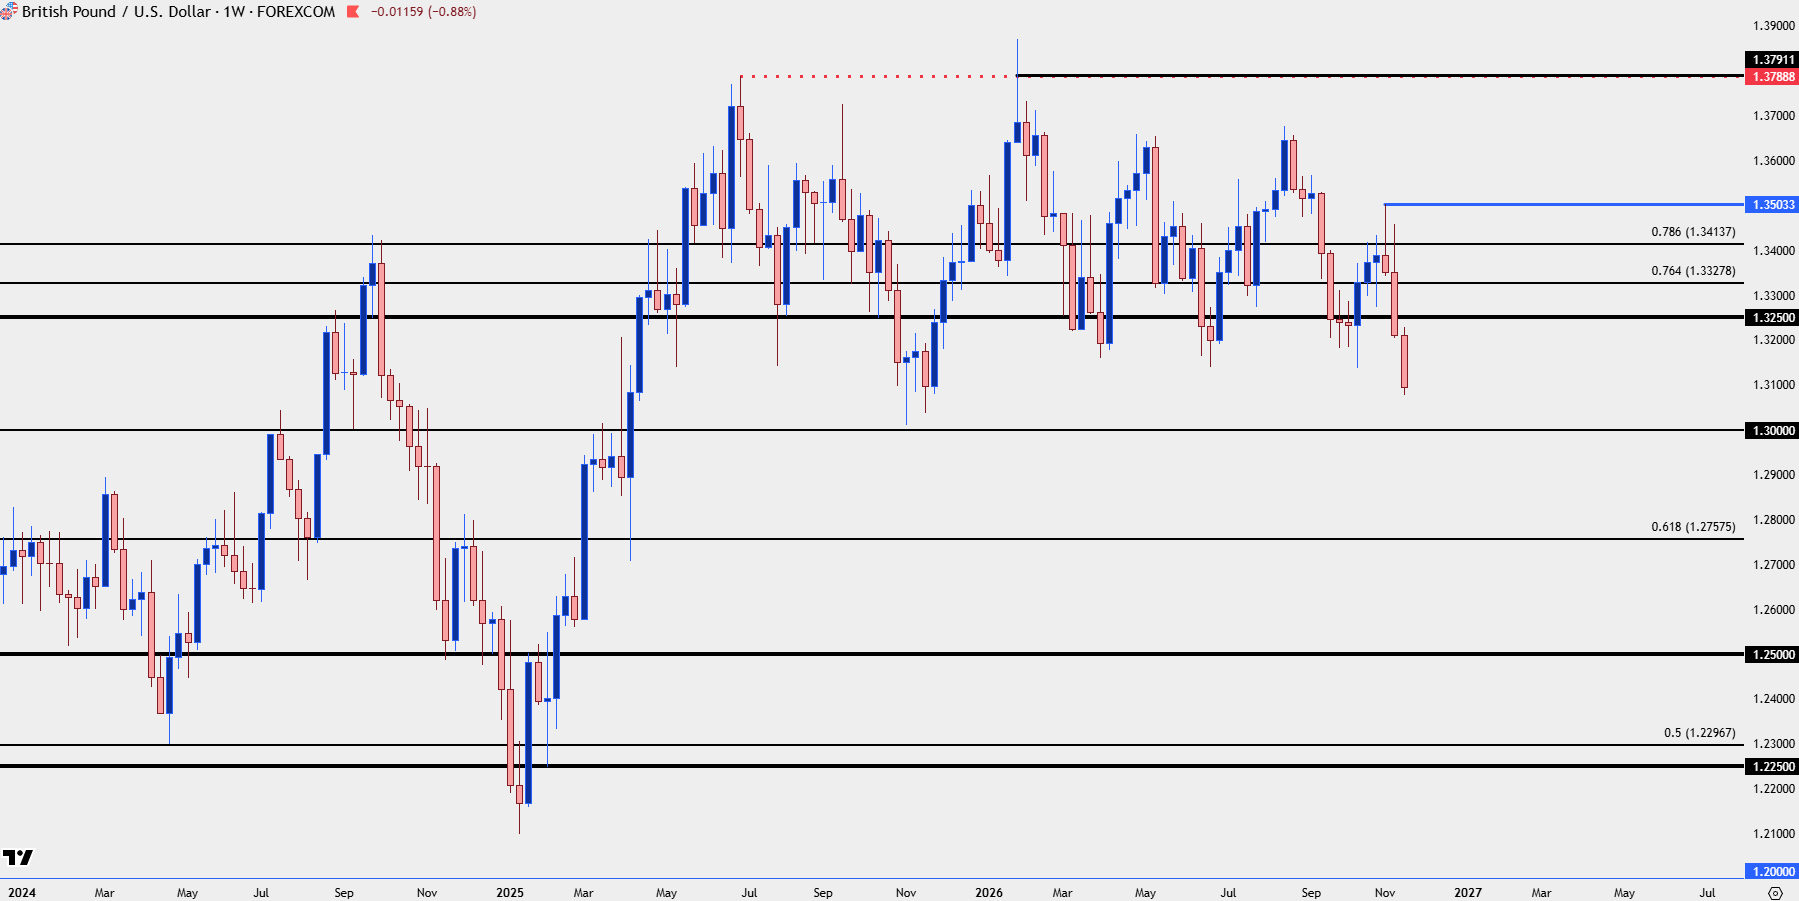
Chart prepared by James Stanley; data derived from Tradingview
USD/JPY
The late-week rally in bonds brought a sizable move into USD/JPY, and I had looked into the pair on Thursday after another test at the 160.00 handle.
The 158.68 level was the final ‘near-term’ support level that I had listed and, so far, that’s held the lows. This remains a key piece of the US Dollar puzzle and as I’ve been highlighting, a wider scale of carry unwind can create significant collateral damage elsewhere, such as stocks.
This also puts front and center the relationship, where a continued rally in bonds brings with it the potential for USD/JPY weakness, and if longer-term bulls that are still holding hedges decide to bail, that can add even more bearish pressure to the pair and, in essence, a global de-leveraging event that could quickly see risk capital evaporate from equity markets.
USD/JPY Daily Chart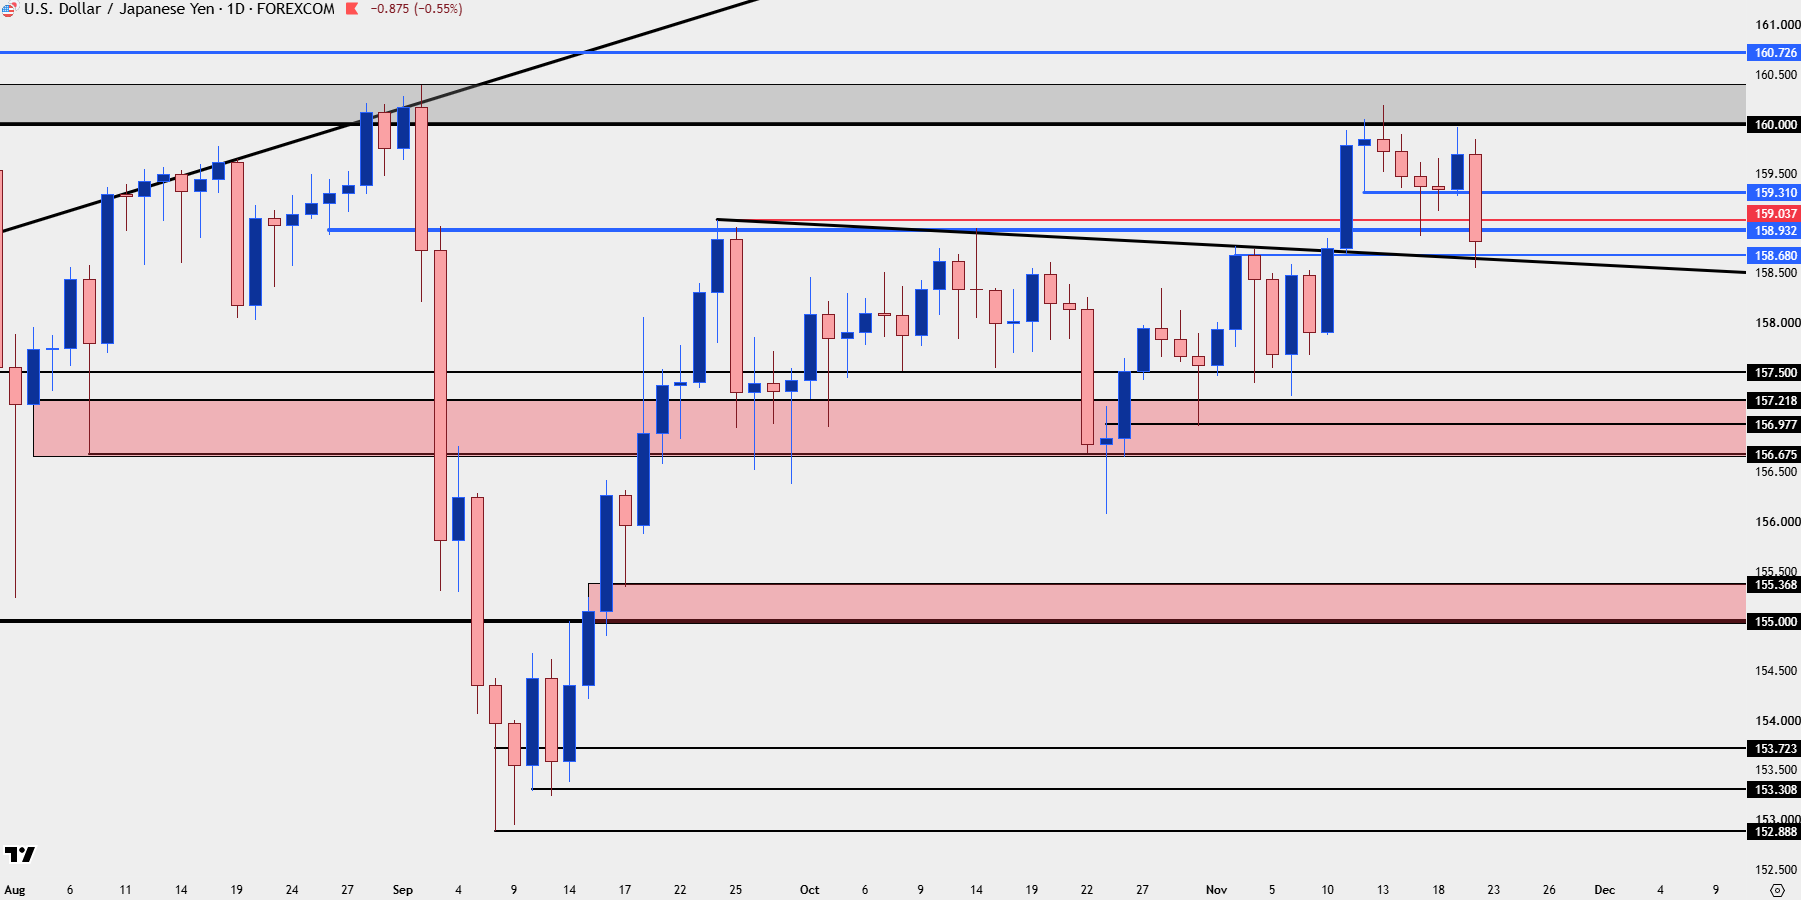
Chart prepared by James Stanley; data derived from Tradingview
--- written by James Stanley, Senior Market Analyst, Global Macro
Latest market news




Open an account in minutes
Experience award-winning platforms with fast and secure execution, and enjoy tight spreads from 0.5 pts on FX and 0.3 pts on indices.
Economic calendar
Web Trader platform
Our sophisticated web-based platform is packed with features.
Related articles
USD/JPY Weekly Outlook: Yen Carry Unwind Risks Flash Red
A historic Nasdaq 100 selloff has revived fears of a disorderly yen carry trade unwind. Yet futures positioning, options pricing and Thanksgiving seasonality suggest the biggest threat to USD/JPY could come from the Fed itself.
US Dollar Freight Train Drives EUR/USD, GBP/USD to Fresh Lows
A hawkish Fed and growing jitters around AI have pushed a continued rally in the Greenback, and there’s not yet an end in sight.
Japanese Yen Forecast: USD/JPY Bulls Falter at Major Resistance—Critical Range Break in Focus 11 20 2026
USD/JPY’s latest retreat puts the September recovery under scrutiny, with nearby support offering bulls their next opportunity to respond.

This report is intended for general circulation only. It should not be construed as a recommendation, or an offer (or solicitation of an offer) to buy or sell any financial products. The information provided does not take into account your specific investment objectives, financial situation or particular needs. Before you act on any recommendation that may be contained in this report, independent advice ought to be sought from a financial adviser regarding the suitability of the investment product, taking into account your specific investment objectives, financial situation or particular needs.
StoneX Financial Pte. Ltd., may distribute reports produced by its respective foreign entities or affiliates within the StoneX group of companies or third parties pursuant to an arrangement under Regulation 32C of the Financial Advisers Regulations. Where the report is distributed to a person in Singapore who is not an accredited investor, expert investor or an institutional investor (as defined in the Securities Futures Act), StoneX Financial Pte. Ltd. accepts legal responsibility to such persons for the contents of the report only to the extent required by law. Singapore recipients should contact StoneX Financial Pte. Ltd. at 6826 9988 for matters arising from, or in connection with the report.
In the case of all other recipients of this report, to the extent permitted by applicable laws and regulations neither StoneX Financial Pte. Ltd. nor its associated companies will be responsible or liable for any loss or damage incurred arising out of, or in connection with, any use of the information contained in this report and all such liability is hereby expressly disclaimed. No representation or warranty is made, express or implied, that the content of this report is complete or accurate.
StoneX Financial Pte. Ltd. is not under any obligation to update this report.
Trading CFDs carries a high level of risk that may not be suitable for some investors. Consider your investment objectives, level of experience, financial resources, risk appetite and other relevant circumstances carefully. The possibility exists that you could lose some or all of your investments, including your initial deposits. If in doubt, please seek independent expert advice. Visit www.forex.com/en-sg/terms-and-policies for the complete Risk Disclosure Statement.