




Canadian Jobs data solid USDCAD
The BOC will take note of the strong employment print, as they are currently the frontrunner to taper monetary policy!
Share this:

The Canadian Employment Change for March was +301,100 vs and expectation of +100,000 and +259,200 in February. The number was strong across the board, with the breakdown split between +175,000 fulltime jobs and +128,000 part time jobs. The level of employment is within 1.5% of February 2020 levels (pre-covid)! In addition, the Unemployment Rate fell from 8% to 7.5%, vs 8% expected. Canada has signaled they may be one of the first to begin tapering their stimulus program, and this number will make the BOC’s decision a little easier. However, Ontario just entered a lockdown and coronavirus cases are rising across the country. The BOC meets on April 21st. They may be more interested in April’s jobs data than March’s.
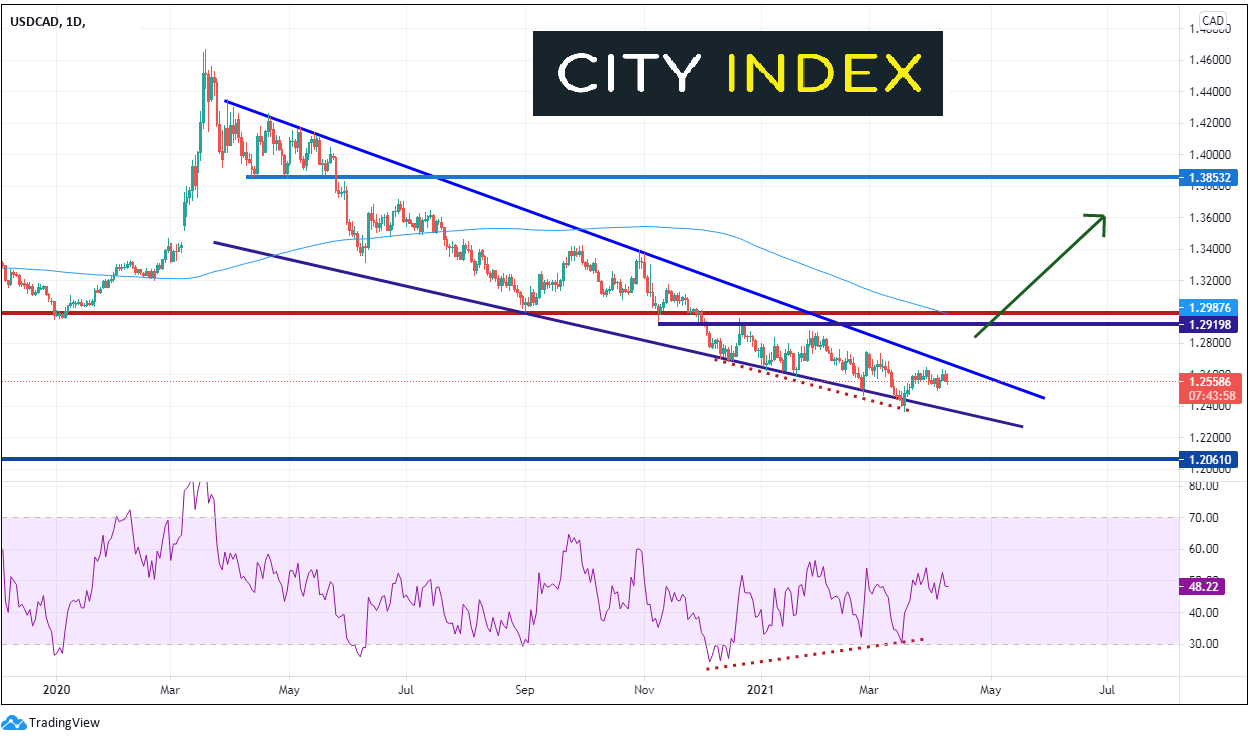
On a daily timeframe, the short-term move lower in USD/CAD on the data release (roughly 30 pips) hasn’t broken any significant levels. The pair has been in a descending wedge since the beginning of the pandemic on March 2020. The RSI became oversold and diverged with price throughout the first quarter of this year, however it has since bounced, and price remains in the wedge. The expectation from a descending wedge is that price will break to the upside. With the RSI back in neutral territory and USD/CAD mid-range with the wedge as it approaches the apex, we may have to wait for the BOC meeting to see a significant move. The top trendline of the wedge crosses at near 1.2675 and the bottom trendline crosses near the March 18th lows near 1.2400.
Source: Tradingview, City Index
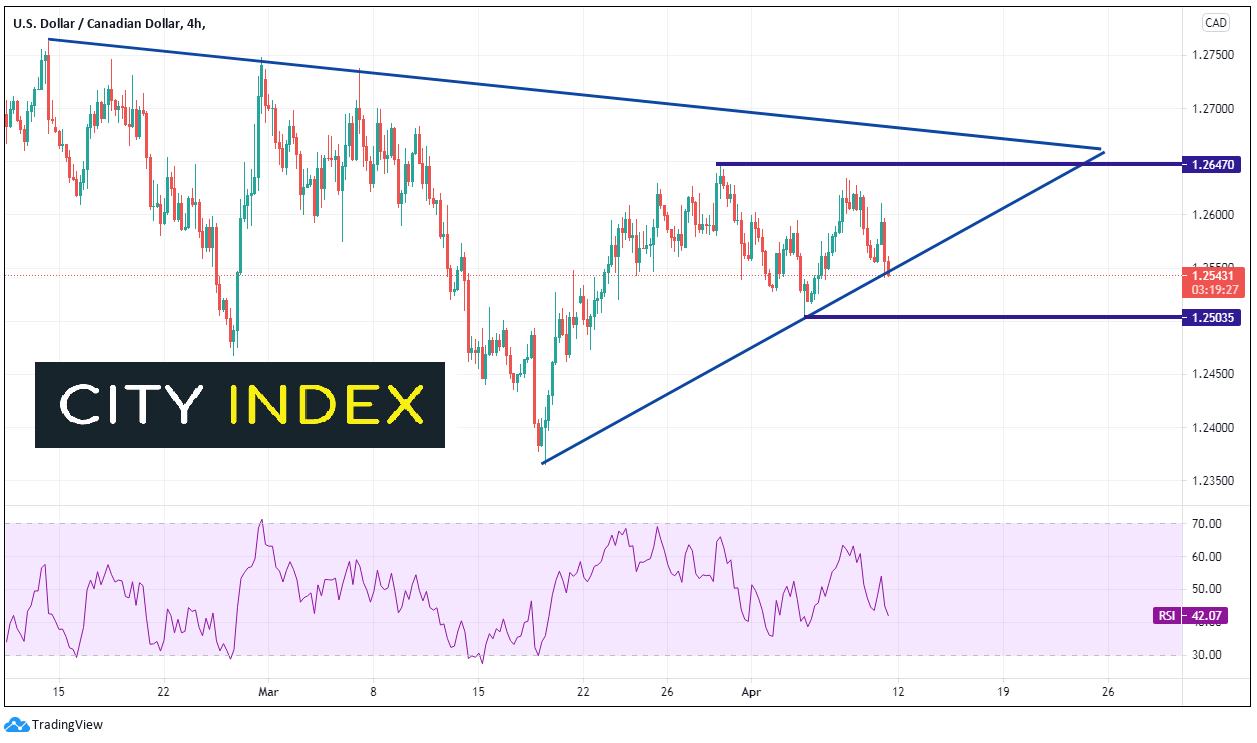
However, on a short-term 240-minute timeframe, the move lower in USD/CAD is threatening to break below the upward sloping trendline of a symmetrical triangle near 1.2540. If price breaks below, the next support is the April 5th lows near 1.2500, ahead of the previously mentioned long-term downward sloping trendline of the wedge on the daily near 1.2400. 1.2365 is the March 18th lows and final support before price can drop to 1.2060 (see daily). Initial resistance is at 1.2647, which is the March 30th highs. Above there is the short-term downward sloping trendline from the symmetrical triangle on the 240-minute timeframe near 1.2680, which confluences with the longer-term trendline from the descending wedge.
Source: Tradingview, City Index
After an earlier delay, the BLS reported US PPI which was stronger than expected. However, the stronger Canadian employment change is outweighing the strong PPI data. Therefore, USD/CAD is offered. As the Fed has said they are not concerned about inflation, the US PPI shouldn’t matter much. However, the BOC will take note of the strong employment print, as they are currently the frontrunner to taper monetary policy!
Learn more about forex trading opportunities.
The Canadian Employment Change for March was +301,100 vs and expectation of +100,000 and +259,200 in February. The number was strong across the board, with the breakdown split between +175,000 fulltime jobs and +128,000 part time jobs. The level of employment is within 1.5% of February 2020 levels (pre-covid)! In addition, the Unemployment Rate fell from 8% to 7.5%, vs 8% expected. Canada has signaled they may be one of the first to begin tapering their stimulus program, and this number will make the BOC’s decision a little easier. However, Ontario just entered a lockdown and coronavirus cases are rising across the country. The BOC meets on April 21st. They may be more interested in April’s jobs data than March’s.
On a daily timeframe, the short-term move lower in USD/CAD on the data release (roughly 30 pips) hasn’t broken any significant levels. The pair has been in a descending wedge since the beginning of the pandemic on March 2020. The RSI became oversold and diverged with price throughout the first quarter of this year, however it has since bounced, and price remains in the wedge. The expectation from a descending wedge is that price will break to the upside. With the RSI back in neutral territory and USD/CAD mid-range with the wedge as it approaches the apex, we may have to wait for the BOC meeting to see a significant move. The top trendline of the wedge crosses at near 1.2675 and the bottom trendline crosses near the March 18th lows near 1.2400.
Source: Tradingview, FOREX.com
However, on a short-term 240-minute timeframe, the move lower in USD/CAD is threatening to break below the upward sloping trendline of a symmetrical triangle near 1.2540. If price breaks below, the next support is the April 5th lows near 1.2500, ahead of the previously mentioned long-term downward sloping trendline of the wedge on the daily near 1.2400. 1.2365 is the March 18th lows and final support before price can drop to 1.2060 (see daily). Initial resistance is at 1.2647, which is the March 30th highs. Above there is the short-term downward sloping trendline from the symmetrical triangle on the 240-minute timeframe near 1.2680, which confluences with the longer-term trendline from the descending wedge.
Source: Tradingview, FOREX.com
After an earlier delay, the BLS reported US PPI which was stronger than expected. However, the stronger Canadian employment change is outweighing the strong PPI data. Therefore, USD/CAD is offered. As the Fed has said they are not concerned about inflation, the US PPI shouldn’t matter much. However, the BOC will take note of the strong employment print, as they are currently the frontrunner to taper monetary policy!
Learn more about forex trading opportunities.
Related tags:
Latest market news




Open an account in minutes
Experience award-winning platforms with fast and secure execution, and enjoy tight spreads from 0.5 pts on FX and 0.3 pts on indices.
Economic calendar
Web Trader platform
Our sophisticated web-based platform is packed with features.
Related articles
AUD/USD outlook: Aussie slips despite hawkish RBA ahead of key data
The AUD/USD was unable to benefit from the Reserve Bank of Australia’s 25-basis-point rate hike overnight. The RBA lifted the cash rate to 4.60%, in line with expectations. However, the Australian dollar weakened following the decision, with much of the Bank’s hawkish stance seemingly priced in ahead of the announcement. The US dollar has also remained largely supported following the recent turmoil in the bond markets.
Canadian Dollar Technical Outlook: USD/CAD Seven-Day Rally Tests Major Resistance 9 29 2026
USD/CAD is pressing into a major technical barrier after an extended advance, raising the risk for price inflection as momentum stretches.

RBA delivers 25bp hike, Bullock now the main event
The RBA delivered the expected 25bp hike, but Bullock’s press conference now looms as the bigger volatility risk for AUD/USD and the ASX 200.

This report is intended for general circulation only. It should not be construed as a recommendation, or an offer (or solicitation of an offer) to buy or sell any financial products. The information provided does not take into account your specific investment objectives, financial situation or particular needs. Before you act on any recommendation that may be contained in this report, independent advice ought to be sought from a financial adviser regarding the suitability of the investment product, taking into account your specific investment objectives, financial situation or particular needs.
StoneX Financial Pte. Ltd., may distribute reports produced by its respective foreign entities or affiliates within the StoneX group of companies or third parties pursuant to an arrangement under Regulation 32C of the Financial Advisers Regulations. Where the report is distributed to a person in Singapore who is not an accredited investor, expert investor or an institutional investor (as defined in the Securities Futures Act), StoneX Financial Pte. Ltd. accepts legal responsibility to such persons for the contents of the report only to the extent required by law. Singapore recipients should contact StoneX Financial Pte. Ltd. at 6826 9988 for matters arising from, or in connection with the report.
In the case of all other recipients of this report, to the extent permitted by applicable laws and regulations neither StoneX Financial Pte. Ltd. nor its associated companies will be responsible or liable for any loss or damage incurred arising out of, or in connection with, any use of the information contained in this report and all such liability is hereby expressly disclaimed. No representation or warranty is made, express or implied, that the content of this report is complete or accurate.
StoneX Financial Pte. Ltd. is not under any obligation to update this report.
Trading CFDs carries a high level of risk that may not be suitable for some investors. Consider your investment objectives, level of experience, financial resources, risk appetite and other relevant circumstances carefully. The possibility exists that you could lose some or all of your investments, including your initial deposits. If in doubt, please seek independent expert advice. Visit www.forex.com/en-sg/terms-and-policies for the complete Risk Disclosure Statement.