



CBA 1H2022 Earnings Preview: Where next for CBA stock?
The Commonwealth Bank of Australia (CBA) is Australia’s largest bank and provides various financial services, including retail, business, institutional banking, funds management, insurance, investment, and broking services. It reports its half-year numbers on the 9th of February.
Share this:

The Australian economic recovery from the covid pandemic extended strongly throughout FY2021, helping CBA to report a 19.8% in FY earnings to $8,653m and on the back of a strong balance sheet declared a fully franked dividend of $2.00 per share, bringing its full-year dividend payout to $3.50.
Putting the icing on the cake for investors, CBA announced a $6 billion off-market share buyback identified as the most efficient and appropriate way to return the surplus capital accumulated to weather the Covid storm.
However, since the end of FY 2021, the Australian economy has been hit by the Delta variant lockdown in NSW, Victoria, and the ACT, before the onset of the Omicron outbreak in mid-December.
In the drive to provide more certainty given prospects of higher interest rates, mortgage borrowers have been opting to fix their repayments. Fixed-rate loans are less profitable than loans fixed at variable rates.
This factor and strong competition in the sector for market share between the big banks and other mortgage lenders are expected to see a contraction in CBA’s net interest margin (NIM). From 2.03% in FY21 to 1.87% in FY22.
CBA has historically traded at a premium to its peers, and is currently trading on a P/E of 20x above the group average of 18x, despite offering a lower dividend yield of 3.73%.
The price premium is based on the belief that CBA has a more loyal shareholder base, is better managed than its peers, its commitment to investment, and holds a superior distribution franchise.
The market consensus is for CBA to report earnings of $4,500m for 1H2022, with an interim dividend payout of $1.81 per share.
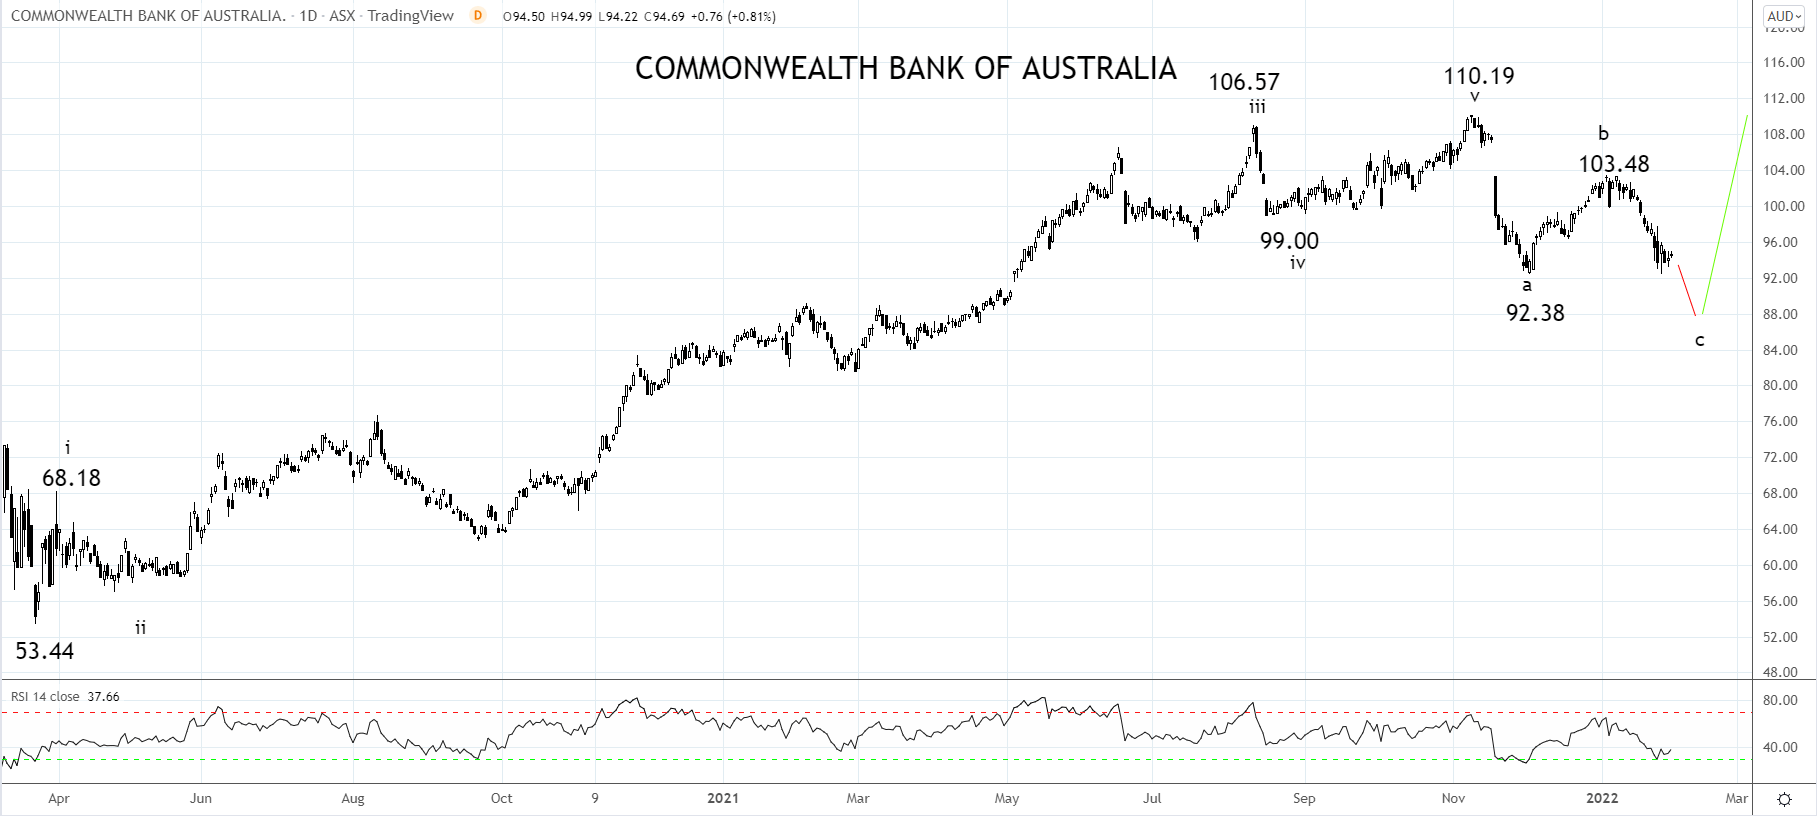
CBA Share Price Chart
In the lead-up to CBA’s report, the share price is trading at $93.93, 7% below where it started the year and over 14% below its November 2021 high of $110.19.
A break of support near $92.30 should see the correction in the share price extend towards wave equality support near $85.00, the preferred level to consider buying CBA.
Source Tradingview. The figures stated areas of the 2nd of February 2022. Past performance is not a reliable indicator of future performance. This report does not contain and is not to be taken as containing any financial product advice or financial product recommendation
How to trade with City Index
You can trade with City Index by following these four easy steps:
- Open an account, or log in if you’re already a customer
• Open an account in the UK
• Open an account in Australia
• Open an account in Singapore
- Search for the company you want to trade in our award-winning platform
- Choose your position and size, and your stop and limit levels
- Place the trade
The Australian economic recovery from the covid pandemic extended strongly throughout FY 2021, helping CBA to report a 19.8% in FY earnings to $8,653m and on the back of a strong balance sheet declared a fully franked dividend of $2.00 per share, bringing its full-year dividend payout to $3.50.
Putting the icing on the cake for investors, CBA announced a $6 billion off-market share buyback identified as the most efficient and appropriate way to return the surplus capital accumulated to weather the Covid storm.
However, since the end of FY 2021, the Australian economy has been hit by the Delta variant lockdown in NSW, Victoria, and the ACT, before the onset of the Omicron outbreak in mid-December.
In the drive to provide more certainty given prospects of higher interest rates, mortgage borrowers have been opting to fix their repayments. Fixed-rate loans are less profitable than loans fixed at variable rates.
This factor and strong competition in the sector for market share between the big banks and other mortgage lenders are expected to see a contraction in CBA’s net interest margin (NIM). From 2.03% in FY21 to 1.87% in FY22.
CBA has historically traded at a premium to its peers, and is currently trading on a P/E of 20x above the group average of 18x, despite offering a lower dividend yield of 3.73%.
The price premium is based on the belief that CBA has a more loyal shareholder base, is better managed than its peers, its commitment to investment, and holds a superior distribution franchise.
The market consensus is for CBA to report earnings of $4,500m for 1H2022, with an interim dividend payout of $1.81 per share.
CBA Share Price Chart
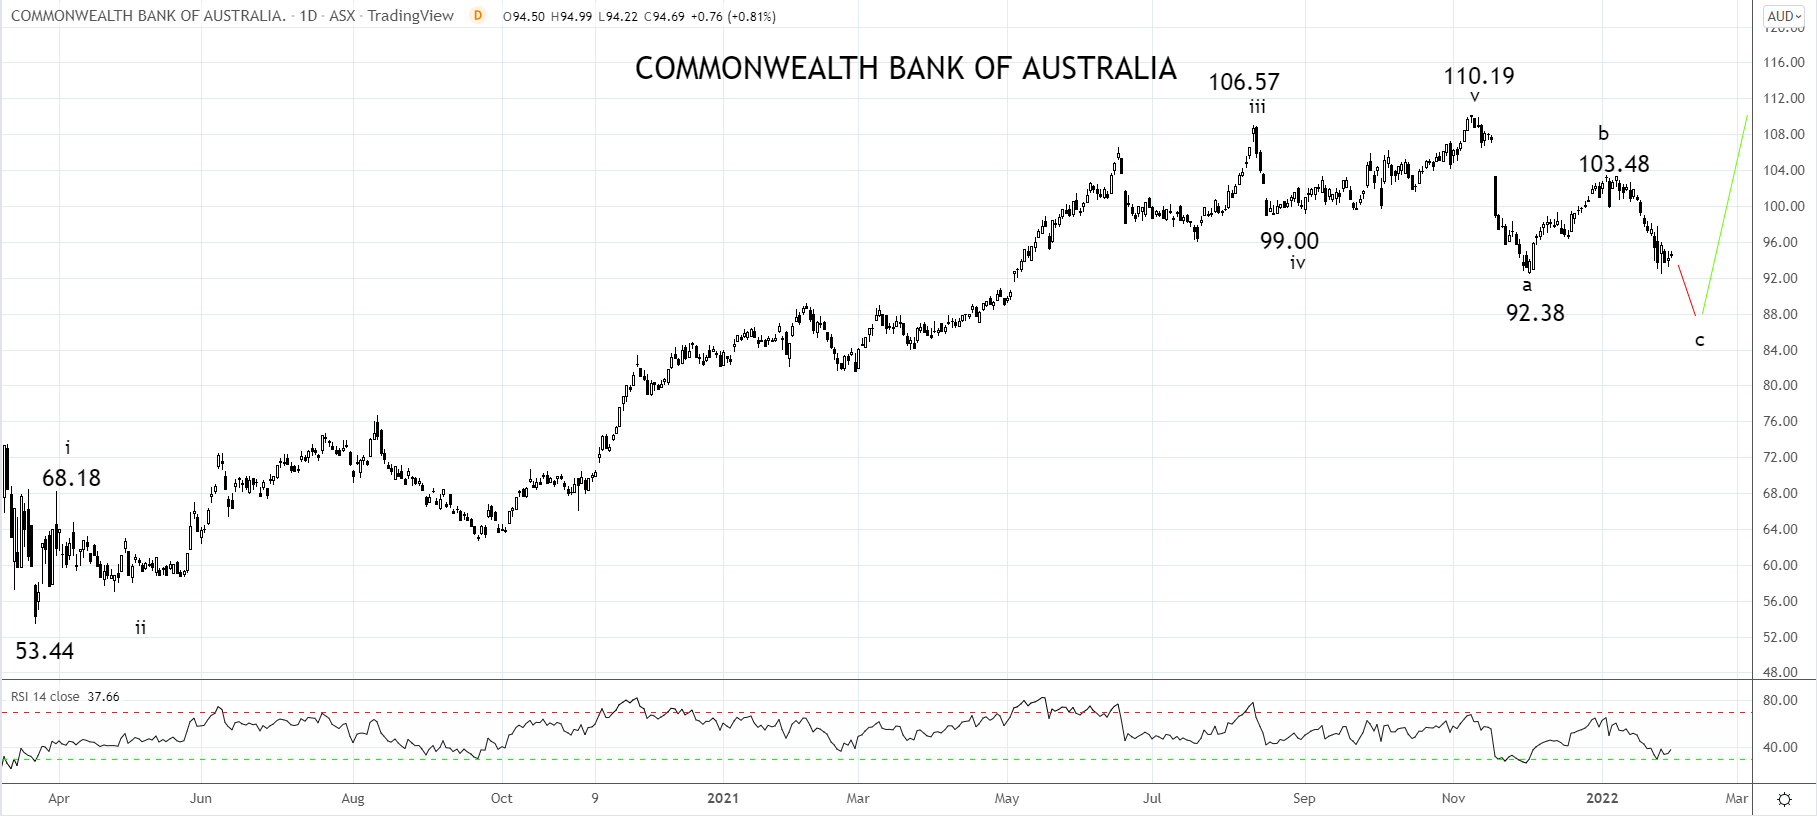
In the lead-up to CBA’s report, the share price is trading at $93.93, 7% below where it started the year and over 14% below its November 2021 high of $110.19.
A break of support near $92.30 should see the correction in the share price extend towards wave equality support near $85.00, the preferred level to consider buying CBA.
Source Tradingview. The figures stated areas of the 2nd of February 2022. Past performance is not a reliable indicator of future performance. This report does not contain and is not to be taken as containing any financial product advice or financial product recommendation
- Open a Forex.com account, or log in if you’re already a customer.
- Search for the pair you want to trade in our award-winning platform.
- Choose your position and size, and your stop and limit levels.
- Place the trade.
Related tags:




Open an account in minutes
Experience award-winning platforms with fast and secure execution, and enjoy tight spreads from 0.5 pts on FX and 0.3 pts on indices.
Economic calendar
Web Trader platform
Our sophisticated web-based platform is packed with features.
Related articles

ASX 200 Slides as Oil, Yields and Rate Risks Hit Sentiment
The ASX 200 suffered its worst week in six months as surging oil, higher bond yields and renewed rate-hike bets drove a broad risk-off move.


GBP/USD, Dow Jones Forecast: Key Technical Scenarios to Watch
GBP/USD and the Dow Jones are approaching critical technical levels amid earning optimism, Fed rate hike expectations, US-Iran developments, and persistent geopolitical risks.

The U.S. Dollar Is Rising Again and Nasdaq Is Feeling It
Nasdaq, the U.S. Dollar Index and Federal Reserve expectations are driving market sentiment ahead of a pivotal FOMC meeting. Razan Hilal, StoneX Market Analyst, explains how rising expectations for a hawkish Federal Reserve, persistent U.S.-Iran tensions and key technical levels on the U.S. Dollar Index could influence currencies, equities and precious metals in the weeks ahead.
This report is intended for general circulation only. It should not be construed as a recommendation, or an offer (or solicitation of an offer) to buy or sell any financial products. The information provided does not take into account your specific investment objectives, financial situation or particular needs. Before you act on any recommendation that may be contained in this report, independent advice ought to be sought from a financial adviser regarding the suitability of the investment product, taking into account your specific investment objectives, financial situation or particular needs.
StoneX Financial Pte. Ltd., may distribute reports produced by its respective foreign entities or affiliates within the StoneX group of companies or third parties pursuant to an arrangement under Regulation 32C of the Financial Advisers Regulations. Where the report is distributed to a person in Singapore who is not an accredited investor, expert investor or an institutional investor (as defined in the Securities Futures Act), StoneX Financial Pte. Ltd. accepts legal responsibility to such persons for the contents of the report only to the extent required by law. Singapore recipients should contact StoneX Financial Pte. Ltd. at 6826 9988 for matters arising from, or in connection with the report.
In the case of all other recipients of this report, to the extent permitted by applicable laws and regulations neither StoneX Financial Pte. Ltd. nor its associated companies will be responsible or liable for any loss or damage incurred arising out of, or in connection with, any use of the information contained in this report and all such liability is hereby expressly disclaimed. No representation or warranty is made, express or implied, that the content of this report is complete or accurate.
StoneX Financial Pte. Ltd. is not under any obligation to update this report.
Trading CFDs carries a high level of risk that may not be suitable for some investors. Consider your investment objectives, level of experience, financial resources, risk appetite and other relevant circumstances carefully. The possibility exists that you could lose some or all of your investments, including your initial deposits. If in doubt, please seek independent expert advice. Visit www.forex.com/en-sg/terms-and-policies for the complete Risk Disclosure Statement.