


Crude Oil 2026 Outlook: Navigating Bearish Channels
Crude oil’s technical landscape is tightening as multi-year bearish channels continue to pressure prices below $60. With the historic 160-year trendline now in focus, the market faces critical decisions around long-term support and the risks of a deeper drawdown into 2026.
Share this:

Crude oil prices are eyeing 2026 from a bearish bias lens, pressured by supply-glut risks and the dominance of a 2-year downtrend extending from the highs of September 2023. Exporter breakeven prices are also at risk, and demand potential and key levels are in sight to confirm levels potentially defining the 2026 outlook.
Key Events
• OPEC is set to hold production output in Q1 2026, projecting a balanced outlook between supply and demand, while the IEA projects a surplus near 4 million barrels per day.
• World economic growth projections are forecasted by the IMF near 3.1%, reflecting moderate resilience and an oil-demand outlook across major economies following the tariff waves.
• Crude prices are pressured below the 60-barrier and benchmarks for key crude-exporting countries, raising outlooks for buy-the-dip opportunities at key levels ahead.
• Geopolitics remains a consistently uncertain element between sanction escalations, tariffs, and peace-deal supply risks.
• Energy transitions continue to evolve and contribute to a lag in crude demand.
Quantifying Uncertainties via Technical Analysis
From a technical perspective, crude oil’s price action has been dominated by a series of down-trending channels since the peaks of 2022. A more prominent and structurally defined descending channel, extending from the highs of September 2023, continues to pressure prices below the 60 level in line with mounting global supply dynamics.
The 160-year trendline, which has supported crude’s higher lows since the 1860s, is now a key area of focus. It may help quantify the potential depth of any further drawdown and identify long-term support levels should the 55 level be decisively breached heading into 2026.
Crude Oil Weekly Outlook: Weekly Time Frame – Log Scale
Source: Trading view
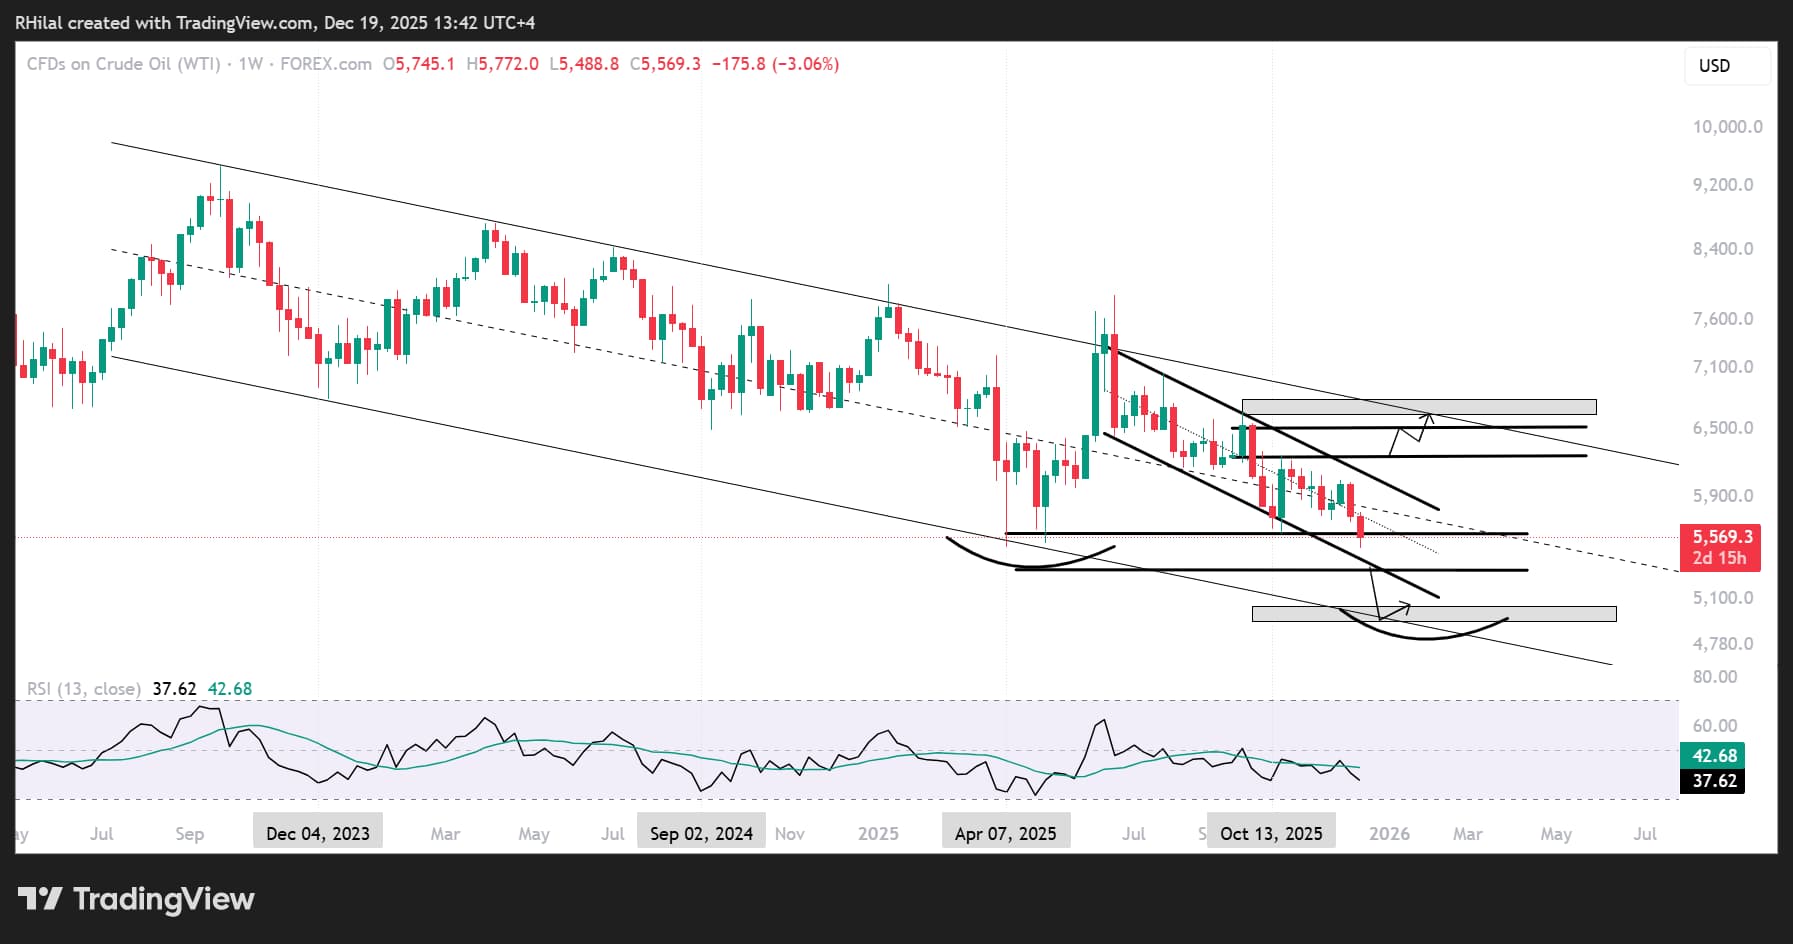
From a weekly-timeframe perspective, crude has been trending within a downward-sloping parallel channel since June 2025, which itself lies within an even broader downtrend dating back to September 2023.
This multi-layered structure reinforces a broader bearish bias and establishes the key levels crude must be clear to transition from short-term fluctuations toward a more constructive long-term outlook.
Upside Structure (Seven-Month Channel)
• 60.50 – Key upside breakout level that crude has been attempting to hold.
• 62.60 – Next major resistance aligned with the upper boundary of the seven-month channel.
• 65 - 66.40 → 68 – A confirmed weekly close above 62.60 could open a path toward the two-year channel boundary at 66.40, then 68, marking early confirmation of a longer-term bullish reversal structure should the trend hold above the channel bounds and 70 psychological level.
Downside Structure
• 55.00 (7-month channel) → 49.00 – A confirmed close below 55 would expose the long-term channel boundary at 49, offering another potential long-term buy-the-dip opportunity.
Crude’s broader structure is leaning toward a potential double-bottom reversal, in line with exporter breakeven price risks, either from the 55 low or the deeper 49 low from the lower 2-year channel border. However, as long as price remains within the down trending channel established since 2023, the overarching bearish bias remains intact.
In terms of Brent
Brent Outlook: Weekly Time Frame – Log Scale
Source: Trading view
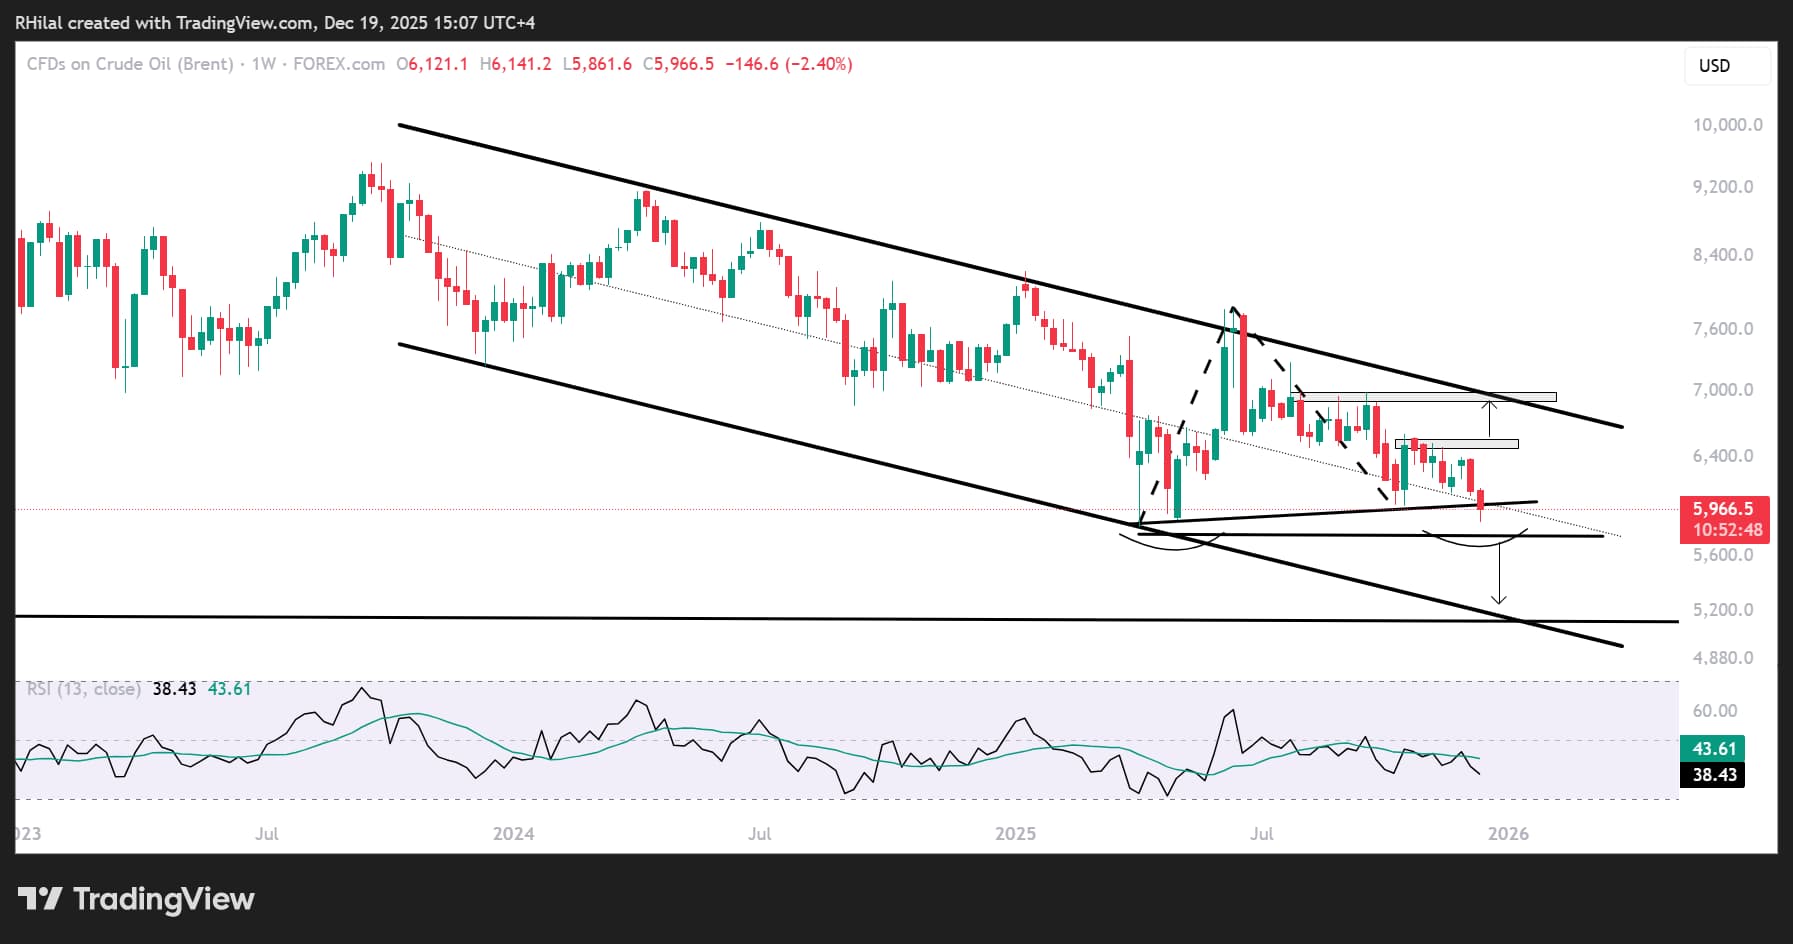
UK oil price action is challenging the mid-zone of a well-respected parallel channel originating in December 2023. Despite remaining in a two-year bearish bias, the short-term structure reflects a neutral-to-bearish hold, consistent with broader market behavior.
Upside Key Levels
A clean hold above 64.70 and 66.00 is expected to align gains with the upper channel boundary and the September 2025 highs near the 69–70 zone — the defining barrier between long-term bullish and bearish bias.
Downside Key Levels
A clear trendline connecting higher lows from April through December 2025 defines the short-term bullish structure; however, price action risks a bearish breakout:
• A close below 59.00 would invalidate this trend, targeting 57.70 for a potential double-bottom setup with the yearly lows.
• Extended losses could drive price toward the lower channel boundary near 52.00, aligning with a possible USOIL decline toward 49 and its respective long-term support zone.
These structural levels remain the primary dividing lines between sustained bearish continuation and a long-awaited bullish transition.
The long-term perspective stands on crude’s overall history, despite a complex mix of geopolitical and macroeconomic drivers, where crude respects an up-trending channel seen on the 3-month time frame since the 1860’s, analyzed here to quantify the 2026 drawdown risks/buy-the-dip opportunities for crude.
Crude Oil Outlook: 3-Month Time Frame – Log Scale

Source: Trading view
From this 3-Month timeframe view, crude’s bearish lean is holding at the bottom bound of a consolidation near the 55-mark. A break below this level may extend losses toward the 0.786 Fibonacci channel ratio at 49, with an extreme scenario near 37, aligning with the 160-year channel boundary, breached only once during COVID before rapidly reversing back into the channel. Long-term upside levels remain near 70 first, and 80 second, in line with crude’s long-term trajectory.
Written by Razan Hilal,
Follow on X: Rh_waves
Related tags:


Open an account in minutes
Experience award-winning platforms with fast and secure execution, and enjoy tight spreads from 0.5 pts on FX and 0.3 pts on indices.
Economic calendar
Web Trader platform
Our sophisticated web-based platform is packed with features.
Related articles
GBP/USD, DJIA Outlook: Support Levels Meet Oversold Risks
GBP/USD and the Dow test key support levels as rising Treasury yields, Fed rate-hike expectations and oversold momentum increase reversal risks.

Oil, USD/JPY Forecast: Two trades to watch
Oil recovers above $90 amid a lack of progress in US-Iran diplomacy. USD/JPY rises to 158 on widening Fed-BoJ policy outlook.

WTI Crude Oil Mulls Bounce from $90
Having fallen 17% from its cycle highs in just five days and now holding above $90, perhaps it could be time for crude oil to bounce over the near term.

This report is intended for general circulation only. It should not be construed as a recommendation, or an offer (or solicitation of an offer) to buy or sell any financial products. The information provided does not take into account your specific investment objectives, financial situation or particular needs. Before you act on any recommendation that may be contained in this report, independent advice ought to be sought from a financial adviser regarding the suitability of the investment product, taking into account your specific investment objectives, financial situation or particular needs.
StoneX Financial Pte. Ltd., may distribute reports produced by its respective foreign entities or affiliates within the StoneX group of companies or third parties pursuant to an arrangement under Regulation 32C of the Financial Advisers Regulations. Where the report is distributed to a person in Singapore who is not an accredited investor, expert investor or an institutional investor (as defined in the Securities Futures Act), StoneX Financial Pte. Ltd. accepts legal responsibility to such persons for the contents of the report only to the extent required by law. Singapore recipients should contact StoneX Financial Pte. Ltd. at 6826 9988 for matters arising from, or in connection with the report.
In the case of all other recipients of this report, to the extent permitted by applicable laws and regulations neither StoneX Financial Pte. Ltd. nor its associated companies will be responsible or liable for any loss or damage incurred arising out of, or in connection with, any use of the information contained in this report and all such liability is hereby expressly disclaimed. No representation or warranty is made, express or implied, that the content of this report is complete or accurate.
StoneX Financial Pte. Ltd. is not under any obligation to update this report.
Trading CFDs carries a high level of risk that may not be suitable for some investors. Consider your investment objectives, level of experience, financial resources, risk appetite and other relevant circumstances carefully. The possibility exists that you could lose some or all of your investments, including your initial deposits. If in doubt, please seek independent expert advice. Visit www.forex.com/en-sg/terms-and-policies for the complete Risk Disclosure Statement.