



Crude Oil Weekly Outlook: Back to the 62 Support
Crude Oil Weekly Outlook: Market risk sentiment continues to swing between geopolitical tensions, supply disruption risks, and oversupply concerns. However, key levels continue to define the main trends despite the volatility.
Share this:

Key Events
• International Energy Week leaned more bearish on supply expectations, reinforcing downside pressure toward the 62 zone.
• US crude inventories rose by 8.5 million barrels, marking the highest levels since February 2025 and confirming short-term surplus conditions.
• While macro sentiment fluctuates, structural technical levels continue to define directional bias.
International Energy Week emphasized growing output expectations rather than demand deterioration. The shift in tone reinforced supply-side pressure at a time when price remains technically vulnerable.
Bearish Structure Remains Dominant Since 2022
The latest inventory data confirmed a surplus of 8.5 million barrels, the first material build of this scale since February 2025. This aligns with the broader structure: crude oil remains within a primary bearish trend established from the 2022 highs.
While counter-trend rebounds have emerged throughout 2023–2025, the dominant descending channel structure has not been invalidated. Every rally continues to face structural resistance.
Crude Oil Inventories 
Source: Forex factory
Price action is now compressing near the 62 support zone, a pivotal level that separates tactical recovery from structural continuation lower.
A sustained hold above 62 maintains a neutral-to-bullish tactical bias. However, confirmation of upside momentum requires a decisive reclaim of 66 — the first structural pivot needed to challenge the broader downtrend.
Technical Analysis: Quantifying Uncertainties
Crude Oil Outlook: Daily Time Frame – Log Scale
Source: Trading view
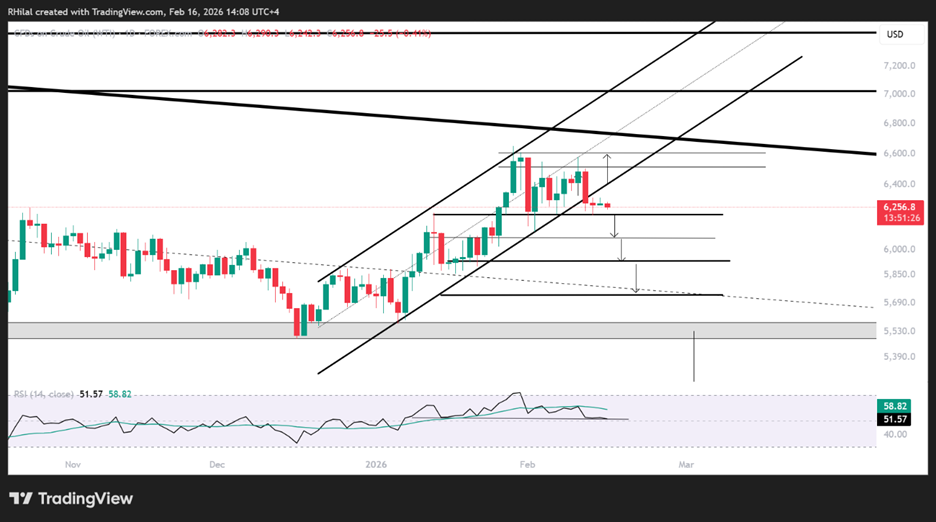
On the daily chart, price is testing the lower boundary of an ascending channel that has been developing since the 2025 lows. This counter-trend structure was supported by geopolitical hedging flows and weather-related demand strength earlier in the year. However, with tensions easing and inventories rising, WTI is now pressuring both the channel support and the 62 horizontal level.
Bearish Scenario
- A sustained break below 62 exposes 60 immediately.
- A confirmed close below 60 opens the path toward 57, the mid-zone of the ascending channel.
- Failure to stabilize there would shift focus toward 55, and in an accelerated downside extension, 49 — the lower boundary of the broader descending channel originating from the 2023 highs.
Bullish Scenario
- If 62 holds and price reclaims 66, upside momentum may build toward 70.50 — the upper boundary of the recent range.
- A sustained breakout above 70.50 would begin challenging the multi-year descending channel resistance, opening the door toward 74.50 and potentially 80, provided momentum indicators maintain constructive structure.
The 66–70.50 zone remains the technical gateway between counter-trend rebound and structural reversal attempt.
Crude Oil Outlook: Weekly Time Frame – Log Scale
Source: Trading view
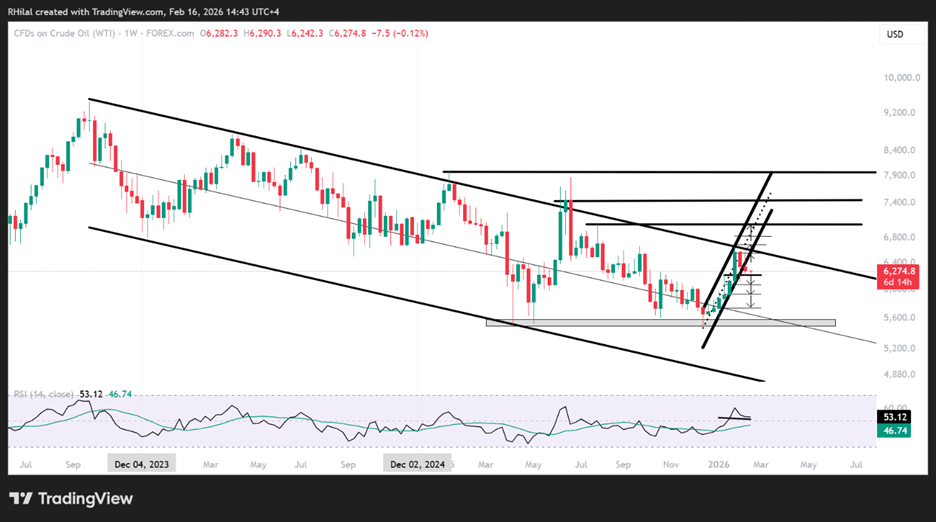
From a weekly perspective, crude oil continues to trade within a descending channel in place since 2023. This remains the defining primary trend, regardless of short-term headline volatility.
The 60–62 zone represents the lower boundary of the recent consolidation range within this broader structure.
Below 60 and 59: The descending channel reasserts dominance, exposing 57, 55, and ultimately 49.
Until a decisive breakout occurs on the weekly timeframe, crude oil remains technically constrained within a multi-year bearish framework.
Written by Razan Hilal, CMT
Follow on X: @Rh_waves
Related tags:
Latest market news




Open an account in minutes
Experience award-winning platforms with fast and secure execution, and enjoy tight spreads from 0.5 pts on FX and 0.3 pts on indices.
Economic calendar
Web Trader platform
Our sophisticated web-based platform is packed with features.
Related articles

WTI crude squeezed between Hormuz risk and diesel ban speculation
WTI is being pulled in opposite directions as Hormuz risk collides with growing political pressure over US diesel prices.

USD/CAD and USD/MXN Q4 2026 Outlook: Will the U.S. Dollar Dominate North America Again?
The final stretch of 2026 is approaching, and North America's major currencies have begun to show a shift in the strength dynamics seen earlier in the year. New expectations of a more aggressive monetary policy stance, particularly in the United States, could be significantly reshaping the outlook for the region. At the same time, this backdrop, combined with potential trade tensions across North America, may become one of the most important drivers of currency performance in the months ahead.


Q4 2026 Bitcoin Outlook: Did the August Rally Mark the Cycle Low?
The outlook for Bitcoin in Q4 is turning cautiously optimistic on the back of renewed ETF purchases, compelling valuations, and an improvement in buy-and-hold behavior among investors - see the full analysis!

This report is intended for general circulation only. It should not be construed as a recommendation, or an offer (or solicitation of an offer) to buy or sell any financial products. The information provided does not take into account your specific investment objectives, financial situation or particular needs. Before you act on any recommendation that may be contained in this report, independent advice ought to be sought from a financial adviser regarding the suitability of the investment product, taking into account your specific investment objectives, financial situation or particular needs.
StoneX Financial Pte. Ltd., may distribute reports produced by its respective foreign entities or affiliates within the StoneX group of companies or third parties pursuant to an arrangement under Regulation 32C of the Financial Advisers Regulations. Where the report is distributed to a person in Singapore who is not an accredited investor, expert investor or an institutional investor (as defined in the Securities Futures Act), StoneX Financial Pte. Ltd. accepts legal responsibility to such persons for the contents of the report only to the extent required by law. Singapore recipients should contact StoneX Financial Pte. Ltd. at 6826 9988 for matters arising from, or in connection with the report.
In the case of all other recipients of this report, to the extent permitted by applicable laws and regulations neither StoneX Financial Pte. Ltd. nor its associated companies will be responsible or liable for any loss or damage incurred arising out of, or in connection with, any use of the information contained in this report and all such liability is hereby expressly disclaimed. No representation or warranty is made, express or implied, that the content of this report is complete or accurate.
StoneX Financial Pte. Ltd. is not under any obligation to update this report.
Trading CFDs carries a high level of risk that may not be suitable for some investors. Consider your investment objectives, level of experience, financial resources, risk appetite and other relevant circumstances carefully. The possibility exists that you could lose some or all of your investments, including your initial deposits. If in doubt, please seek independent expert advice. Visit www.forex.com/en-sg/terms-and-policies for the complete Risk Disclosure Statement.