





DAX outlook: Trade war uncertainty hangs over markets
The trade war has escalated and there is going to be a lot of back and forth from now until the April 2 “liberation day.” Against this backdrop, we will maintain a short-term bearish view on the European markets. The DAX outlook could weaken if we see further support levels break in the coming days, which could accelerate the selling pressure.
Share this:

Following Trump’s announcement of new tariffs last night, the German DAX index staged a sharp decline as concerns were raised about European carmakers and their profitability. And although the markets staged a bit of a recovery after the US open today, and the DAX even managed to erase its earlier losses, it remains to be seen whether markets will stage a meaningful recovery even if a sense of calmness returned to the market. But it could be the calm before the storm. Indeed, safe haven gold has just hit a new record high as trade war uncertainty creates volatility in stock markets. The trade war has escalated and there is going to be a lot of back and forth from now until the April 2 “liberation day.” Against this backdrop, we will maintain a short-term bearish view on the European markets. The DAX outlook could weaken if we see further support levels break in the coming days, which could accelerate the selling pressure.
Car makers take a hit
The trade war has escalated, and an unsurprisingly, German carmakers are leading the declines or are among the biggest decliners today – we saw sharp drops in shares of Porsche, Mercedes, and other carmakers such as BMW and VW.
Technical DAX outlook: Key levels to watch on the daily
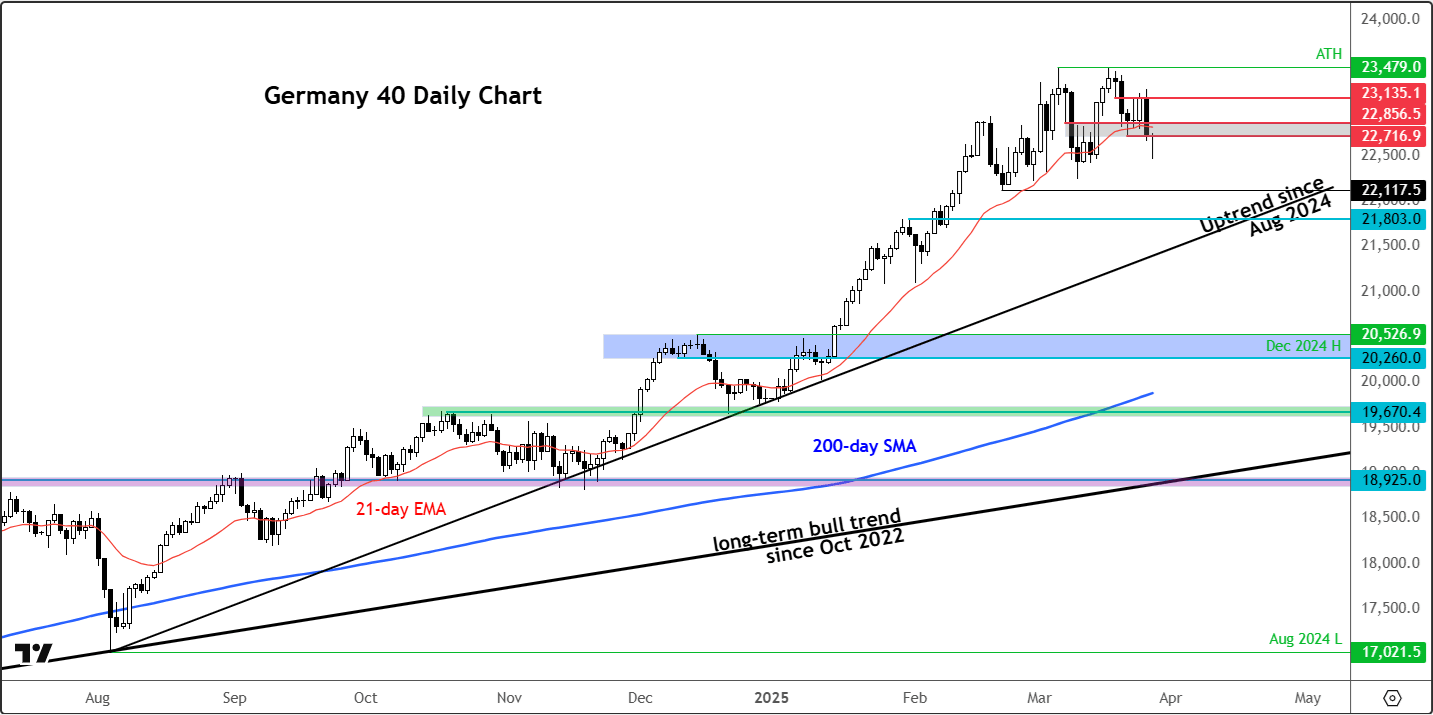
The DAX printed a bearish engulfing candle yesterday on the daily chart, breaking support at 22,856-22,715 area. This level was previously breakout zone from where the index rallied to test its prior all-time high, where it formed a potential double-top pattern. However, this double top pattern has not been confirmed yet since major support levels have not been broken. That could change if selling pressure continues.
For as long as the index now remains below the 22,856-22,715 (shaded grey) area, the path of least resistance will be to the downside, which would point to a bearish technical DAX outlook. If the DAX continues declining, it could break other key levels, such as 22,300, followed by 22,117, before potentially testing a critical trend line. Whether the index will fall all the way to the trend line remains to be seen, especially given the recent approval of a major stimulus package in Germany, which has driven the market higher in recent months. However, the market appears overstretched at these levels.
Now, some key support levels to watch include the area where the trend line from August of last year comes into play. As things stand, this is around 21,800, where the DAX previously encountered resistance before breaking higher. Below that, if the index falls under the bullish trend line, the next key support would be the December highs around 20,526—that would represent a massive drop from current levels. Whether the market reaches that point remains to be seen, but it is currently in extreme overbought conditions and will need to correct either through time or price action.
DAX long-term overbought conditions need to be monitored
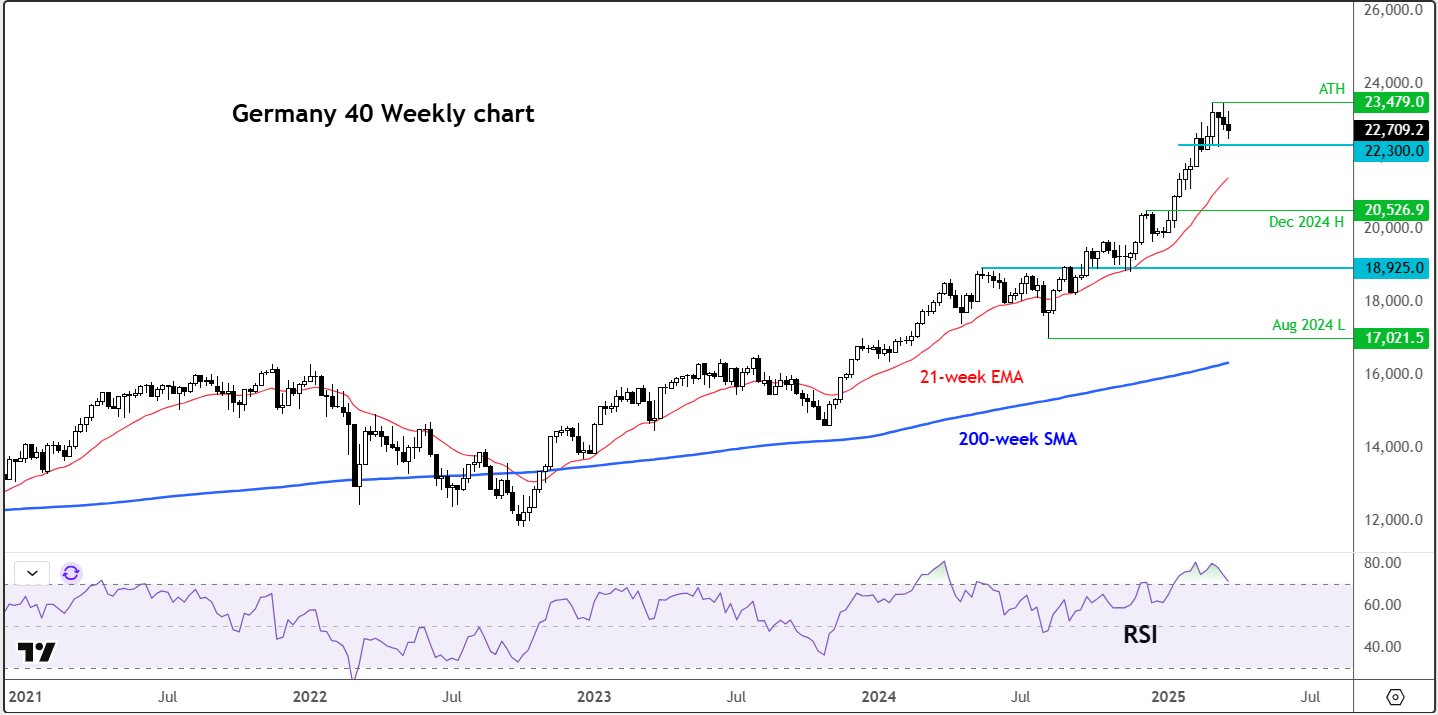
Looking at the long-term charts, the DAX appears expensive. The weekly RSI (Relative Strength Index) has started coming down slightly due to recent consolidation, but it was previously at 80 on the weekly timeframe after a massive rally in the past few months. On the monthly chart, consecutive month-over-month gains have pushed the RSI to extreme overbought levels above 75.
While the RSI on the long term charts has started to decline slightly, it remains above the overbought threshold of 70, meaning the market still needs to unwind. If the RSI unwinds through time—meaning consolidation—it would be a bullish scenario. However, if the market sells off sharply, it would lower RSI levels but be considered a bearish development.
Source for all charts used in this article: TradingView.com
-- Written by Fawad Razaqzada, Market Analyst
Follow Fawad on Twitter @Trader_F_R
How to trade with City Index
You can trade with City Index by following these four easy steps:
- Open an account, or log in if you’re already a customer
• Open an account in the UK
• Open an account in Australia
• Open an account in Singapore
- Search for the company you want to trade in our award-winning platform
- Choose your position and size, and your stop and limit levels
- Place the trade
Related tags:
Latest market news




Open an account in minutes
Experience award-winning platforms with fast and secure execution, and enjoy tight spreads from 0.5 pts on FX and 0.3 pts on indices.
Economic calendar
Web Trader platform
Our sophisticated web-based platform is packed with features.
Related articles
RBA delivers 25bp hike, Bullock now the main event
The RBA delivered the expected 25bp hike, but Bullock’s press conference now looms as the bigger volatility risk for AUD/USD and the ASX 200.
Gold outlook: XAU/USD hammered, stretched and vulnerable to a sharp rebound
Gold is getting hammered for solid fundamental reasons, but history suggests extreme four-hourly oversold conditions can produce violent countertrend rallies.
Gold forecast: Rising yields become too hot for gold, but the outlook is far from bearish
Gold and silver prices took a plunge today, with the former down 3% and the latter falling some 5% by mid European session, before bouncing off their lows. The losses come after the metals remained largely supported until last week, despite the big dollar rally and surging bond yields as we have seen in recent weeks. But it simply got too much, and the metals succumbed to pressure today.
This report is intended for general circulation only. It should not be construed as a recommendation, or an offer (or solicitation of an offer) to buy or sell any financial products. The information provided does not take into account your specific investment objectives, financial situation or particular needs. Before you act on any recommendation that may be contained in this report, independent advice ought to be sought from a financial adviser regarding the suitability of the investment product, taking into account your specific investment objectives, financial situation or particular needs.
StoneX Financial Pte. Ltd., may distribute reports produced by its respective foreign entities or affiliates within the StoneX group of companies or third parties pursuant to an arrangement under Regulation 32C of the Financial Advisers Regulations. Where the report is distributed to a person in Singapore who is not an accredited investor, expert investor or an institutional investor (as defined in the Securities Futures Act), StoneX Financial Pte. Ltd. accepts legal responsibility to such persons for the contents of the report only to the extent required by law. Singapore recipients should contact StoneX Financial Pte. Ltd. at 6826 9988 for matters arising from, or in connection with the report.
In the case of all other recipients of this report, to the extent permitted by applicable laws and regulations neither StoneX Financial Pte. Ltd. nor its associated companies will be responsible or liable for any loss or damage incurred arising out of, or in connection with, any use of the information contained in this report and all such liability is hereby expressly disclaimed. No representation or warranty is made, express or implied, that the content of this report is complete or accurate.
StoneX Financial Pte. Ltd. is not under any obligation to update this report.
Trading CFDs carries a high level of risk that may not be suitable for some investors. Consider your investment objectives, level of experience, financial resources, risk appetite and other relevant circumstances carefully. The possibility exists that you could lose some or all of your investments, including your initial deposits. If in doubt, please seek independent expert advice. Visit www.forex.com/en-sg/terms-and-policies for the complete Risk Disclosure Statement.