





Earnings Guidance will be Watched Closely
Earnings guidance tells us what companies think their future financial “numbers” will look like
Share this:

With Columbus Day today in the US and the US bond markets closed, many market participants have taken the day as a holiday. In addition, Canada is closed for Thanksgiving, Therefore, barring any dramatic tweets or headlines, this afternoon is likely to be a slow one for the US. However, it is the beginning of earnings season this week, and the most important number to watch for the markets will be earnings guidance. (For a preview of earnings season see HERE.) Earnings guidance is important for the markets because it tells us what companies, not outside analysts, think their future financial “numbers” will look like, including sales, spending, and economic outlook.
Banks are most likely to lower guidance due to unexpected lower interest rates (unexpected in a sense that at the last Fed meeting, members were discussing when to halt the “mid-cycle adjustment”). However, with most of the world in a global slowdown, earnings guidance from companies such as Boeing, Caterpillar, ExxonMobil, and Microsoft, will be heavily scrutinized. If earnings guidance is revised lower for many companies, it may pull stock indices lower.
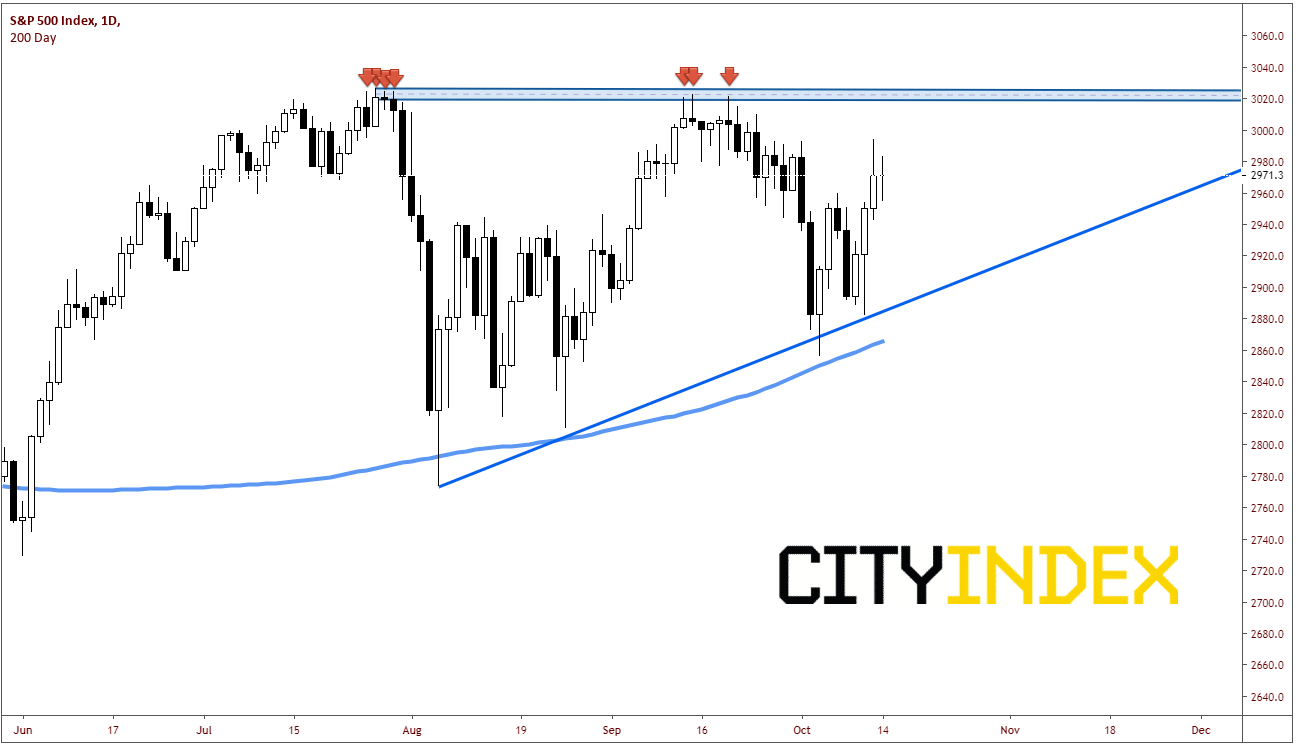
The S&P 500 is trading less than 100 handles from its all-time highs. Despite putting in three higher days in a row, the index is currently trading an inside day and a doji candle, a sign of indecision. Technically, there is strong resistance above at the highs between 3020 and 3027. Below, there is a rising trendline near 2900, as well as, the rising 200 Day Moving Average just below. Price has been putting in higher highs and higher lows since August 6th (hence the rising trendline). The price pattern appears to be an ascending triangle, and theoretically, should break out to the upside.
Source: Tradingview, City Index
However, IF earnings are guided lower, this may act as a catalyst to pull markets lower. And IF price breaks through the upward sloping trendline and the 200 Day Moving Average, the ascending triangle will be negated. On a weekly chart, we can see some of the downside targets that may be achieved:
Source: Tradingview, City Index
There is horizontal support near 2720. Below that, we must look at Fibonacci retracement levels from the low on December 24th to the highs on July 29th for support. The 50% retracement of the move is 2680 and the 61.% retracement is bear 2600. Next level of support is the lows of December 24th at 2335.
Along with the obvious current themes of US-China trade wars and Brexit, earnings guidance must be watched as a catalyst for a move in stock indices. Just another thing to add to the radar, as traders need to be prepared for anything!!
With Columbus Day today in the US and the US bond markets closed, many market participants have taken the day as a holiday. In addition, Canada is closed for Thanksgiving, Therefore, barring any dramatic tweets or headlines, this afternoon is likely to be a slow one for the US. However, it is the beginning of earnings season this week, and the most important number to watch for the markets will be earnings guidance. (For a preview of earnings season see HERE.) Earnings guidance is important for the markets because it tells us what companies, not outside analysts, think their future financial “numbers” will look like, including sales, spending, and economic outlook.
Banks are most likely to lower guidance due to unexpected lower interest rates (unexpected in a sense that at the last Fed meeting, members were discussing when to halt the “mid-cycle adjustment”). However, with most of the world in a global slowdown, earnings guidance from companies such as Boeing, Caterpillar, ExxonMobil, and Microsoft, will be heavily scrutinized. If earnings guidance is revised lower for many companies, it may pull stock indices lower.
The S&P 500 is trading less than 100 handles from its all-time highs. Despite putting in three higher days in a row, the index is currently trading an inside day and a doji candle, a sign of indecision. Technically, there is strong resistance above at the highs between 3020 and 3027. Below, there is a rising trendline near 2900, as well as, the rising 200 Day Moving Average just below. Price has been putting in higher highs and higher lows since August 6th (hence the rising trendline). The price pattern appears to be an ascending triangle, and theoretically, should break out to the upside.
Source: Tradingview, FOREX.com
However, IF earnings are guided lower, this may act as a catalyst to pull markets lower. And IF price breaks through the upward sloping trendline and the 200 Day Moving Average, the ascending triangle will be negated. On a weekly chart, we can see some of the downside targets that may be achieved:
Source: Tradingview, FOREX.com
There is horizontal support near 2720. Below that, we must look at Fibonacci retracement levels from the low on December 24th to the highs on July 29th for support. The 50% retracement of the move is 2680 and the 61.% retracement is bear 2600. Next level of support is the lows of December 24th at 2335.
Along with the obvious current themes of US-China trade wars and Brexit, earnings guidance must be watched as a catalyst for a move in stock indices. Just another thing to add to the radar, as traders need to be prepared for anything!!
Related tags:
Latest market news




Open an account in minutes
Experience award-winning platforms with fast and secure execution, and enjoy tight spreads from 0.5 pts on FX and 0.3 pts on indices.
Economic calendar
Web Trader platform
Our sophisticated web-based platform is packed with features.
Related articles

Dow Jones forecast: How will JPMorgan earnings impact JPM stock?
Can JPMorgan keep outperforming in a tough environment for big banks?


S&P 500 analysis: US banks Q3 earnings preview
Bleaker economic prospects are weighing on the outlook for US banks, but have markets already priced this in?

Dow Jones analysis: Where next for Goldman Sachs stock ahead of Q2 earnings?
Analysts agree this will be another tough quarter for Goldman Sachs, but they disagree on how tough it will be…
This report is intended for general circulation only. It should not be construed as a recommendation, or an offer (or solicitation of an offer) to buy or sell any financial products. The information provided does not take into account your specific investment objectives, financial situation or particular needs. Before you act on any recommendation that may be contained in this report, independent advice ought to be sought from a financial adviser regarding the suitability of the investment product, taking into account your specific investment objectives, financial situation or particular needs.
StoneX Financial Pte. Ltd., may distribute reports produced by its respective foreign entities or affiliates within the StoneX group of companies or third parties pursuant to an arrangement under Regulation 32C of the Financial Advisers Regulations. Where the report is distributed to a person in Singapore who is not an accredited investor, expert investor or an institutional investor (as defined in the Securities Futures Act), StoneX Financial Pte. Ltd. accepts legal responsibility to such persons for the contents of the report only to the extent required by law. Singapore recipients should contact StoneX Financial Pte. Ltd. at 6826 9988 for matters arising from, or in connection with the report.
In the case of all other recipients of this report, to the extent permitted by applicable laws and regulations neither StoneX Financial Pte. Ltd. nor its associated companies will be responsible or liable for any loss or damage incurred arising out of, or in connection with, any use of the information contained in this report and all such liability is hereby expressly disclaimed. No representation or warranty is made, express or implied, that the content of this report is complete or accurate.
StoneX Financial Pte. Ltd. is not under any obligation to update this report.
Trading CFDs carries a high level of risk that may not be suitable for some investors. Consider your investment objectives, level of experience, financial resources, risk appetite and other relevant circumstances carefully. The possibility exists that you could lose some or all of your investments, including your initial deposits. If in doubt, please seek independent expert advice. Visit www.forex.com/en-sg/terms-and-policies for the complete Risk Disclosure Statement.