



EUR/USD, USD/CHF Outlook: The Fed may amplify dollar downside risks
Lower oil prices have already taken some heat out of the dollar. A less hawkish Fed than markets expect could amplify the move.
Share this:

- Lower oil takes heat out of the dollar
- Fed dots may disappoint the hawks
- AI may support growth without inflation
- EUR/USD and USD/CHF reversals may have further to run
Lower oil, lower yields, softer dollar
The balance of risks may be shifting towards further EUR/USD upside and USD/CHF downside, and not just because of progress in peace negotiations between the US and Iran ahead of a signing ceremony slated for Friday.
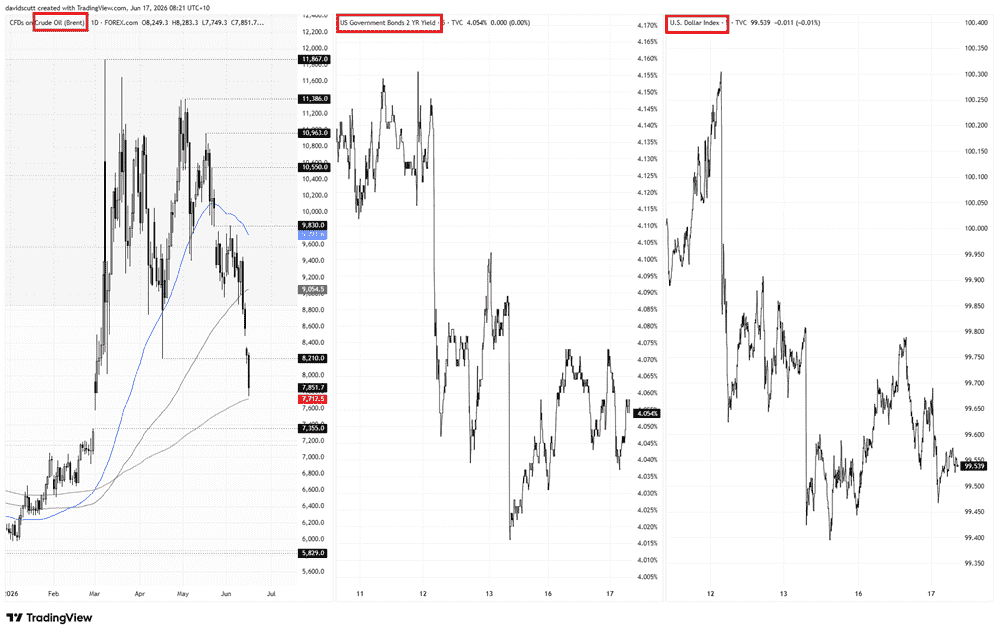
The easing in perceived supply risks has seen investors rapidly unwind the geopolitical premium embedded in energy markets, sending Brent crude sharply lower from recent highs. That, in turn, has helped alleviate concerns about the inflationary consequences of higher oil prices, weighing on US Treasury yields and taking some of the heat out of the greenback.
Source: TradingView
Should this trend continue, which seems likely for now given both sides continue to make all the right noises on the peace front, the reversals in EUR/USD and USD/CHF may still have further to run in the near term.
The dots versus the curve
However, while energy prices may help explain the latest bout of dollar weakness, whether it extends from here may ultimately depend on the Fed.
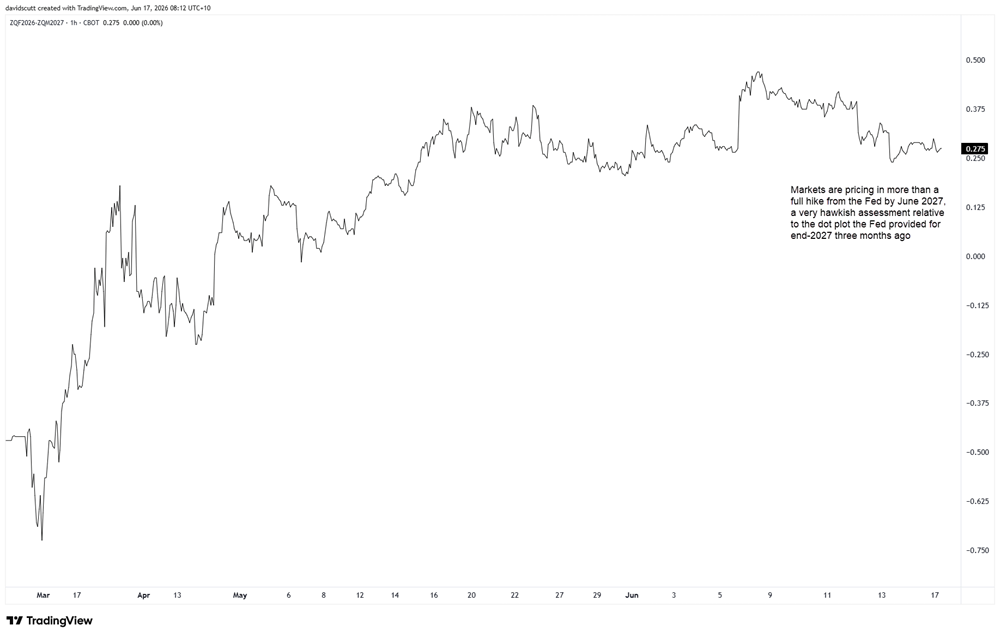
The Fed funds curve out to June 2027 still has 27.5 basis points of hikes priced, as shown in the chart below. That's a very different profile to the last median dot plot estimate published in the Fed's March Summary of Economic Projections, which pointed to two 25 basis point cuts from where the funds rate currently stands by the end of 2027.
Source: TradingView
What markets may be underestimating is the influence continued AI adoption could have on productivity, growth, inflation and, ultimately, the Fed funds rate outlook.
Yes, the AI infrastructure rollout is undoubtedly inflationary in some energy and electrical categories in the near term, but that's hardly a new development. The more important question is whether the productivity gains it eventually delivers allow the US economy to grow at a faster pace without generating the inflationary pressures that would ordinarily accompany such an outcome.
Newly appointed Fed chair Kevin Warsh has been vocal in arguing precisely that. While there's no guarantee the broader FOMC will fall in behind his view, the March Summary of Economic Projections suggests at least some members may already subscribe to a similar view. Despite the inflationary implications stemming from the war at the time, the median year-end growth projections were revised higher, suggesting at least some members believed the economy could continue to expand at a solid pace while unemployment remained low.
While the Fed will likely abandon its easing bias given remarks from influential FOMC members such as Governor Christopher Waller in the period since it last met, such an outcome is already widely expected by markets. As such, that's why the updated dot plot may struggle to come across as hawkish as markets currently have priced.
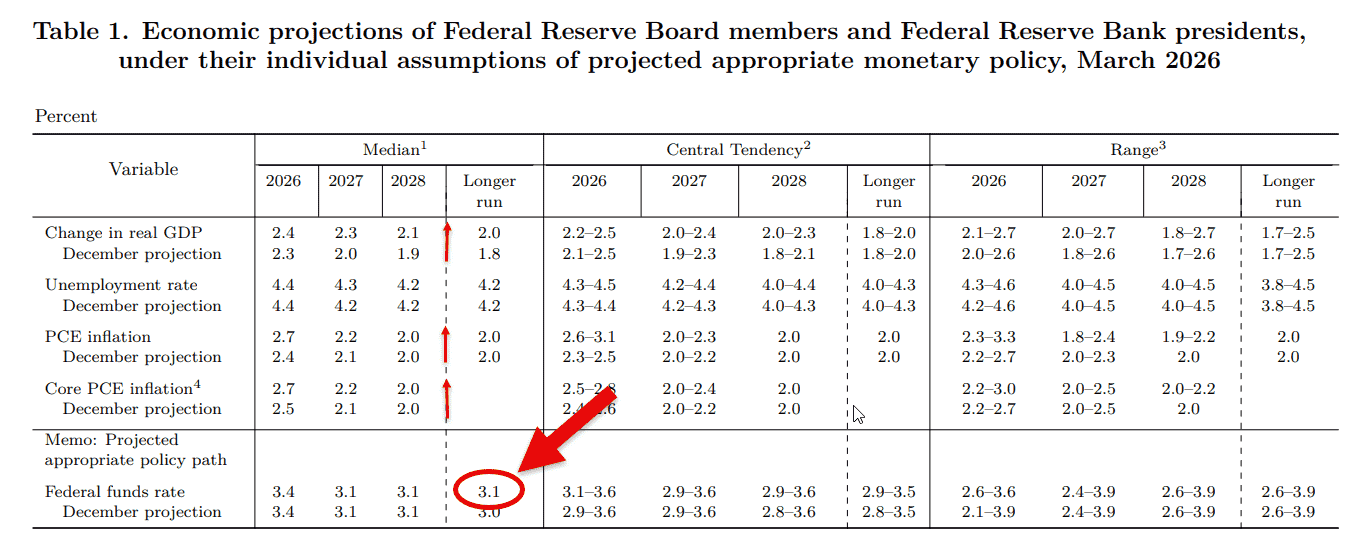
Even if the Committee signals a willingness to remain on hold for longer, it would be surprising to see the median participant suddenly conclude that neutral rates sit around the current fed funds rate of 3.50-3.75%. Back in March, the median dot still pointed to one cut this year and next, with the longer-run fed funds rate sitting at 3.1%.
Source: Federal Reserve
As the Fed's projections above show, modest easing beyond the near term may still prove the more likely outcome. If so, the 27.5 basis points of hikes currently priced into the fed funds curve out to June 2027 may need to be unwound, adding to the downside risks facing the dollar.
This content was created by an affiliate of FOREX.com and represents the views and opinions of the author/speakers, not the views and opinions of FOREX.com, StoneX Group Inc., or its subsidiaries. The content has not been independently reviewed by FOREX.com.
The rates link
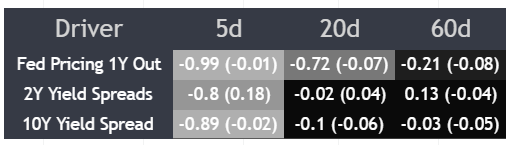
As seen in the correlation matrix below, there's been a strong and sustained inverse relationship between the amount of tightening priced by the Fed over the coming year and EUR/USD in recent weeks. The 20-day rolling correlation currently sits at -0.72, while the five-day measure has strengthened to an eye-catching -0.99, highlighting just how sensitive the pair has become to shifts in the US rates outlook.
Source: TradingView
In simple terms, as markets have unwound expectations for nearly two Fed hikes over the coming year, EUR/USD has rallied. While that largely reflects the easing in crude markets and the associated decline in US Treasury yields discussed earlier, it arguably doesn't capture the possibility that the Fed itself may struggle to come across as hawkish as markets expect later today.
Should that prove to be the case, it would provide another potential tailwind for EUR/USD alongside those already emanating from lower energy prices and an improving outlook for Europe.
EUR/USD: A formidable barrier looms
Source: TradingView
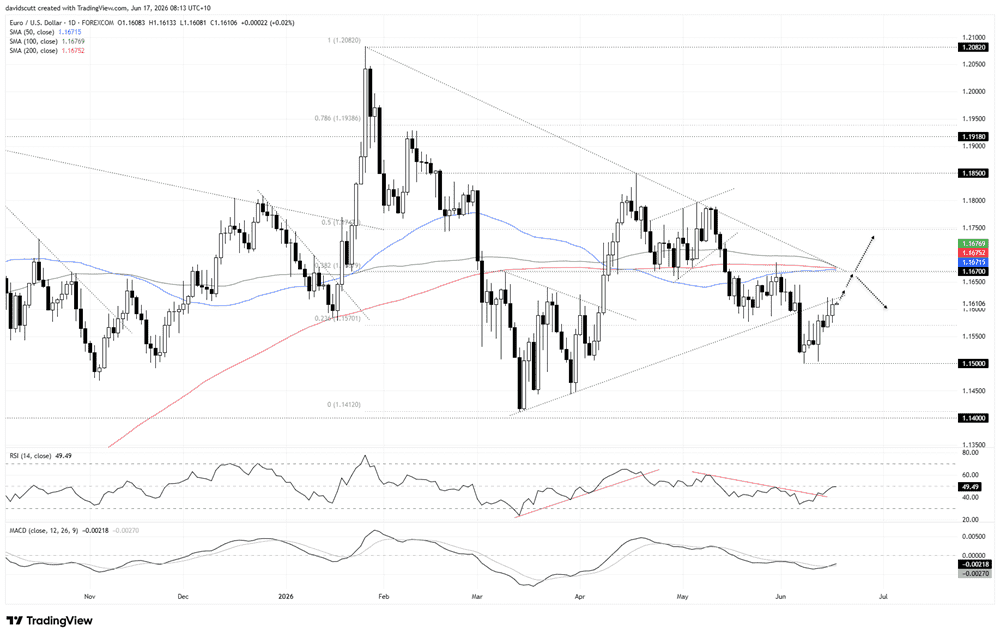
The technical picture for EUR/USD has turned more constructive for bulls over the past fortnight, with the pair rebounding from 1.1500 support to test the uptrend running from the lows set back in March. It previously acted as support within a broader compression structure prior to being broken, and the fact the price has now tried and failed on two separate occasions to close above it suggests it remains relevant for traders.
However, as the pair flirts with that level, the true test for bulls lies further overhead with an ominous resistance zone comprising each of the key medium and longer-term moving averages, the 38.2% Fibonacci retracement of the January-March bear move, along with 1.1670 which has offered both support and resistance for lengthy periods throughout much of this year. Throw in downtrend resistance from the former compression structure and it looms as a significant barrier for upside, meaning that even if my theory regarding the Fed rate outlook proves correct, it's no guarantee it will deliver immediate, substantial gains.
However, if the price were to break above the top of the zone at 1.1677, it would break the sequence of lower highs, adding to the risk we may see a run towards 1.1750 or 1.1850 resistance.
Like recent price action, the message from the oscillators has also shifted. Not long ago, downside momentum was building, but that's now completely fallen away. RSI (14) is trending higher and is now back at the neutral 50 level, while MACD has just staged a crossover of the signal line and is diverging towards positive territory. It's not a slam-dunk case for bulls, but it suggests directional risks are now far more balanced than they were just a week or so ago.
Should the latest corrective bounce stall around these levels, the 23.6% Fibonacci retracement of the January-March bear move at 1.1570 should be on the radar, along with where it began at 1.1500 support.
Fed, not SNB
Like the message from the EUR/USD matrix, the Fed interest rate story is also highly relevant to USD/CHF traders given the similarities across continental Europe, with that far more likely to move the dial than the Swiss National Bank's rate decision on Thursday.
No change in policy is expected from the SNB, and unlike earlier in the year when concerns about excessive franc strength and the potential for intervention lingered in the background, neither appears an especially pressing issue right now. With inflation subdued and the franc not displaying the type of appreciation that would ordinarily concern policymakers, the external backdrop screens as far more important.
USD/CHF: Bears probe support
Source: TradingView
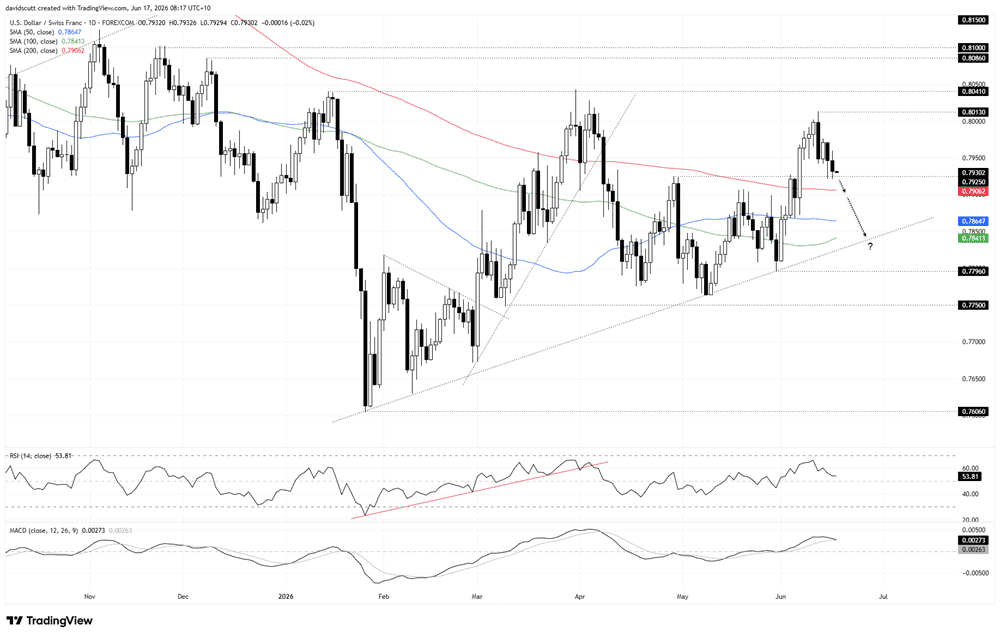
USD/CHF delivered a bearish key reversal candle on Thursday last week, kicking off a slow downward grind ahead of both rate decisions. The pair now finds itself testing former resistance at 0.7925, making it the immediate downside level in focus.
Underneath, bears face a zone comprising the 200, 50 and 100-day moving averages below, in that order, before uptrend support comes into view around 0.7830. For mine, the 200-day moving average is the one to watch, although it's notable how selective the price has been in reacting to all three going back several months. With the geopolitical environment potentially creating less headline risk, the fleeting interactions may become more consistent in the near term.
If the January uptrend were to be broken, 0.7796 and 0.7750 are the levels underneath to watch. Should the price be unable to break beneath 0.7925 support, last week's high of 0.8013 becomes relevant on the upside.
The message from the oscillators is now largely neutral, favouring a similar directional bias. RSI (14) is almost back at 50 having rolled over, while MACD is on the cusp of crossing over from above while remaining in negative territory. Momentum is shifting away from the bulls, but it's not yet with the bears.
Latest market news




Open an account in minutes
Experience award-winning platforms with fast and secure execution, and enjoy tight spreads from 0.5 pts on FX and 0.3 pts on indices.
Economic calendar
Web Trader platform
Our sophisticated web-based platform is packed with features.
Related articles
AUD/USD Q4 Outlook: RBA and Fed Hikes Set the Tone
AUD/USD enters Q4 with RBA and Fed hikes in focus as sticky inflation, rising unemployment and US dollar strength shape the Australian dollar.
USD/JPY Q4 2026 Outlook: Hawkish Fed Pricing Clashes With Intervention Risk
The year-end tug-of-war is clear: hawkish Fed pricing supports USD/JPY, while intervention risk limits the upside.
USD/CAD and USD/MXN Q4 2026 Outlook: Will the U.S. Dollar Dominate North America Again?
The final stretch of 2026 is approaching, and North America's major currencies have begun to show a shift in the strength dynamics seen earlier in the year. New expectations of a more aggressive monetary policy stance, particularly in the United States, could be significantly reshaping the outlook for the region. At the same time, this backdrop, combined with potential trade tensions across North America, may become one of the most important drivers of currency performance in the months ahead.

This report is intended for general circulation only. It should not be construed as a recommendation, or an offer (or solicitation of an offer) to buy or sell any financial products. The information provided does not take into account your specific investment objectives, financial situation or particular needs. Before you act on any recommendation that may be contained in this report, independent advice ought to be sought from a financial adviser regarding the suitability of the investment product, taking into account your specific investment objectives, financial situation or particular needs.
StoneX Financial Pte. Ltd., may distribute reports produced by its respective foreign entities or affiliates within the StoneX group of companies or third parties pursuant to an arrangement under Regulation 32C of the Financial Advisers Regulations. Where the report is distributed to a person in Singapore who is not an accredited investor, expert investor or an institutional investor (as defined in the Securities Futures Act), StoneX Financial Pte. Ltd. accepts legal responsibility to such persons for the contents of the report only to the extent required by law. Singapore recipients should contact StoneX Financial Pte. Ltd. at 6826 9988 for matters arising from, or in connection with the report.
In the case of all other recipients of this report, to the extent permitted by applicable laws and regulations neither StoneX Financial Pte. Ltd. nor its associated companies will be responsible or liable for any loss or damage incurred arising out of, or in connection with, any use of the information contained in this report and all such liability is hereby expressly disclaimed. No representation or warranty is made, express or implied, that the content of this report is complete or accurate.
StoneX Financial Pte. Ltd. is not under any obligation to update this report.
Trading CFDs carries a high level of risk that may not be suitable for some investors. Consider your investment objectives, level of experience, financial resources, risk appetite and other relevant circumstances carefully. The possibility exists that you could lose some or all of your investments, including your initial deposits. If in doubt, please seek independent expert advice. Visit www.forex.com/en-sg/terms-and-policies for the complete Risk Disclosure Statement.