









EUR/USD, USD/JPY, S&P 500: Bond Bears Bite as Markets Reset Tariff Risks
Markets swung hard after Lutnick’s late bombshell on tariffs, fueling a powerful squeeze in risk assets. Bond bulls are suddenly on the ropes, EUR/USD has broken out, and S&P 500 futures are clinging to key support. Is this a turning point, or just another violent twist in the trade spat?
Share this:

- Bond bulls lose grip as U.S. 10-year Treasury futures post a bearish engulfing candle, signaling a potential top
- EUR/USD rips higher, clearing 1.0600 as dollar weakness, military spending, and technical buying fuel gains
- USD/JPY rebounds sharply, with a bullish pin candle pointing to test of resistance at 151
- S&P 500 futures bounce, but a close below the 200DMA could open the door to deeper losses
- Tariff fears ease after U.S. Commerce Secretary Howard Lutnick hints at a potential deal with Canada and Mexico.
Summary
Get set for a risk rebound in Asia—perhaps even a risk rip—after U.S. Commerce Secretary Howard Lutnick’s post-market remarks on Tuesday sparked a partial unwind of recent tariff concerns.
Just hours after Washington slapped fresh 25% tariffs on Canadian and Mexican imports, Lutnick dropped a bombshell on Fox Business, suggesting Donald Trump may be open to a compromise by meeting both nations halfway on tariffs. He said a deal would probably be announced Wednesday.
Markets reacted sharply, with equity index futures squeezing higher while bond futures slid. Currencies battered by tariff uncertainty extended earlier gains, led by EUR/USD which surged 1.3%.
Call it the latest iteration of the Trump “put” or proof that tariffs remain a negotiating tactic rather than a done deal—either way, Lutnick’s comments (assuming Trump doesn’t contradict them) have eased some of the risk ahead of major U.S. data on Wednesday, including the ISM services PMI and ADP jobs report, which land just two days before non-farm payrolls.
Weakening data and fears that tariffs would choke economic activity had weighed on risk assets, but this temporary reprieve may be enough to lift sentiment for now.
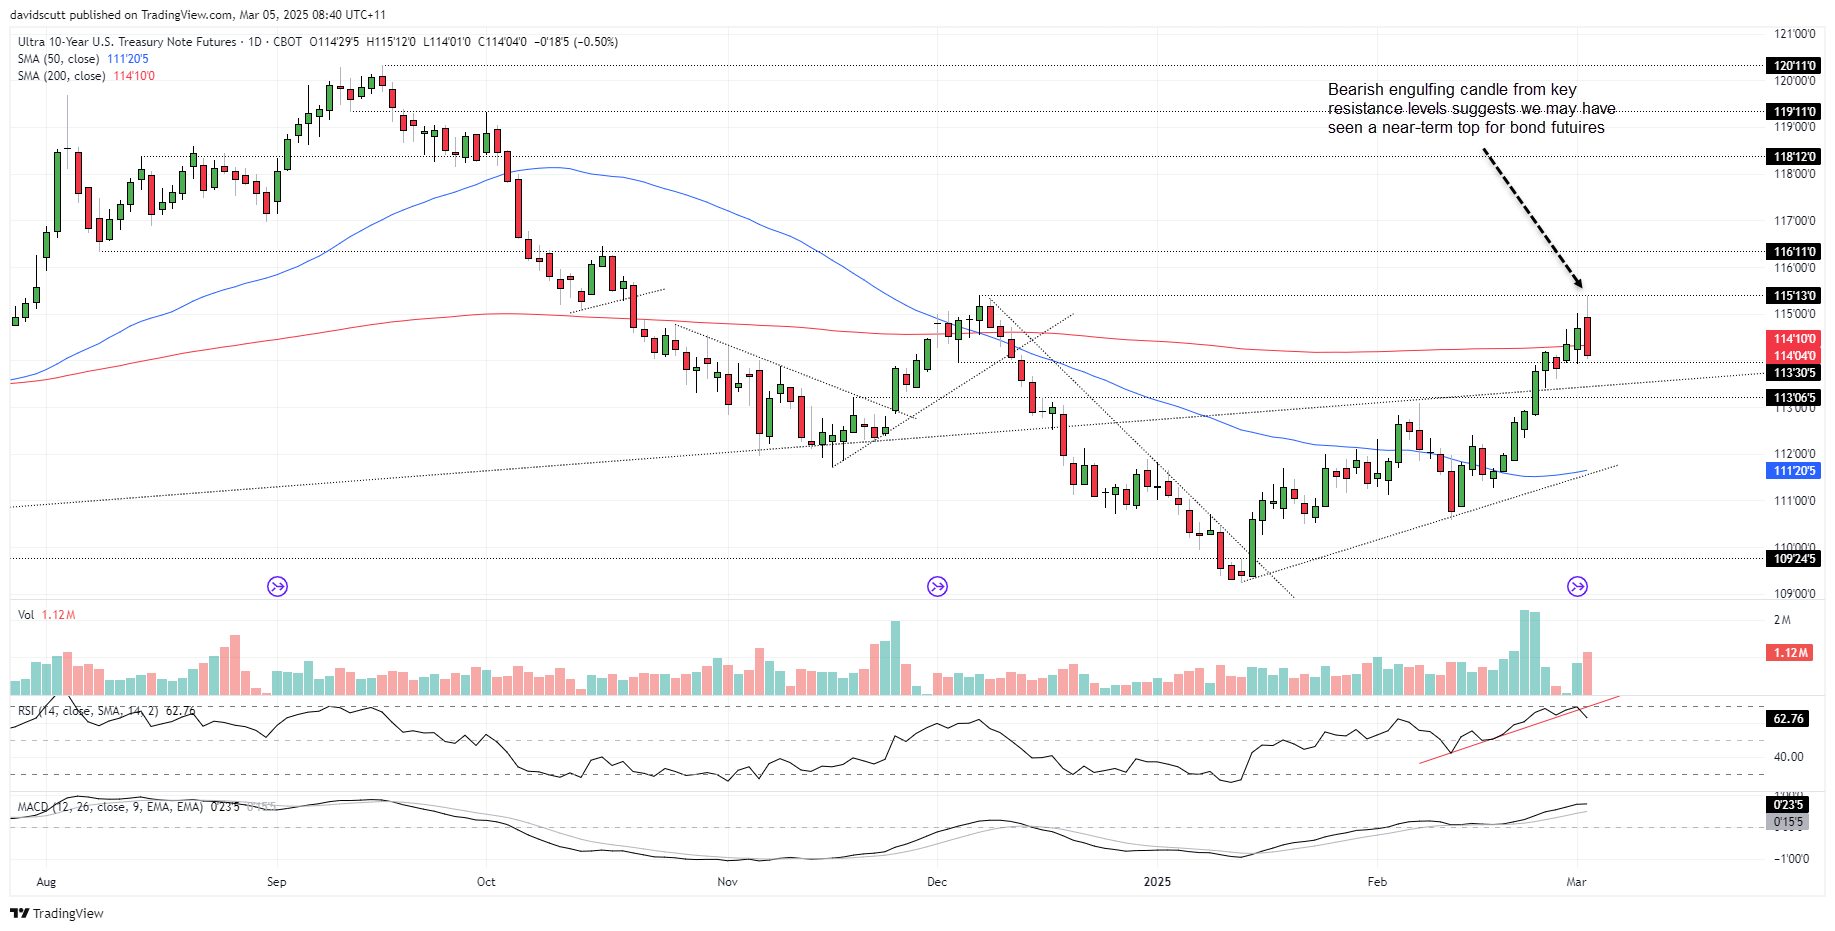
Benchmark Bond Futures Signal Turning Point
Source: TradingView
The above chart tracks U.S. 10-year Treasury note futures. Until Tuesday, it had been a rich hunting ground for long bond bulls. However, price and momentum signals over the past 24 hours suggest we may have seen a near-term top for bond prices—implying the opposite for yields.
The failure to break above the December 2024 swing highs was followed by a sharp reversal, delivering a bearish engulfing candle on the daily timeframe. While a cluster of known support levels sits just below, the close beneath the 200DMA and RSI (14) breaking its uptrend point to a growing risk that the bullish trend has run its course. That means trades premised on lower U.S. Treasury yields may need to be reassessed in the near term.
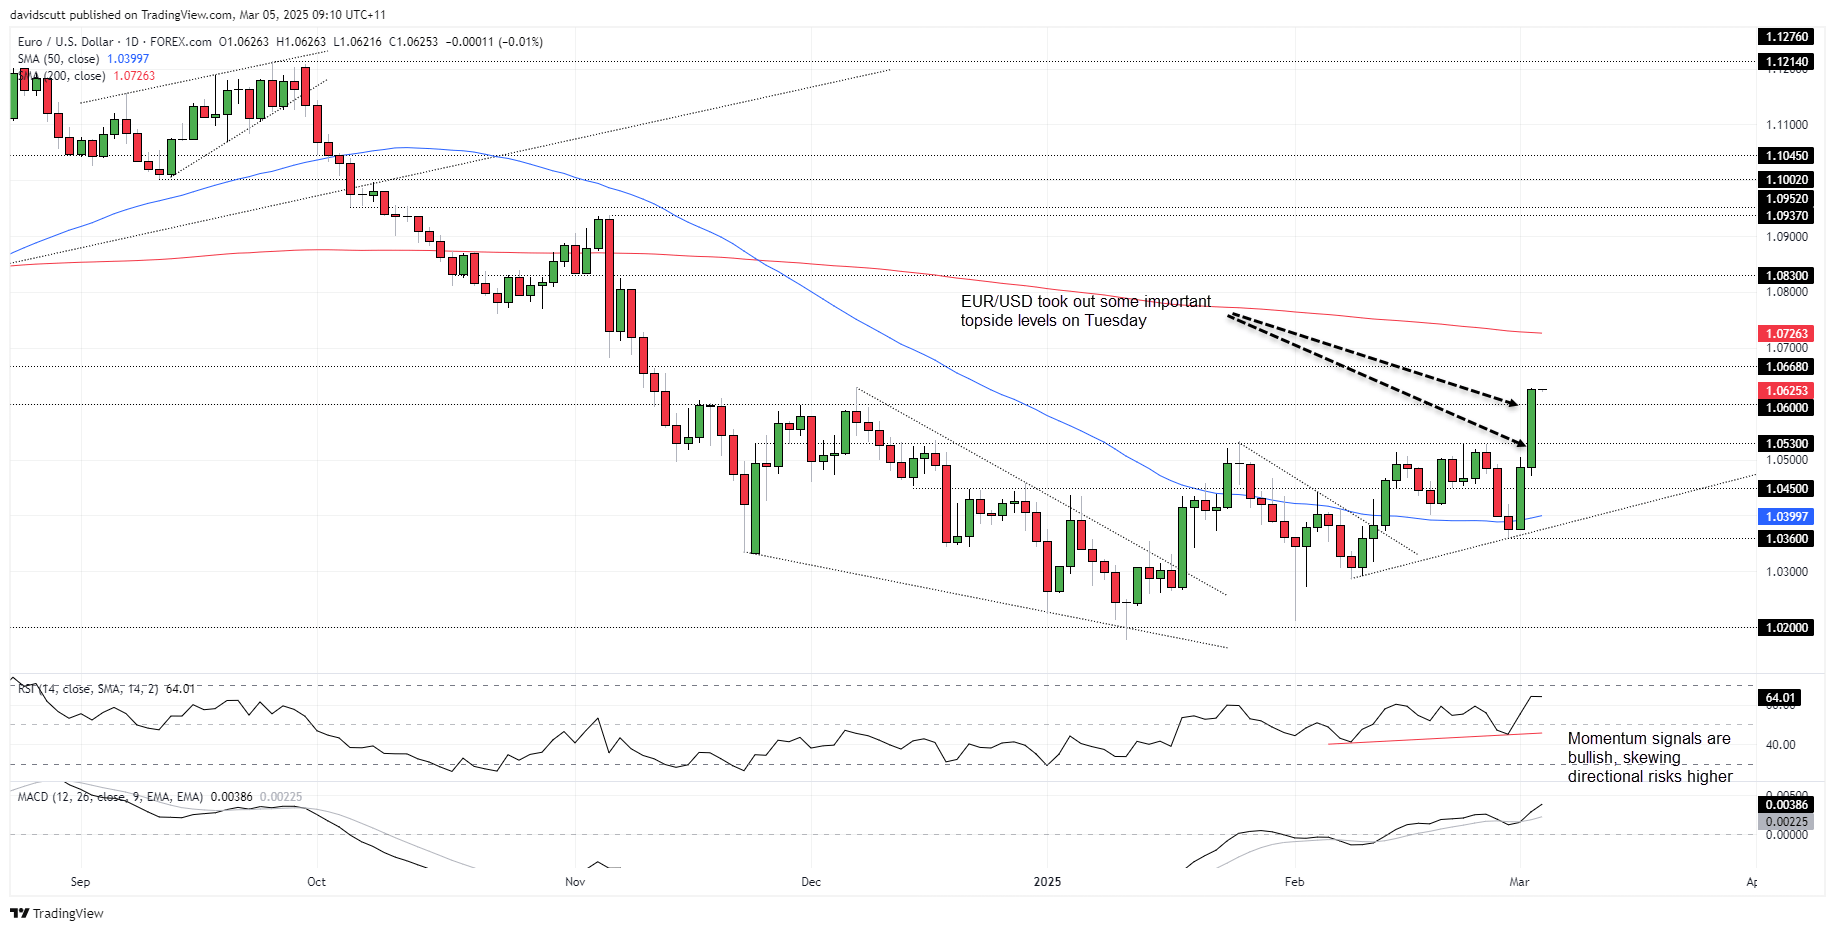
EUR/USD Delivers Powerful Bullish Break
Source: TreadingView
The topside break in EUR/USD flagged on Tuesday came to fruition in style, with dollar weakness, increased European military spending, and technical buying overwhelming sellers parked from 1.05-1.0530. The common currency eventually pushed through resistance at 1.0600.
That level may now act as support, offering a platform for bulls targeting an extension towards the next layer of resistance at 1.0668, followed by the 200-day moving average. Momentum remains with the bulls, with RSI (14) and MACD signals favouring buying dips over selling rips in the near term.
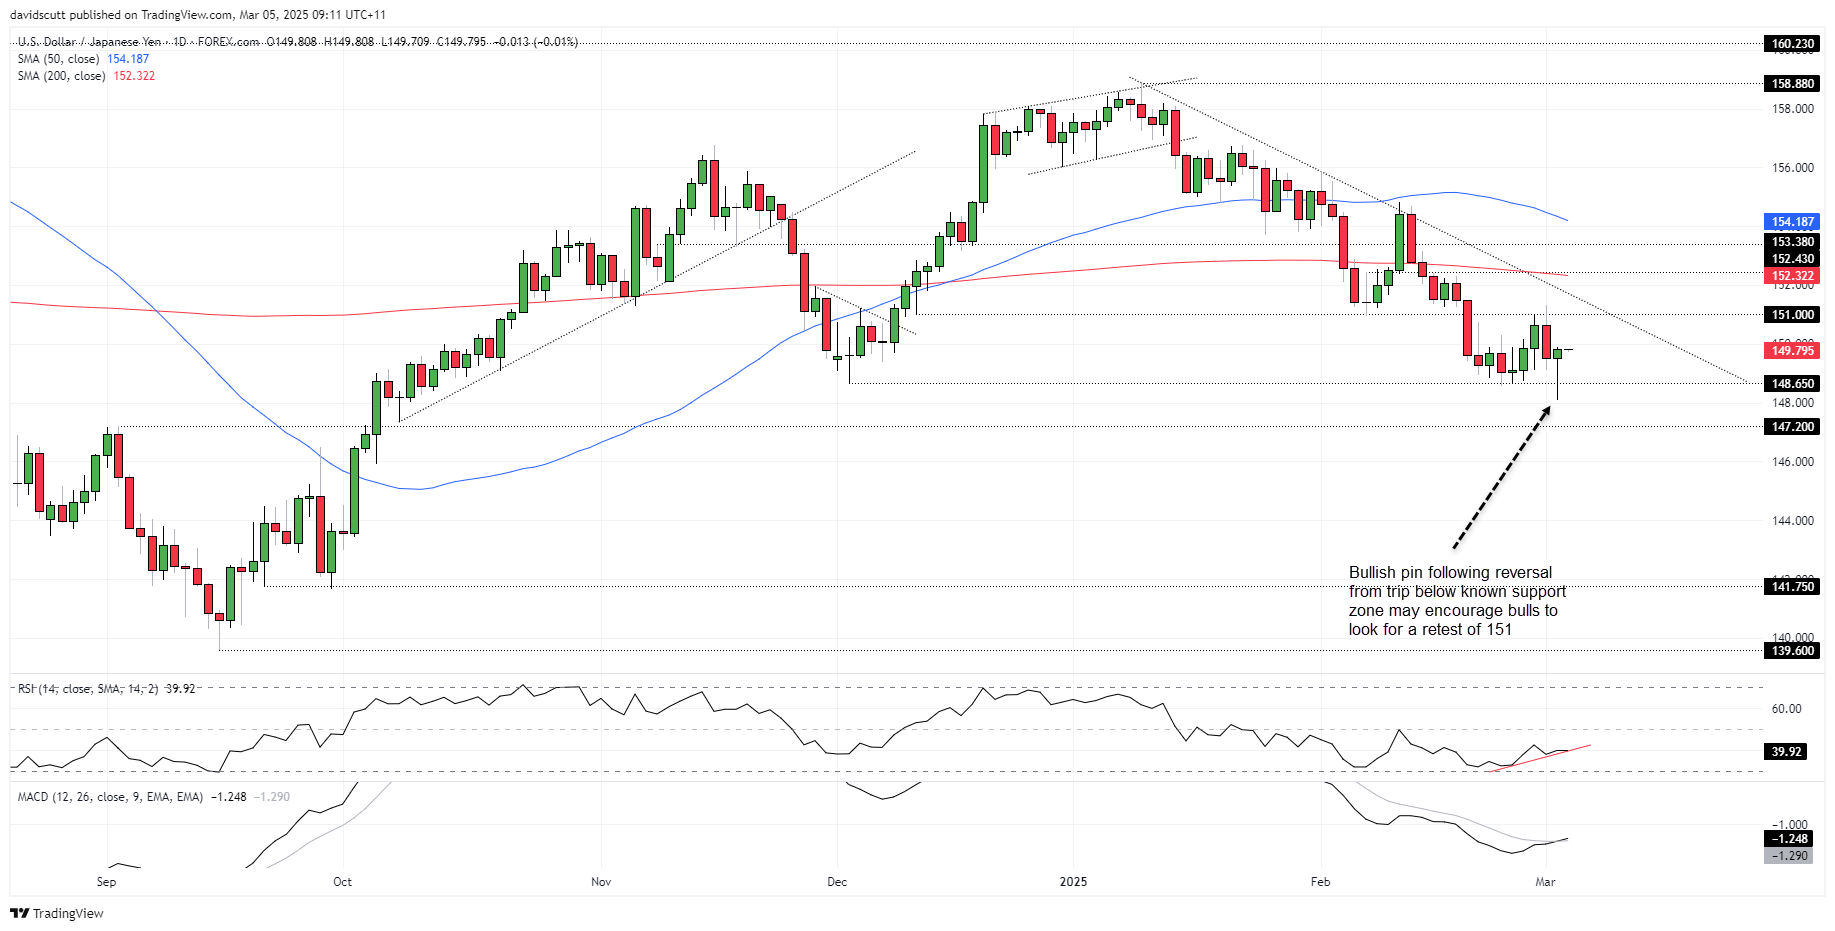
USD/JPY Bulls Fight Back Hard
Source: TradingView
USD/JPY was always going to be one to watch on a day like yesterday, given the damage an unwind of yen carry trades caused in early August last year when concerns over the U.S. economy last spiked.
At one stage, the pair dipped below the December swing low of 148.65, sliding to just above 148.00 as risk assets traded near session lows. However, the price action into the close was undeniably positive for risk, with a bullish pin candle hinting at a potential extension of the rebound towards known resistance at 151. The 148.65 level remains a key downside marker.
Momentum indicators continue to skew moderately bullish, reinforcing the inclination to buy dips if they occur.
S&P 500 Futures: 200DMA Saves the Day
Source: TradingView
S&P 500 futures face a make-or-break session technically after breaching long-standing uptrend support before bouncing into the close following a brief dip below the key 200-day moving average.
Excluding Lutnick’s comments, the overall price and momentum picture remains bearish. The price not only closed through the uptrend but also below 5808, a key horizontal level dating back to October last year. RSI (14) and MACD are trending lower—momentum signals that typically favour a bearish bias.
However, the bounce off the 200DMA may encourage bulls looking for a squeeze after recent losses. Aside from 5808 and trendline resistance around 5875, other topside levels of note include 6000, where bullish probes have repeatedly stalled over the past week, and the 50-day moving average.
A break and close below the 200DMA would be an undeniably bearish signal, potentially opening the door for a test of 5724 and a price gap down to 5670.
-- Written by David Scutt
Follow David on Twitter @scutty
How to trade with City Index
You can trade with City Index by following these four easy steps:
- Open an account, or log in if you’re already a customer
• Open an account in the UK
• Open an account in Australia
• Open an account in Singapore
- Search for the market you want to trade in our award-winning platform
- Choose your position and size, and your stop and limit levels
- Place the trade

Open an account in minutes
Experience award-winning platforms with fast and secure execution, and enjoy tight spreads from 0.5 pts on FX and 0.3 pts on indices.
Economic calendar
Web Trader platform
Our sophisticated web-based platform is packed with features.
Related articles

NZD/USD pressure mounts as payrolls looms large
NZD/USD has fallen sharply as Fed rate expectations reset higher, but extreme downside stretch and major support raise the risk of a violent counter-trend rebound.

US Core PCE Preview: Stale or Significant for the Fed
Core PCE inflation takes center stage Wednesday, with traders watching for signs of renewed price pressure and clues on whether the Fed could hike again in October.


Japanese Yen Technical Analysis: USD/JPY Support Test into Core PCE
USD/JPY has been a battlefield for the past two months as the force of intervention and the threat of more have given sellers an advantage, even as buyers have continued to bid support on pullbacks. This sets the stage for a massive finish to the week with Core PCE and Non-farm Payrolls.

This report is intended for general circulation only. It should not be construed as a recommendation, or an offer (or solicitation of an offer) to buy or sell any financial products. The information provided does not take into account your specific investment objectives, financial situation or particular needs. Before you act on any recommendation that may be contained in this report, independent advice ought to be sought from a financial adviser regarding the suitability of the investment product, taking into account your specific investment objectives, financial situation or particular needs.
StoneX Financial Pte. Ltd., may distribute reports produced by its respective foreign entities or affiliates within the StoneX group of companies or third parties pursuant to an arrangement under Regulation 32C of the Financial Advisers Regulations. Where the report is distributed to a person in Singapore who is not an accredited investor, expert investor or an institutional investor (as defined in the Securities Futures Act), StoneX Financial Pte. Ltd. accepts legal responsibility to such persons for the contents of the report only to the extent required by law. Singapore recipients should contact StoneX Financial Pte. Ltd. at 6826 9988 for matters arising from, or in connection with the report.
In the case of all other recipients of this report, to the extent permitted by applicable laws and regulations neither StoneX Financial Pte. Ltd. nor its associated companies will be responsible or liable for any loss or damage incurred arising out of, or in connection with, any use of the information contained in this report and all such liability is hereby expressly disclaimed. No representation or warranty is made, express or implied, that the content of this report is complete or accurate.
StoneX Financial Pte. Ltd. is not under any obligation to update this report.
Trading CFDs carries a high level of risk that may not be suitable for some investors. Consider your investment objectives, level of experience, financial resources, risk appetite and other relevant circumstances carefully. The possibility exists that you could lose some or all of your investments, including your initial deposits. If in doubt, please seek independent expert advice. Visit www.forex.com/en-sg/terms-and-policies for the complete Risk Disclosure Statement.