





EURCHF bearish flag in motion
EUR/CHF seems to be staging a potential imminent bearish breakdown.
Share this:

Medium-term technical outlook on EUR/CHF
click to enlarge charts
Key Levels (1 to 3 weeks)
Intermediate resistance: 1.0980
Pivot (key resistance): 1.1060
Supports: 1.0900, 1.0810 & 1.0650
Next resistance: 1.1195
Directional Bias (1 to 3 weeks)
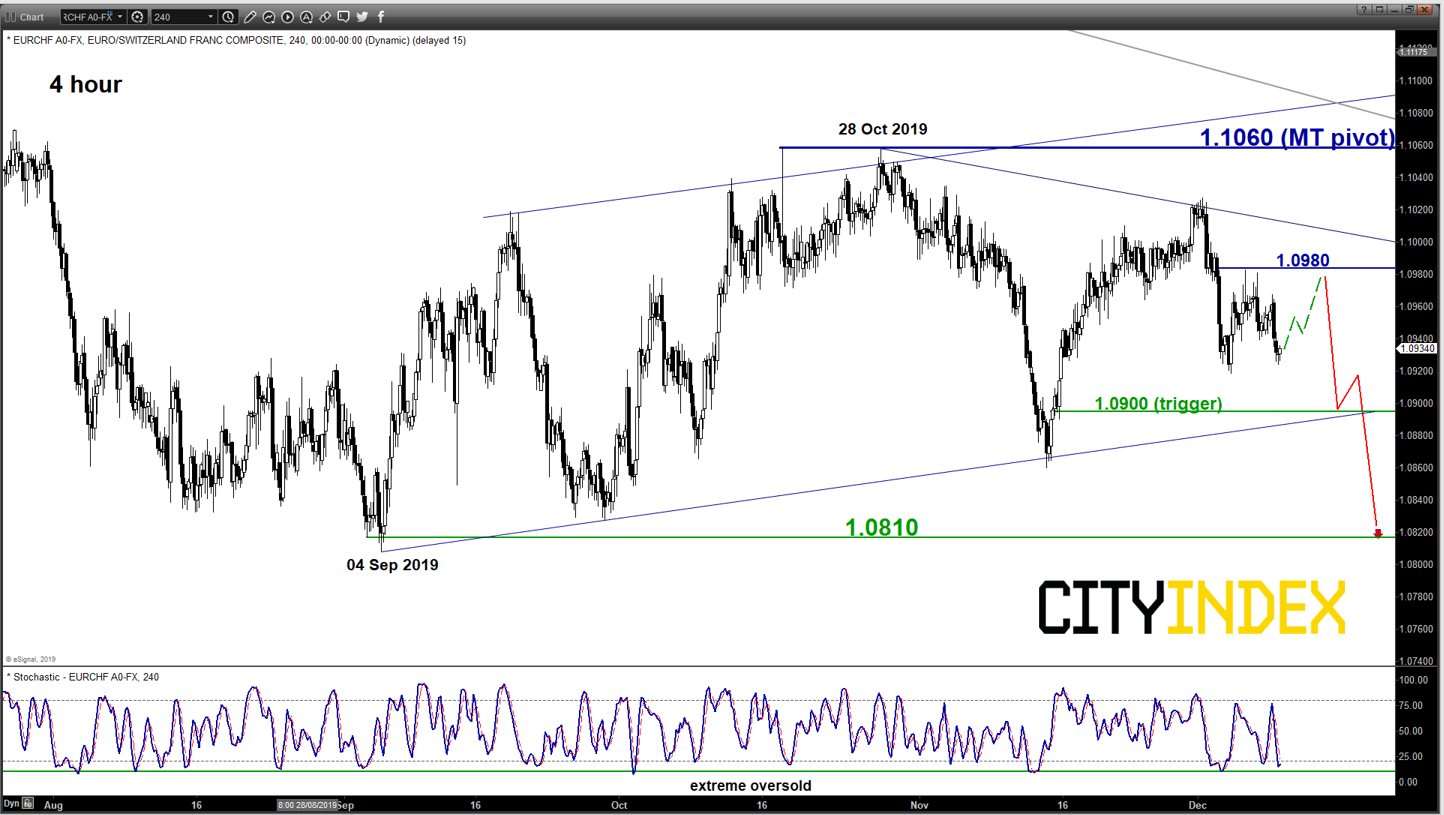
Bearish bias in any bounces below 1.1060 key medium-term pivotal resistance and a break below 1.0900 reinforces a bearish breakdown below the “bearish flag” ascending range configuration to target the 04 Sep 2019 swing low area of 1.0810 in the first step. Below 1.0810 sees a further slide towards 1.0650 (major range support from 24 Jun 2016/20 Feb 2017 & 1.00 Fibonacci projection of the down move from 20 Apr 2018 high to 07 Sep 2018 low projected from 23 Apr 2019 high)
However, a clearance with a daily close above 1.1060 invalidates the bearish scenario for a squeeze up to retest its major resistance at 1.1195 (former major range support from 07 Sep 2018/01 Apr 2019).
Key elements
- Since its 1.2005 high of 20 Apr 2018, the EUR/CHF cross pair has been evolving within a major descending channel with its upper boundary now acting as a resistance at 1.1060 that also confluences with a Fibonacci retracement/expansion cluster.
- The recent 2-month 250 pips rebound from its 04 Sep 2019 swing low area of 1.0810 has taken the form of a medium-term “bearish flag” ascending range configuration within a major downtrend phase in place since 20 Apr 2018 high.
- A “bearish flag” configuration tends to indicate a “dead cat” rebound before the bearish movement resumes, right now the support of the “bearish flag” rests at 1.0900.
- The shorter-term 4-hour Stochastic oscillator has reached an extreme oversold level which indicates that the EUR/CHF may see a bounce back to retest it minor range resistance at 1.0980 first before another potential downleg resumes.
Medium-term technical outlook on EUR/CHF
click to enlarge charts
Key Levels (1 to 3 weeks)
Intermediate resistance: 1.0980
Pivot (key resistance): 1.1060
Supports: 1.0900, 1.0810 & 1.0650
Next resistance: 1.1195
Directional Bias (1 to 3 weeks)
Bearish bias in any bounces below 1.1060 key medium-term pivotal resistance and a break below 1.0900 reinforces a bearish breakdown below the “bearish flag” ascending range configuration to target the 04 Sep 2019 swing low area of 1.0810 in the first step. Below 1.0810 sees a further slide towards 1.0650 (major range support from 24 Jun 2016/20 Feb 2017 & 1.00 Fibonacci projection of the down move from 20 Apr 2018 high to 07 Sep 2018 low projected from 23 Apr 2019 high)
However, a clearance with a daily close above 1.1060 invalidates the bearish scenario for a squeeze up to retest its major resistance at 1.1195 (former major range support from 07 Sep 2018/01 Apr 2019).
Key elements
- Since its 1.2005 high of 20 Apr 2018, the EUR/CHF cross pair has been evolving within a major descending channel with its upper boundary now acting as a resistance at 1.1060 that also confluences with a Fibonacci retracement/expansion cluster.
- The recent 2-month 250 pips rebound from its 04 Sep 2019 swing low area of 1.0810 has taken the form of a medium-term “bearish flag” ascending range configuration within a major downtrend phase in place since 20 Apr 2018 high.
- A “bearish flag” configuration tends to indicate a “dead cat” rebound before the bearish movement resumes, right now the support of the “bearish flag” rests at 1.0900.
- The shorter-term 4-hour Stochastic oscillator has reached an extreme oversold level which indicates that the EUR/CHF may see a bounce back to retest it minor range resistance at 1.0980 first before another potential downleg resumes.
Latest market news




Open an account in minutes
Experience award-winning platforms with fast and secure execution, and enjoy tight spreads from 0.5 pts on FX and 0.3 pts on indices.
Economic calendar
Web Trader platform
Our sophisticated web-based platform is packed with features.
Related articles
EUR/USD Q4 2026 Outlook: Euro at a Crossroads as Fed, ECB Tighten 9 25 2026
EUR/USD enters Q4 at a pivotal inflection point as competing Fed-ECB policy paths and persistent inflation risks collide with major technical support.
AUD/USD Q4 Outlook: RBA and Fed Hikes Set the Tone
AUD/USD enters Q4 with RBA and Fed hikes in focus as sticky inflation, rising unemployment and US dollar strength shape the Australian dollar.

USD/JPY Q4 2026 Outlook: Hawkish Fed Pricing Clashes With Intervention Risk
The year-end tug-of-war is clear: hawkish Fed pricing supports USD/JPY, while intervention risk limits the upside.

This report is intended for general circulation only. It should not be construed as a recommendation, or an offer (or solicitation of an offer) to buy or sell any financial products. The information provided does not take into account your specific investment objectives, financial situation or particular needs. Before you act on any recommendation that may be contained in this report, independent advice ought to be sought from a financial adviser regarding the suitability of the investment product, taking into account your specific investment objectives, financial situation or particular needs.
StoneX Financial Pte. Ltd., may distribute reports produced by its respective foreign entities or affiliates within the StoneX group of companies or third parties pursuant to an arrangement under Regulation 32C of the Financial Advisers Regulations. Where the report is distributed to a person in Singapore who is not an accredited investor, expert investor or an institutional investor (as defined in the Securities Futures Act), StoneX Financial Pte. Ltd. accepts legal responsibility to such persons for the contents of the report only to the extent required by law. Singapore recipients should contact StoneX Financial Pte. Ltd. at 6826 9988 for matters arising from, or in connection with the report.
In the case of all other recipients of this report, to the extent permitted by applicable laws and regulations neither StoneX Financial Pte. Ltd. nor its associated companies will be responsible or liable for any loss or damage incurred arising out of, or in connection with, any use of the information contained in this report and all such liability is hereby expressly disclaimed. No representation or warranty is made, express or implied, that the content of this report is complete or accurate.
StoneX Financial Pte. Ltd. is not under any obligation to update this report.
Trading CFDs carries a high level of risk that may not be suitable for some investors. Consider your investment objectives, level of experience, financial resources, risk appetite and other relevant circumstances carefully. The possibility exists that you could lose some or all of your investments, including your initial deposits. If in doubt, please seek independent expert advice. Visit www.forex.com/en-sg/terms-and-policies for the complete Risk Disclosure Statement.