



EURUSD and Nasdaq Outlook: Measuring Downside Volatility Risks
EURUSD and Nasdaq face key support tests ahead of US CPI data. Explore downside volatility risks, critical technical levels, and potential dip-buying opportunities
Share this:

Markets are reassessing downside volatility risks across major asset classes this week, including commodities, indices, and currency pairs. The Nasdaq and EURUSD remain key charts to monitor as traders evaluate whether recent selloffs are creating dip-buying opportunities or signaling the potential for deeper drawdowns ahead.
Both markets face potential headwinds from today's US CPI report, expected to rise towards 4.2%, ongoing uncertainty surrounding the global oil supply-demand shock, seasonal liquidity risks during the summer months, and evolving interest rate expectations. In addition, stalled progress toward resolving Middle East conflicts continues to influence market sentiment, valuations, and risk appetite.
Key Levels to Watch
Nasdaq
- Support: 28,600 and 28,200
- Resistance: 29,200 and 29,800
EURUSD
- Short-term support: 1.1480, 1.1400, and 1.1320
- Short-term resistance: 1.1680 and 1.1790
- Long-term resistance: 1.1860 and 1.1930
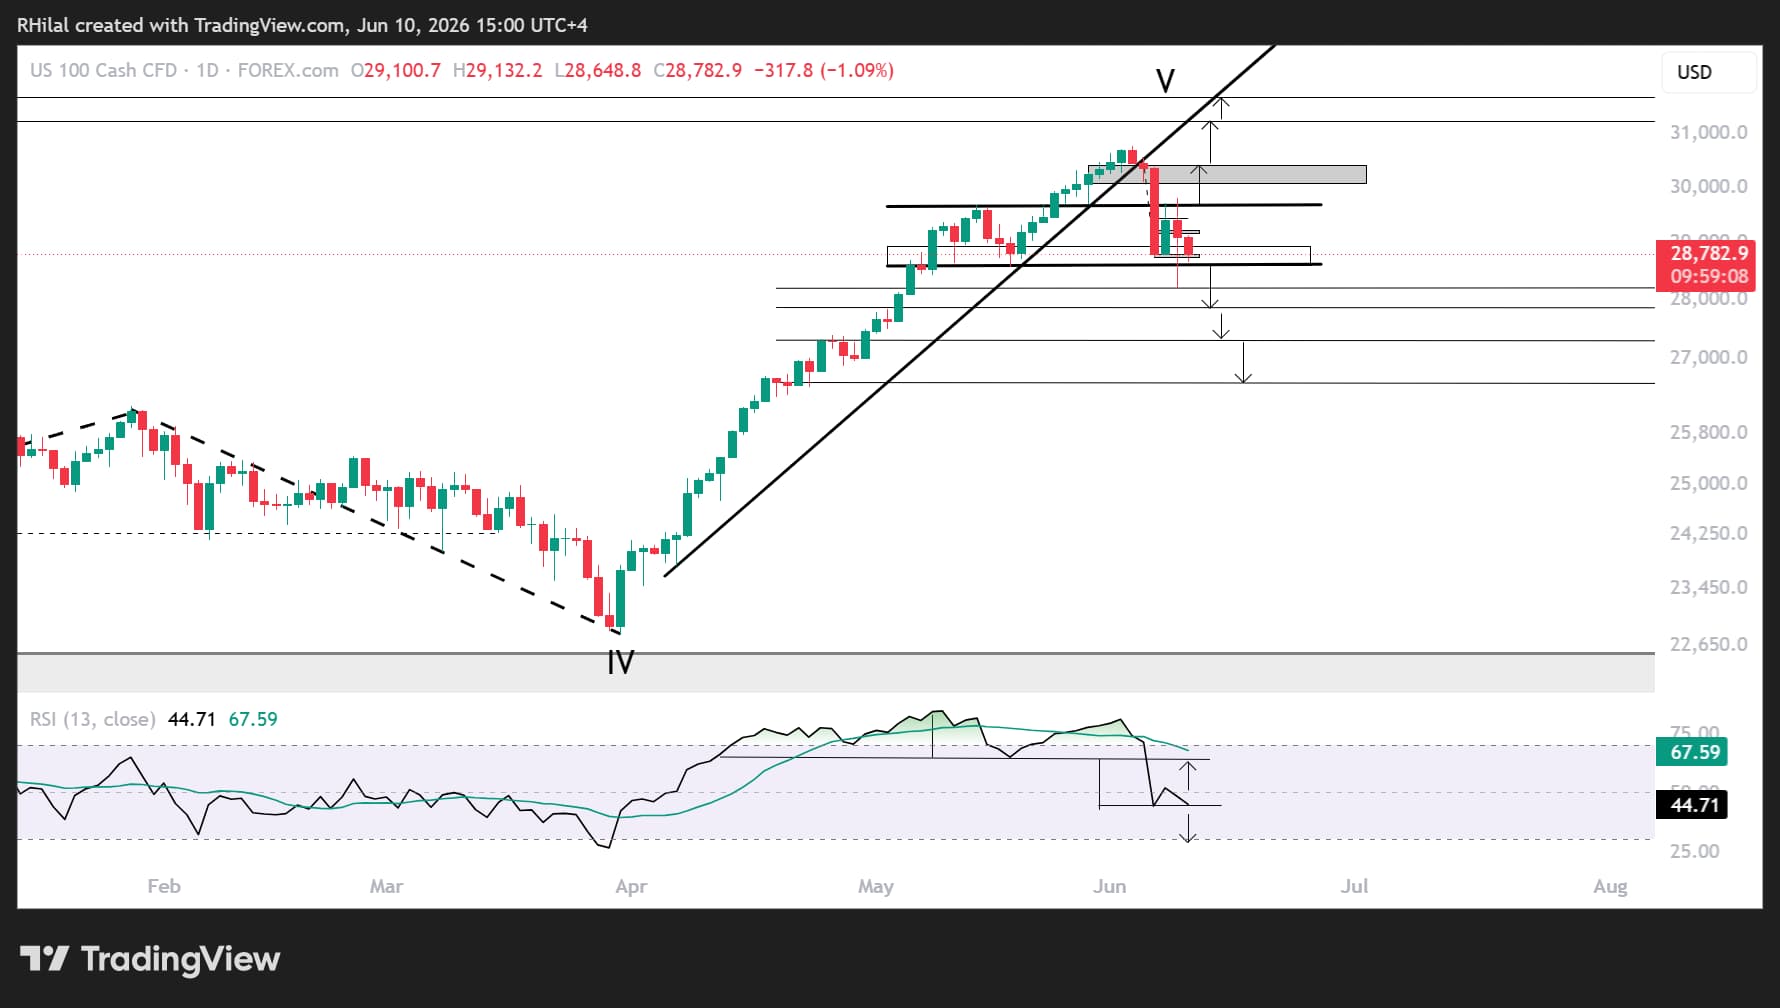
Nasdaq Price Outlook: Daily Time Frame – Log Scale
Source: TradingView
Nasdaq Remains in Correction Mode
The Nasdaq remains in a corrective phase following the strong rally from March through June. Price action is currently holding near the 78.6% Fibonacci extension of the June cycle and remains above the critical 28,200 support zone.
To follow this analysis live, join my daily MENA Market Call webinar: https://attendee.gotowebinar.com/register/1712903232130037596
Key Support Levels to Monitor
Price action continues to fluctuate around the 28,600 level. A renewed breakdown below this area, combined with a sustained move beneath the 28,200 support zone, would reinforce bearish momentum.
Momentum indicators remain below their neutral levels and are approaching yearly oversold conditions, increasing the risk of a decline toward the next key support zones at 27,700 and 27,200. These levels may offer potential dip-buying opportunities should selling pressure accelerate.
Liquidity Risks Around the SpaceX IPO
Additional volatility could emerge as markets prepare for the anticipated SpaceX IPO, which may trigger liquidity rebalancing across equity markets. As one of the largest public offerings in history, with an estimated valuation of $1.75 trillion, the listing could temporarily affect market positioning and risk allocation.
Bullish Scenario: Reclaiming Resistance
If bullish momentum returns and the Nasdaq successfully reclaims the 29,200 and 29,800 resistance zones, attention would shift toward the next upside targets at 30,100 and 30,400.
A sustained breakout above these levels would strengthen the case for a renewed rally toward record highs, potentially opening the path toward the 31,700 region.
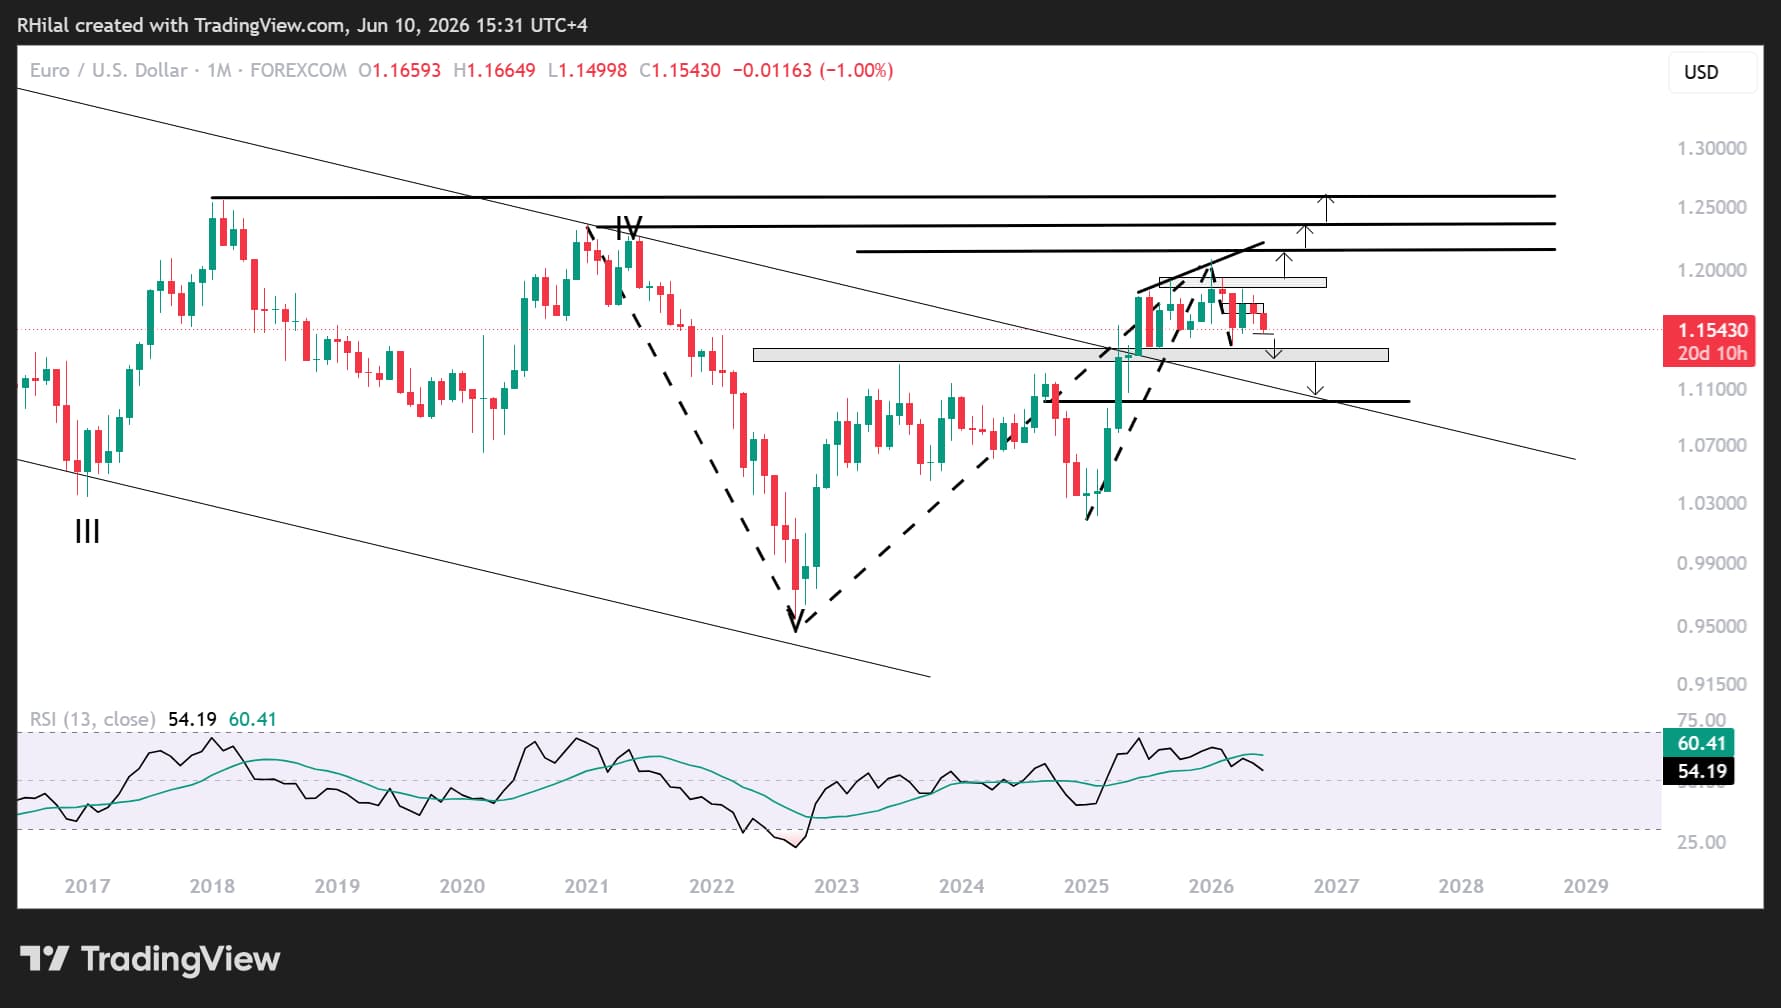
EURUSD Price Outlook: Monthly Time Frame – Log Scale
Source: TradingView
One-Year Consolidation Remains Intact
EURUSD continues to trade within a year-long consolidation range, with neither bulls nor bears managing a decisive breakout. The broader outlook remains heavily influenced by US dollar strength, inflation trends, and evolving expectations surrounding central bank policy.
Short-Term Resistance Levels
The first resistance levels to monitor are located at 1.1680 and 1.1790.
These areas are likely to determine whether the pair can build enough momentum to challenge the upper boundary of its broader consolidation structure.
Long-Term Resistance Targets
The 1.127 Fibonacci extension of the 2025–2026 cycle points toward major resistance zones at 1.1850 and 1.1930.
A sustained breakout above these levels would expose the pair to the 2021 highs near 1.2100 and 1.2350, followed by the 2018 highs around 1.2580.
Short-Term Support Levels
On the downside, key support levels remain at 1.1480, 1.1400, and 1.1320.
These levels may continue to provide support within the year-long consolidation range. However, a sustained breakdown below this zone would expose longer-term support levels and the 0.272 Fibonacci extension of the broader trend spanning the 2021 high, 2022 low, and 2026 high.
Long-Term Dip-Buying Zone Near 1.10
Should EURUSD break below its consolidation range, the next major support zone would emerge near 1.1000.
This level could become an attractive long-term dip-buying area for investors, particularly if broader macroeconomic conditions begin to favor a weaker US dollar cycle.
Written by Razan Hilal, CMT
Follow on X: @Rh_waves
Open an account in minutes
Experience award-winning platforms with fast and secure execution, and enjoy tight spreads from 0.5 pts on FX and 0.3 pts on indices.
Economic calendar
Web Trader platform
Our sophisticated web-based platform is packed with features.
Related articles

USD/JPY outlook: Hawkish Fed recalibration pressures the yen
Stronger US growth momentum and rising Treasury yields are keeping USD/JPY pointed higher, even as Japanese policymakers try to limit the pressure building across domestic markets.


Gold, silver slammed as hawkish Fed repricing reignites dollar upside
Gold and silver had held up surprisingly well against surging US yields. Wednesday’s DXY breakout may have changed that equation.

AUD/USD Crushed Ahead of Jobs Report as US Dollar, Yields Surge
AUD/USD slumps towards 70c as surging US yields and a stronger dollar overshadow Australian jobs data and the RBA outlook.

This report is intended for general circulation only. It should not be construed as a recommendation, or an offer (or solicitation of an offer) to buy or sell any financial products. The information provided does not take into account your specific investment objectives, financial situation or particular needs. Before you act on any recommendation that may be contained in this report, independent advice ought to be sought from a financial adviser regarding the suitability of the investment product, taking into account your specific investment objectives, financial situation or particular needs.
StoneX Financial Pte. Ltd., may distribute reports produced by its respective foreign entities or affiliates within the StoneX group of companies or third parties pursuant to an arrangement under Regulation 32C of the Financial Advisers Regulations. Where the report is distributed to a person in Singapore who is not an accredited investor, expert investor or an institutional investor (as defined in the Securities Futures Act), StoneX Financial Pte. Ltd. accepts legal responsibility to such persons for the contents of the report only to the extent required by law. Singapore recipients should contact StoneX Financial Pte. Ltd. at 6826 9988 for matters arising from, or in connection with the report.
In the case of all other recipients of this report, to the extent permitted by applicable laws and regulations neither StoneX Financial Pte. Ltd. nor its associated companies will be responsible or liable for any loss or damage incurred arising out of, or in connection with, any use of the information contained in this report and all such liability is hereby expressly disclaimed. No representation or warranty is made, express or implied, that the content of this report is complete or accurate.
StoneX Financial Pte. Ltd. is not under any obligation to update this report.
Trading CFDs carries a high level of risk that may not be suitable for some investors. Consider your investment objectives, level of experience, financial resources, risk appetite and other relevant circumstances carefully. The possibility exists that you could lose some or all of your investments, including your initial deposits. If in doubt, please seek independent expert advice. Visit www.forex.com/en-sg/terms-and-policies for the complete Risk Disclosure Statement.