




EUR/USD Bulls Build Support Bounce into the ECB Rate Decision
EUR/USD is overbought on the weekly and sellers had an open door to drive a deeper pullback earlier this week. But, so far, they’ve failed to push through the first area of support at the 1.1275 Fibonacci level.
Share this:

EUR/USD, Euro, ECB Talking Points:
- Tomorrow brings a rate decision from the European Central Bank with the wide expectation for a 25 bp cut.
- Despite that expectation EUR/USD has been breaking out over the past two months, setting a fresh three-year high just last Friday.
- The weekly EUR/USD chart is overbought and sellers had an open door to run a pullback at the start of this week – but they could not get below the 1.1275 Fibonacci level and bulls have since used that price as a springboard from higher-low support.
There seems to be little suspense around what the ECB might do at tomorrow’s rate decision. The bank is widely expected to cut rates by 25 bps, but you might not know that by looking at the chart as the pair has just flexed up to a fresh three-year high as of last Friday.
Adding some context to the mix is the fact that RSI is now overbought on the weekly chart and that’s not a very common occurrence. That doesn’t denote an automatic reversal, but it can make it more difficult for bulls to chase trends higher given just how one-sided the move has been.
So far buyers have jumped at the first relevant spot of support, the 1.1275 level looked at in yesterday’s webinar and that rally today erases the losses from both Monday and Tuesday. It also begs the question as to what happens in breakout scenarios – as the weekly RSI reading is still overbought and the 1.1500 psychological level looms overhead. And there’s also the matter of the U.S. Dollar to consider, which is oversold on the weekly and sitting very near key Fibonacci support.
EUR/USD Daily Chart
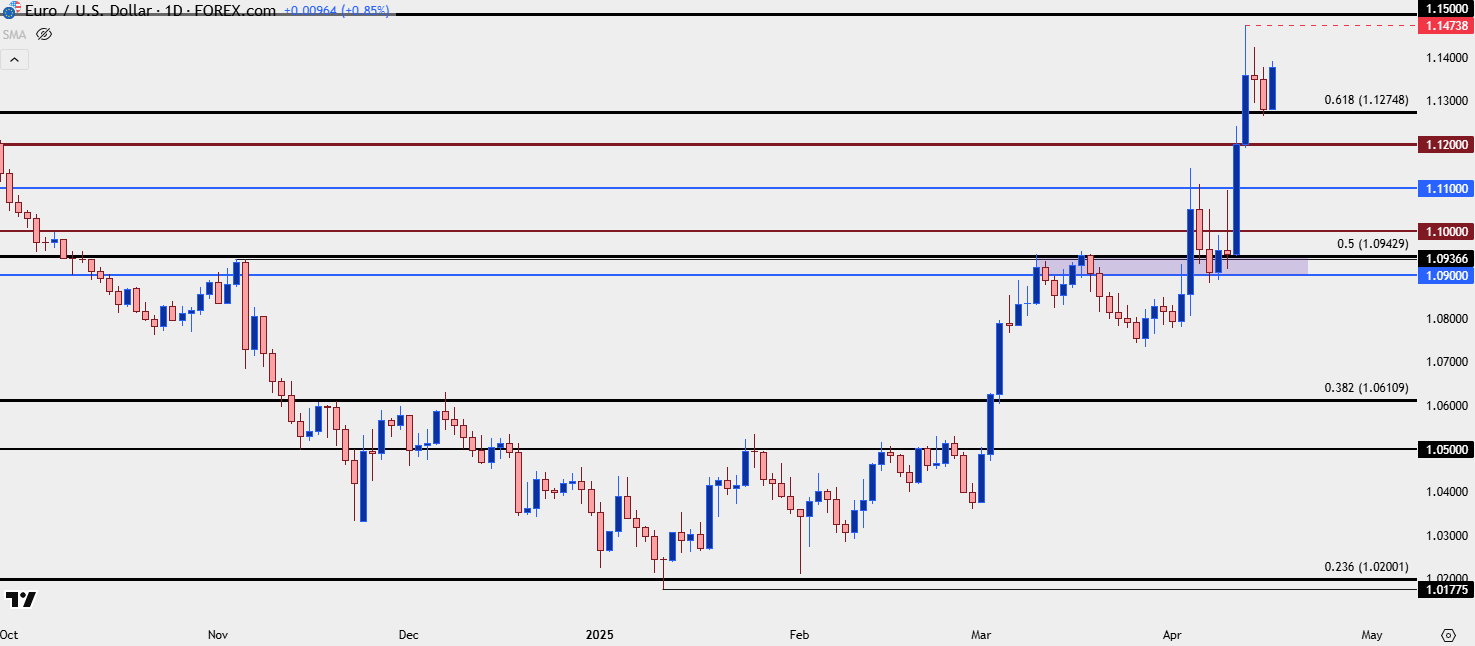 Chart prepared by James Stanley; data derived from Tradingview
The Weekly Chart
At this point both EUR/USD and USD remain in extremes via RSI on the weekly chart, and there’s still some time left for that to change. If we do see a pullback in EUR/USD and USD, there could be a return from oversold in USD and overbought in EUR/USD. But also of consideration is the fact that if we do see that top-side trend in EUR/USD extend up to fresh highs, there’s another possible area of resistance for bulls to contend with at the 1.1500 level.
That’s a price that hasn’t been in-play since early-2022, and when it was in-play, it held the highs on three occasions before a larger reversal developed.
If we do see the breakout extend for a test there tomorrow or Friday – will buyers actually be able to continue to push through, even with an overbought backdrop in the equation?
EUR/USD Weekly Price Chart
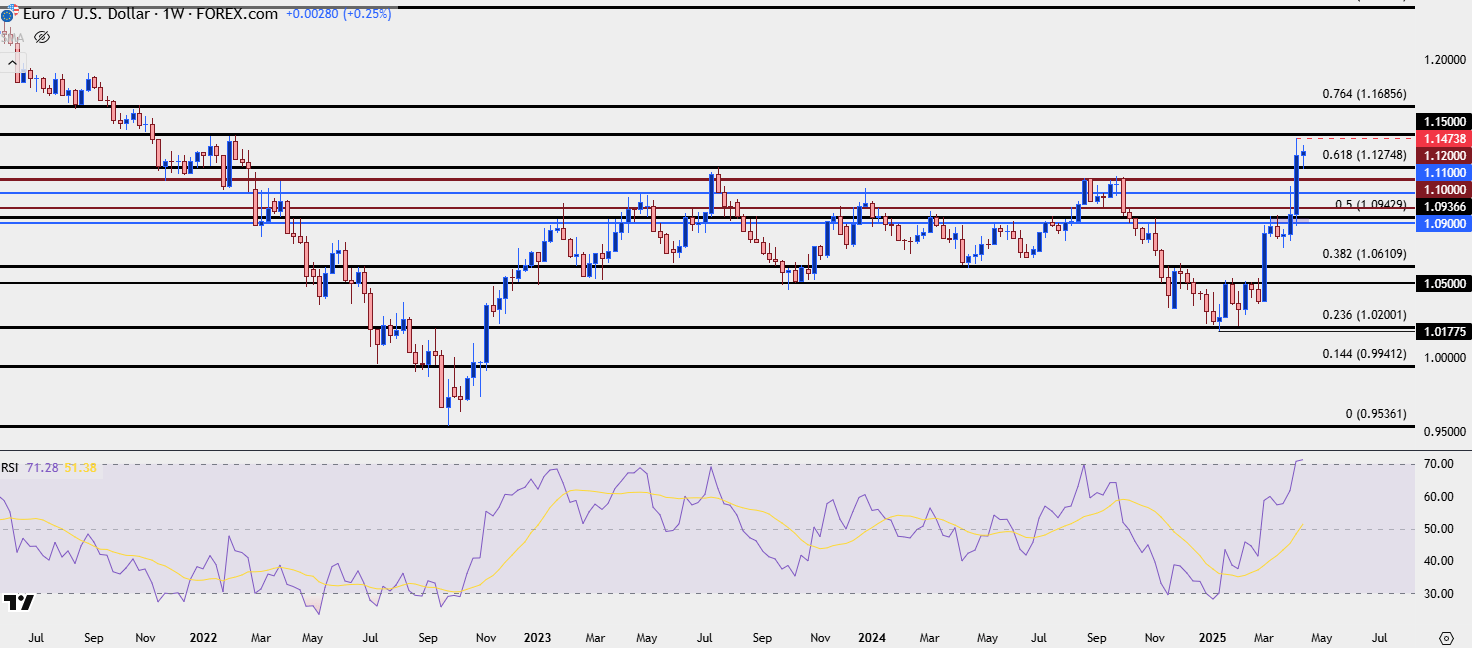 Chart prepared by James Stanley; data derived from Tradingview
EUR/USD Shorter-Term Strategy, Structure
At this point the response to support at 1.1275 has been clean, as that price helped to hold yesterday’s low and that was followed by a bounce of more than 100 pips. That could keep the level as attractive for support plays if it does come back into the equation again, but the fact that it’s already drawn buyers in must be taken into account – and if we do see bulls fail to press up to a higher-high, then the door should open for a short-term lower-low which can lead to another key test.
In EUR/USD, the 1.1200 level stands out as that was the swing-high from last year on multiple occasions. And then the 1.1100 level is of interest as this was resistance in early-April and, to date, hasn’t yet shown as support. Even 1.1000 could be construed as higher-low support given last week’s bounce from the 1.0943 Fibonacci level.
For invalidation, or as indication that bears are taking back over, it’s that 1.0900-1.0943 zone that I would like to see a closed body on a daily candlestick to illustrate that possibility.
EUR/USD Four-Hour Chart
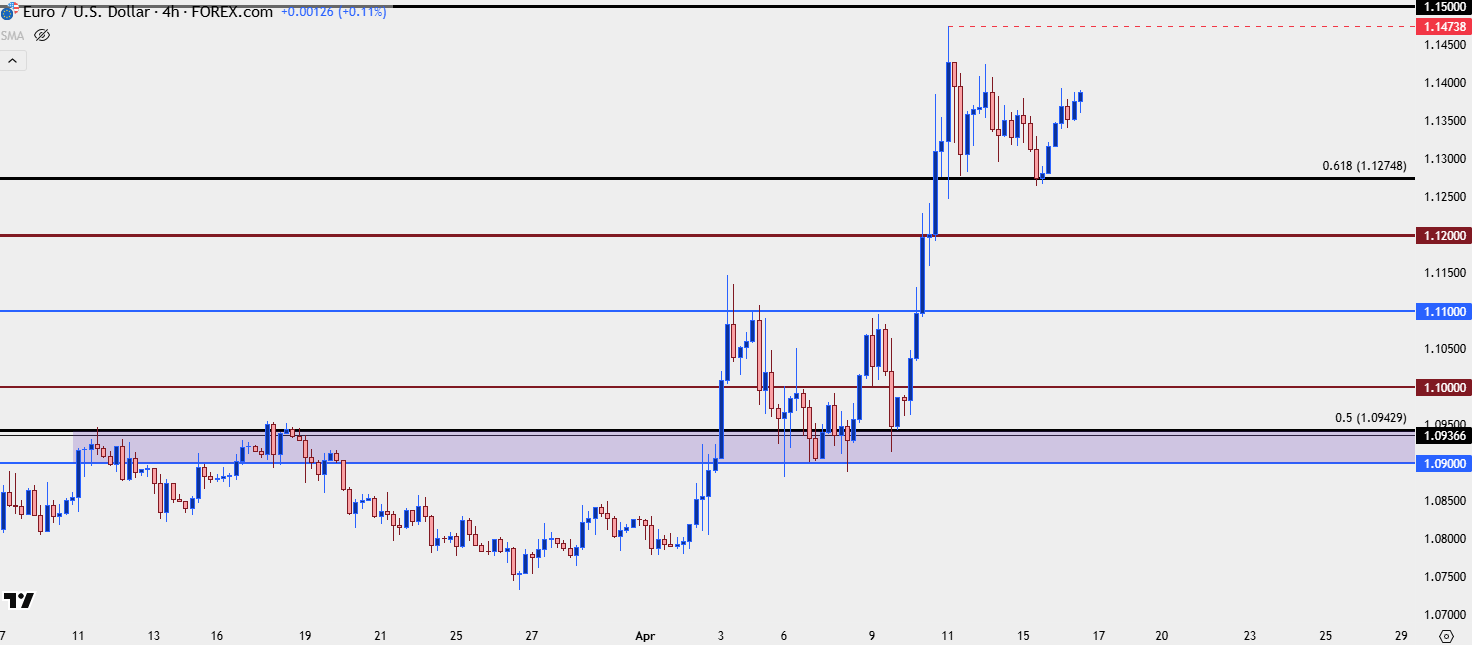 Chart prepared by James Stanley; data derived from Tradingview
--- written by James Stanley, Senior Strategist
EUR/USD, Euro, ECB Talking Points:
- Tomorrow brings a rate decision from the European Central Bank with the wide expectation for a 25 bp cut.
- Despite that expectation EUR/USD has been breaking out over the past two months, setting a fresh three-year high just last Friday.
- The weekly EUR/USD chart is overbought and sellers had an open door to run a pullback at the start of this week – but they could not get below the 1.1275 Fibonacci level and bulls have since used that price as a springboard from higher-low support.
There seems to be little suspense around what the ECB might do at tomorrow’s rate decision. The bank is widely expected to cut rates by 25 bps, but you might not know that by looking at the chart as the pair has just flexed up to a fresh three-year high as of last Friday.
Adding some context to the mix is the fact that RSI is now overbought on the weekly chart and that’s not a very common occurrence. That doesn’t denote an automatic reversal, but it can make it more difficult for bulls to chase trends higher given just how one-sided the move has been.
So far buyers have jumped at the first relevant spot of support, the 1.1275 level looked at in yesterday’s webinar and that rally today erases the losses from both Monday and Tuesday. It also begs the question as to what happens in breakout scenarios – as the weekly RSI reading is still overbought and the 1.1500 psychological level looms overhead. And there’s also the matter of the U.S. Dollar to consider, which is oversold on the weekly and sitting very near key Fibonacci support.
EUR/USD Daily Chart
 Chart prepared by James Stanley; data derived from Tradingview
The Weekly Chart
At this point both EUR/USD and USD remain in extremes via RSI on the weekly chart, and there’s still some time left for that to change. If we do see a pullback in EUR/USD and USD, there could be a return from oversold in USD and overbought in EUR/USD. But also of consideration is the fact that if we do see that top-side trend in EUR/USD extend up to fresh highs, there’s another possible area of resistance for bulls to contend with at the 1.1500 level.
That’s a price that hasn’t been in-play since early-2022, and when it was in-play, it held the highs on three occasions before a larger reversal developed.
If we do see the breakout extend for a test there tomorrow or Friday – will buyers actually be able to continue to push through, even with an overbought backdrop in the equation?
EUR/USD Weekly Price Chart
Chart prepared by James Stanley; data derived from Tradingview
EUR/USD Shorter-Term Strategy, Structure
At this point the response to support at 1.1275 has been clean, as that price helped to hold yesterday’s low and that was followed by a bounce of more than 100 pips. That could keep the level as attractive for support plays if it does come back into the equation again, but the fact that it’s already drawn buyers in must be taken into account – and if we do see bulls fail to press up to a higher-high, then the door should open for a short-term lower-low which can lead to another key test.
In EUR/USD, the 1.1200 level stands out as that was the swing-high from last year on multiple occasions. And then the 1.1100 level is of interest as this was resistance in early-April and, to date, hasn’t yet shown as support. Even 1.1000 could be construed as higher-low support given last week’s bounce from the 1.0943 Fibonacci level.
For invalidation, or as indication that bears are taking back over, it’s that 1.0900-1.0943 zone that I would like to see a closed body on a daily candlestick to illustrate that possibility.
EUR/USD Four-Hour Chart
Chart prepared by James Stanley; data derived from Tradingview
--- written by James Stanley, Senior Strategist
Related tags:
Latest market news




Open an account in minutes
Experience award-winning platforms with fast and secure execution, and enjoy tight spreads from 0.5 pts on FX and 0.3 pts on indices.
Economic calendar
Web Trader platform
Our sophisticated web-based platform is packed with features.
Related articles
RBA delivers 25bp hike, Bullock now the main event
The RBA delivered the expected 25bp hike, but Bullock’s press conference now looms as the bigger volatility risk for AUD/USD and the ASX 200.
Gold outlook: XAU/USD hammered, stretched and vulnerable to a sharp rebound
Gold is getting hammered for solid fundamental reasons, but history suggests extreme four-hourly oversold conditions can produce violent countertrend rallies.
EUR/USD, USD/JPY Outlook: Oil, yields and an FX identity crisis
Crude oil is setting the tone across rates and FX, leaving EUR/USD vulnerable and USD/JPY caught between higher Treasury yields and the growing threat of intervention
This report is intended for general circulation only. It should not be construed as a recommendation, or an offer (or solicitation of an offer) to buy or sell any financial products. The information provided does not take into account your specific investment objectives, financial situation or particular needs. Before you act on any recommendation that may be contained in this report, independent advice ought to be sought from a financial adviser regarding the suitability of the investment product, taking into account your specific investment objectives, financial situation or particular needs.
StoneX Financial Pte. Ltd., may distribute reports produced by its respective foreign entities or affiliates within the StoneX group of companies or third parties pursuant to an arrangement under Regulation 32C of the Financial Advisers Regulations. Where the report is distributed to a person in Singapore who is not an accredited investor, expert investor or an institutional investor (as defined in the Securities Futures Act), StoneX Financial Pte. Ltd. accepts legal responsibility to such persons for the contents of the report only to the extent required by law. Singapore recipients should contact StoneX Financial Pte. Ltd. at 6826 9988 for matters arising from, or in connection with the report.
In the case of all other recipients of this report, to the extent permitted by applicable laws and regulations neither StoneX Financial Pte. Ltd. nor its associated companies will be responsible or liable for any loss or damage incurred arising out of, or in connection with, any use of the information contained in this report and all such liability is hereby expressly disclaimed. No representation or warranty is made, express or implied, that the content of this report is complete or accurate.
StoneX Financial Pte. Ltd. is not under any obligation to update this report.
Trading CFDs carries a high level of risk that may not be suitable for some investors. Consider your investment objectives, level of experience, financial resources, risk appetite and other relevant circumstances carefully. The possibility exists that you could lose some or all of your investments, including your initial deposits. If in doubt, please seek independent expert advice. Visit www.forex.com/en-sg/terms-and-policies for the complete Risk Disclosure Statement.