



eurusd forms bullish pattern under key resistance 1805622016
<p>EUR/USD has consolidated within the past week just under a major resistance zone around the 1.1450-1.1500 area. In the process, the currency pair has formed […]</p>
Share this:

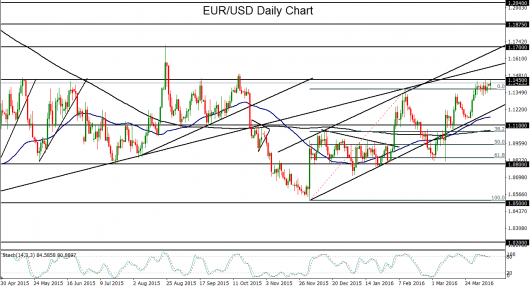
EUR/USD has consolidated within the past week just under a major resistance zone around the 1.1450-1.1500 area. In the process, the currency pair has formed a key bullish flag pattern that could be poised for a breakout if the dollar continues its recent weakening trend.
Within this consolidation, EUR/USD hit a new six-month high last week at 1.1453, a price level that has not been reached since mid-October. The current consolidation is the latest culmination of a rising trend characterized by higher highs and higher lows since December’s lows near 1.0500.
Much of EUR/USD’s rise in the past four months can be attributed to a falling US dollar that has been pressured by an increasingly dovish Federal Reserve and the resulting lowered expectations for a regular pace of interest rate hikes in the US. Last week’s release of minutes from March’s FOMC meeting revealed much debate within the ranks of Fed policymakers, as well as an overall sense of caution with regard to raising rates due to persistent global economic worries. The EUR/USD currency pair has stayed well-supported because of this dollar pressure, despite what one might expect should be a weakened euro due to the European Central Bank’s own extended easing program.
During the course of the current EUR/USD uptrend, the currency pair has broken out above several major resistance areas, including the key 1.1100 level. In mid-March, the 50-day moving average crossed above the 200-day moving average, suggesting a potentially bullish outlook for the near-term.
Currently just off the noted key resistance zone around 1.1450-1.1500, EUR/USD is at a critical technical juncture. Any sustained breakout above this resistance could go on to target the next major upside target at the 1.1700 level, which was the area of the high reached in August 2015.
This week’s upcoming economic calendar, especially with respect to US data, could help prompt such a breakout move. March’s Producer Price Index, a key inflation measure, will be released on Wednesday, along with the US retail sales report. This will be followed on Thursday by the Consumer Price Index, another major inflation measure, and weekly unemployment claims.
Related tags:
Latest market news



Open an account in minutes
Experience award-winning platforms with fast and secure execution, and enjoy tight spreads from 0.5 pts on FX and 0.3 pts on indices.
Economic calendar
Web Trader platform
Our sophisticated web-based platform is packed with features.
Related articles
This report is intended for general circulation only. It should not be construed as a recommendation, or an offer (or solicitation of an offer) to buy or sell any financial products. The information provided does not take into account your specific investment objectives, financial situation or particular needs. Before you act on any recommendation that may be contained in this report, independent advice ought to be sought from a financial adviser regarding the suitability of the investment product, taking into account your specific investment objectives, financial situation or particular needs.
StoneX Financial Pte. Ltd., may distribute reports produced by its respective foreign entities or affiliates within the StoneX group of companies or third parties pursuant to an arrangement under Regulation 32C of the Financial Advisers Regulations. Where the report is distributed to a person in Singapore who is not an accredited investor, expert investor or an institutional investor (as defined in the Securities Futures Act), StoneX Financial Pte. Ltd. accepts legal responsibility to such persons for the contents of the report only to the extent required by law. Singapore recipients should contact StoneX Financial Pte. Ltd. at 6826 9988 for matters arising from, or in connection with the report.
In the case of all other recipients of this report, to the extent permitted by applicable laws and regulations neither StoneX Financial Pte. Ltd. nor its associated companies will be responsible or liable for any loss or damage incurred arising out of, or in connection with, any use of the information contained in this report and all such liability is hereby expressly disclaimed. No representation or warranty is made, express or implied, that the content of this report is complete or accurate.
StoneX Financial Pte. Ltd. is not under any obligation to update this report.
Trading CFDs carries a high level of risk that may not be suitable for some investors. Consider your investment objectives, level of experience, financial resources, risk appetite and other relevant circumstances carefully. The possibility exists that you could lose some or all of your investments, including your initial deposits. If in doubt, please seek independent expert advice. Visit www.forex.com/en-sg/terms-and-policies for the complete Risk Disclosure Statement.