


Forex Seasonality – August 2025: GBP/USD and AUD/USD Vulnerable?
August has historically been the most bearish month for GBP/USD and AUD/USD going back to the Bretton Woods Agreement in 1971 - see the data!
Share this:

August Forex Seasonality Key Points
- August has historically been the most bearish month for GBP/USD and AUD/USD going back to the Bretton Woods Agreement in 1971.
- In contrast, USD/CAD has tended to gain ground in August over the last 50+ years.
- With at least an element of certainty over US trade policy emerging as we go to press, seasonal trends may be more likely to reassert themselves moving forward.
The beginning of a new month marks a good opportunity to review the seasonal patterns that have influenced the forex market over the 50+ years since the Bretton Woods system was dismantled in 1971, ushering in the modern foreign exchange market.
As always, these seasonal tendencies are just historical averages, and any individual month or year may vary from the historic average, so it’s important to complement these seasonal leans with alternative forms of analysis to create a long-term successful trading strategy. In other words, past performance is not necessarily indicative of future results.
Euro Forex Seasonality – EUR/USD Chart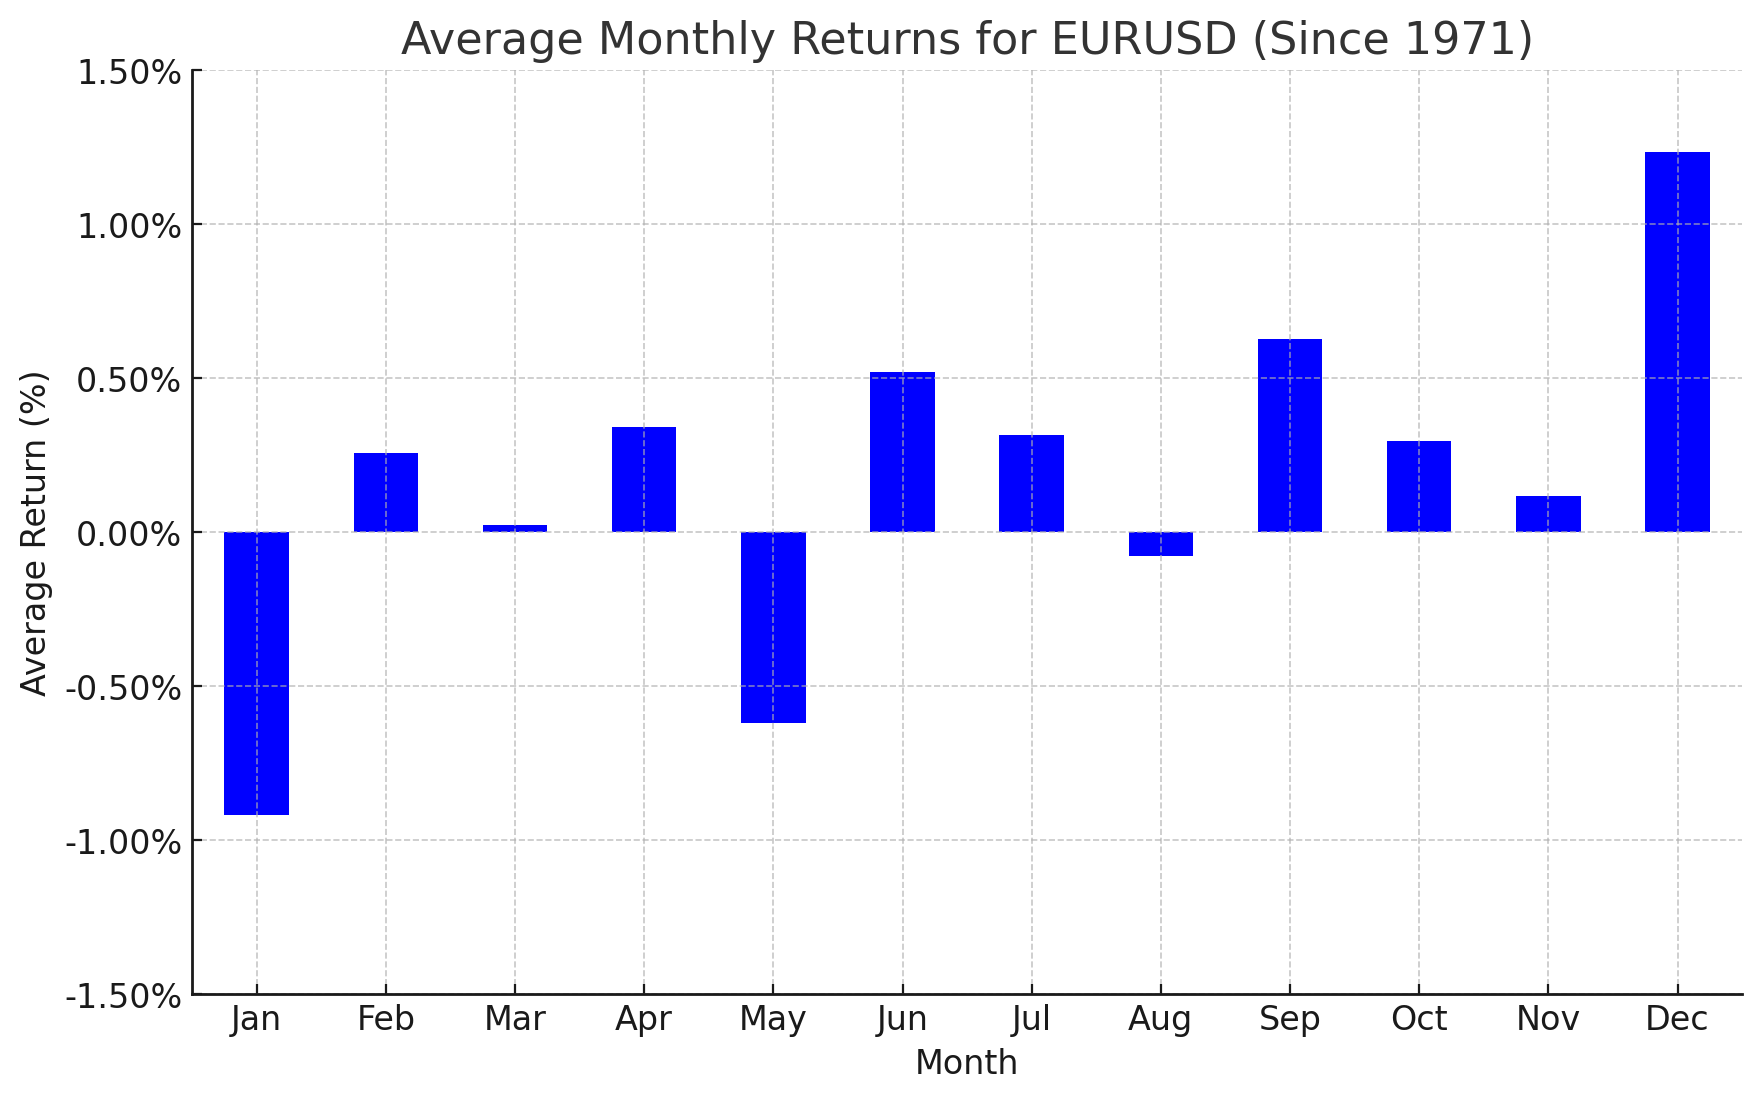
Source: TradingView, StoneX. Please note that past performance is not necessarily indicative of future results.
Historically, August has been a relatively neutral month for EUR/USD, with the world’s most widely-traded currency pair sporting an average return of -0.08% over the last 50+ years. In July, EUR/USD bucked its bullish seasonal trend, falling nearly 3% to reverse most of its June gains. After two months with higher-than-typical volatility (and four of the last five), a more consolidative month through the proverbial “dog days of summer” may be on the cards.
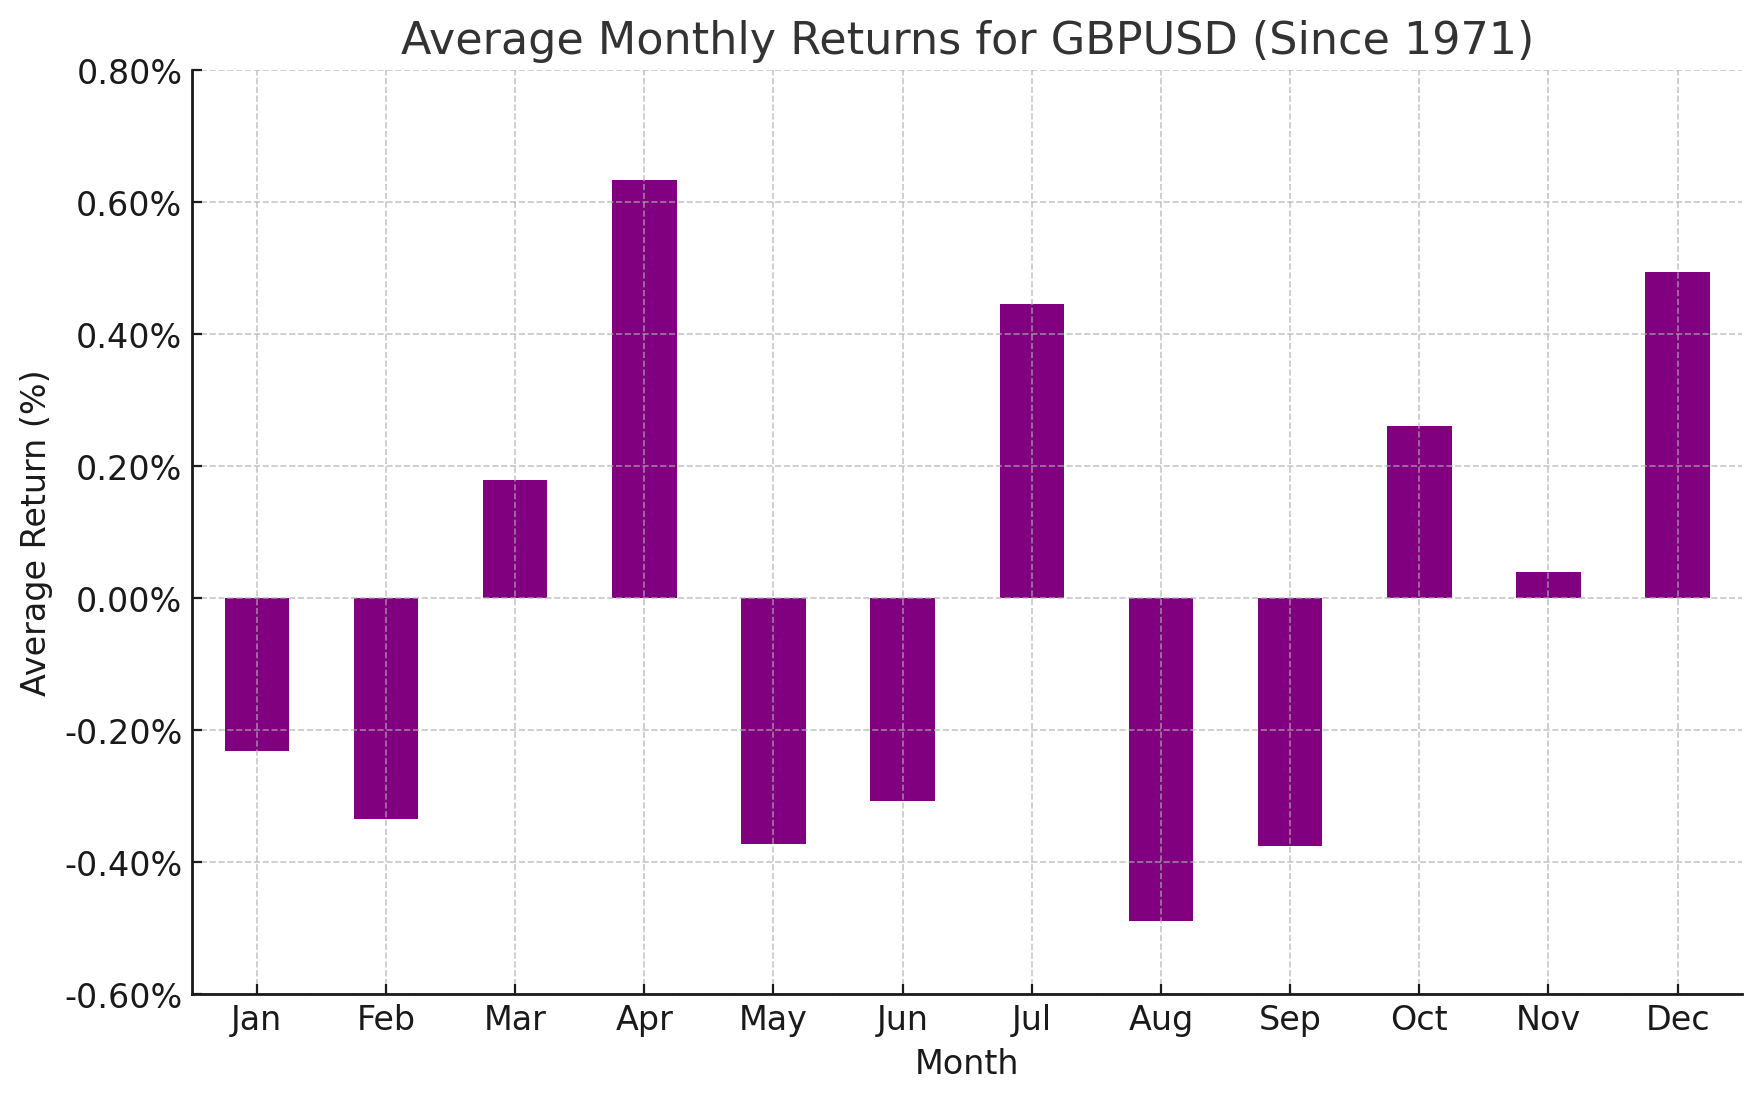
British Pound Forex Seasonality – GBP/USD Chart
Source: TradingView, StoneX. Please note that past performance is not necessarily indicative of future results.
Looking at the above chart, GBP/USD has, on average, seen its worst month of the year in August, with average returns of around -0.49% since 1971. Like the euro, the British pound traded sharply lower in July amidst broad-based US dollar strength, not surprisingly after a run of five straight “up” months. If we do see cable follow its bearish historic tendency, the next level of support to watch will be the 38.2% Fibonacci retracement of the H1 rally near 1.3150.
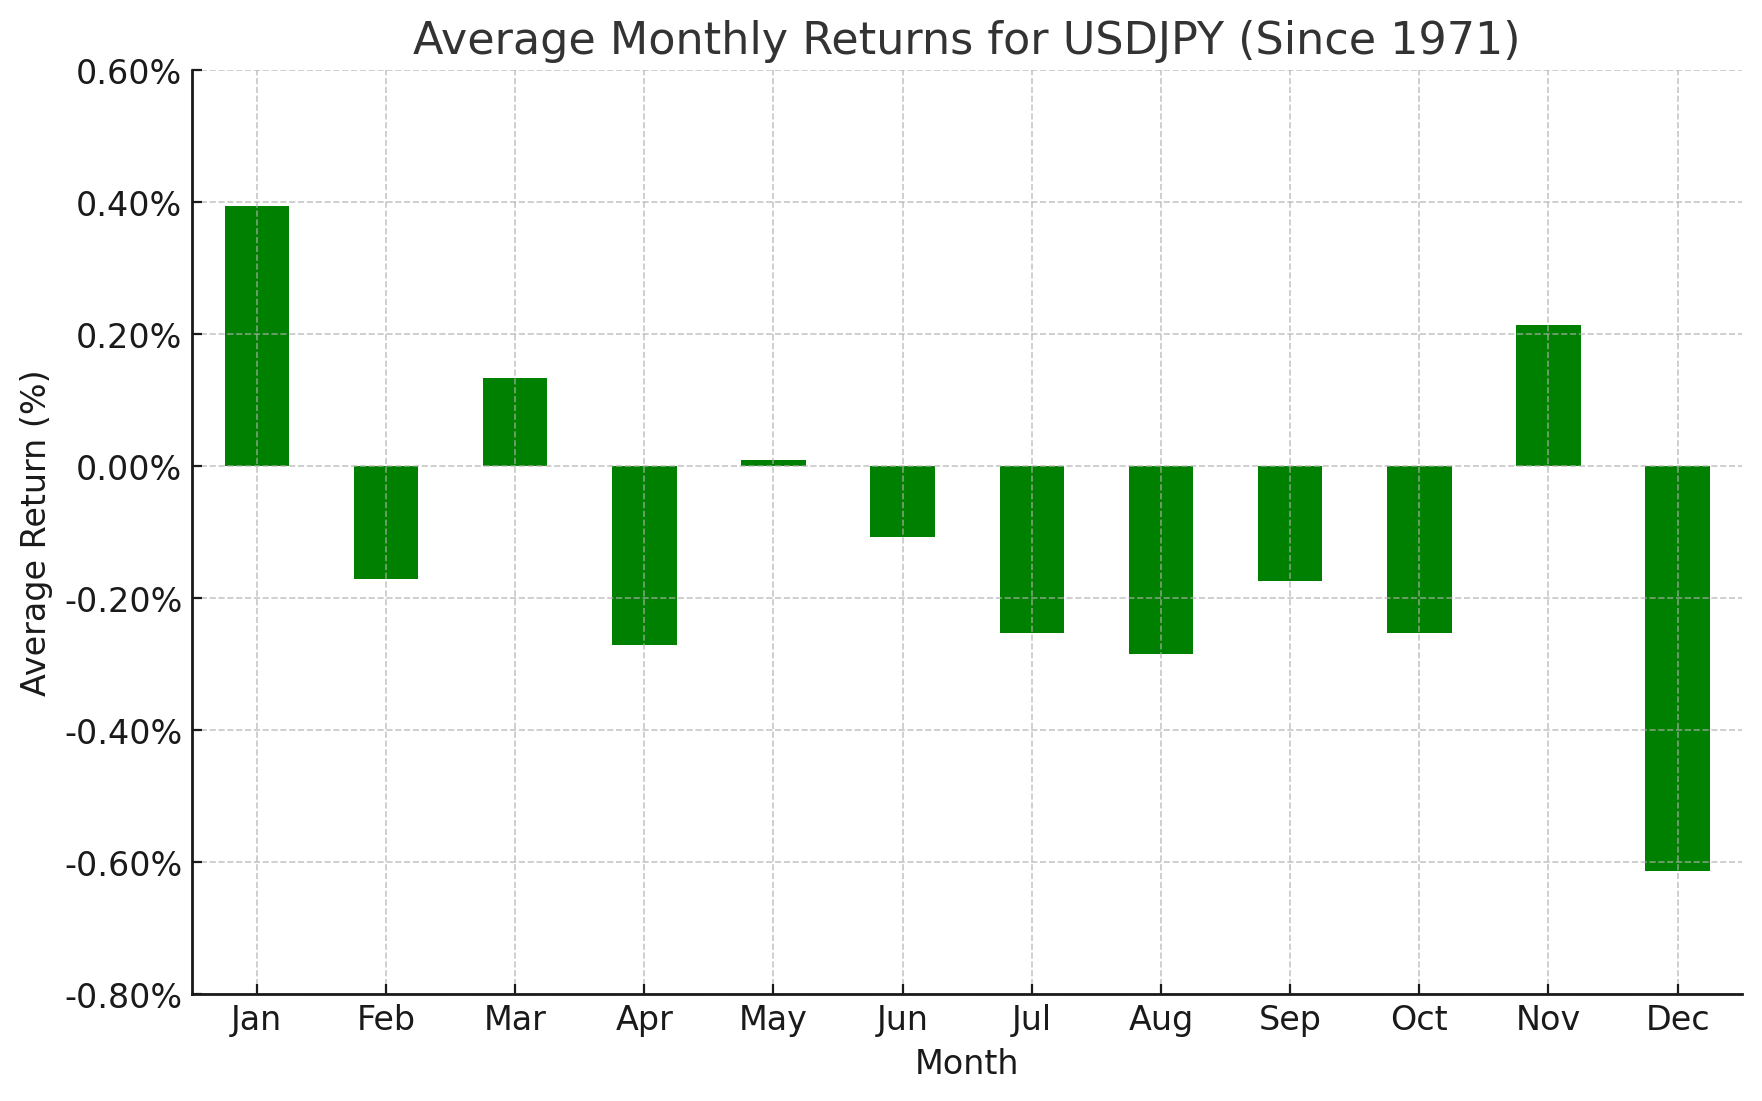
Japanese Yen Forex Seasonality – USD/JPY Chart
Source: TradingView, StoneX. Please note that past performance is not necessarily indicative of future results.
August has historically been a modestly bearish month for USD/JPY, with the pair falling by an average of -0.28% since the Bretton Woods agreement. Contrary to its long-term seasonal trend, USD/JPY rallied back toward 150.00 in July. The key resistance zone to watch for technically-minded traders this month will be the confluence of the 200-day moving average and 50% Fibonacci retracement in the 149.50-150.00 area.
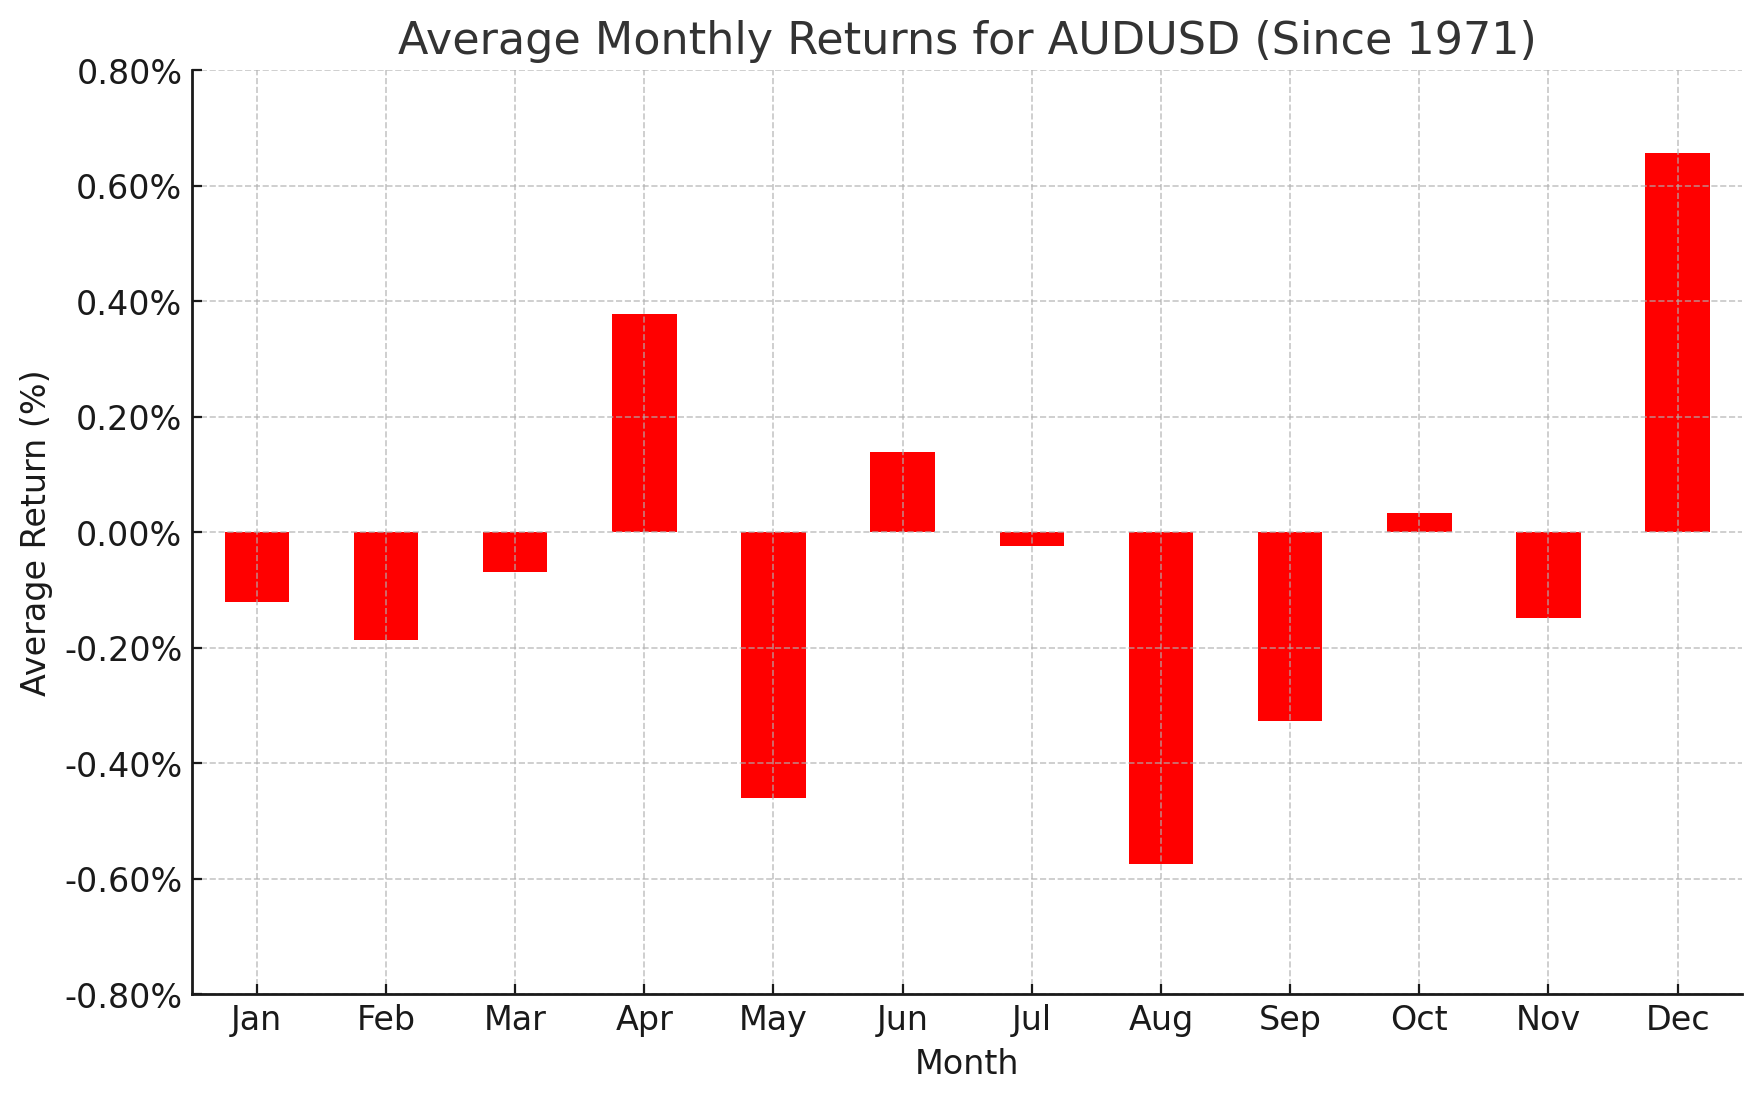
Australian Dollar Forex Seasonality – AUD/USD Chart
Source: TradingView, StoneX. Please note that past performance is not necessarily indicative of future results.
Turning our attention Down Under, AUD/USD has historically seen its worst monthly performance in August, with an average drop of -0.57% going back to 1971. Last month, the Aussie fell against the greenback, essentially finishing where it ended June in the 0.64s. Moving forward, AUD/USD’s year-to-date uptrend is in doubt, with the 200-day MA near 0.6400 representing a key “line in the sand” for longer-term trend traders.
Canadian Dollar Forex Seasonality – USD/CAD Chart
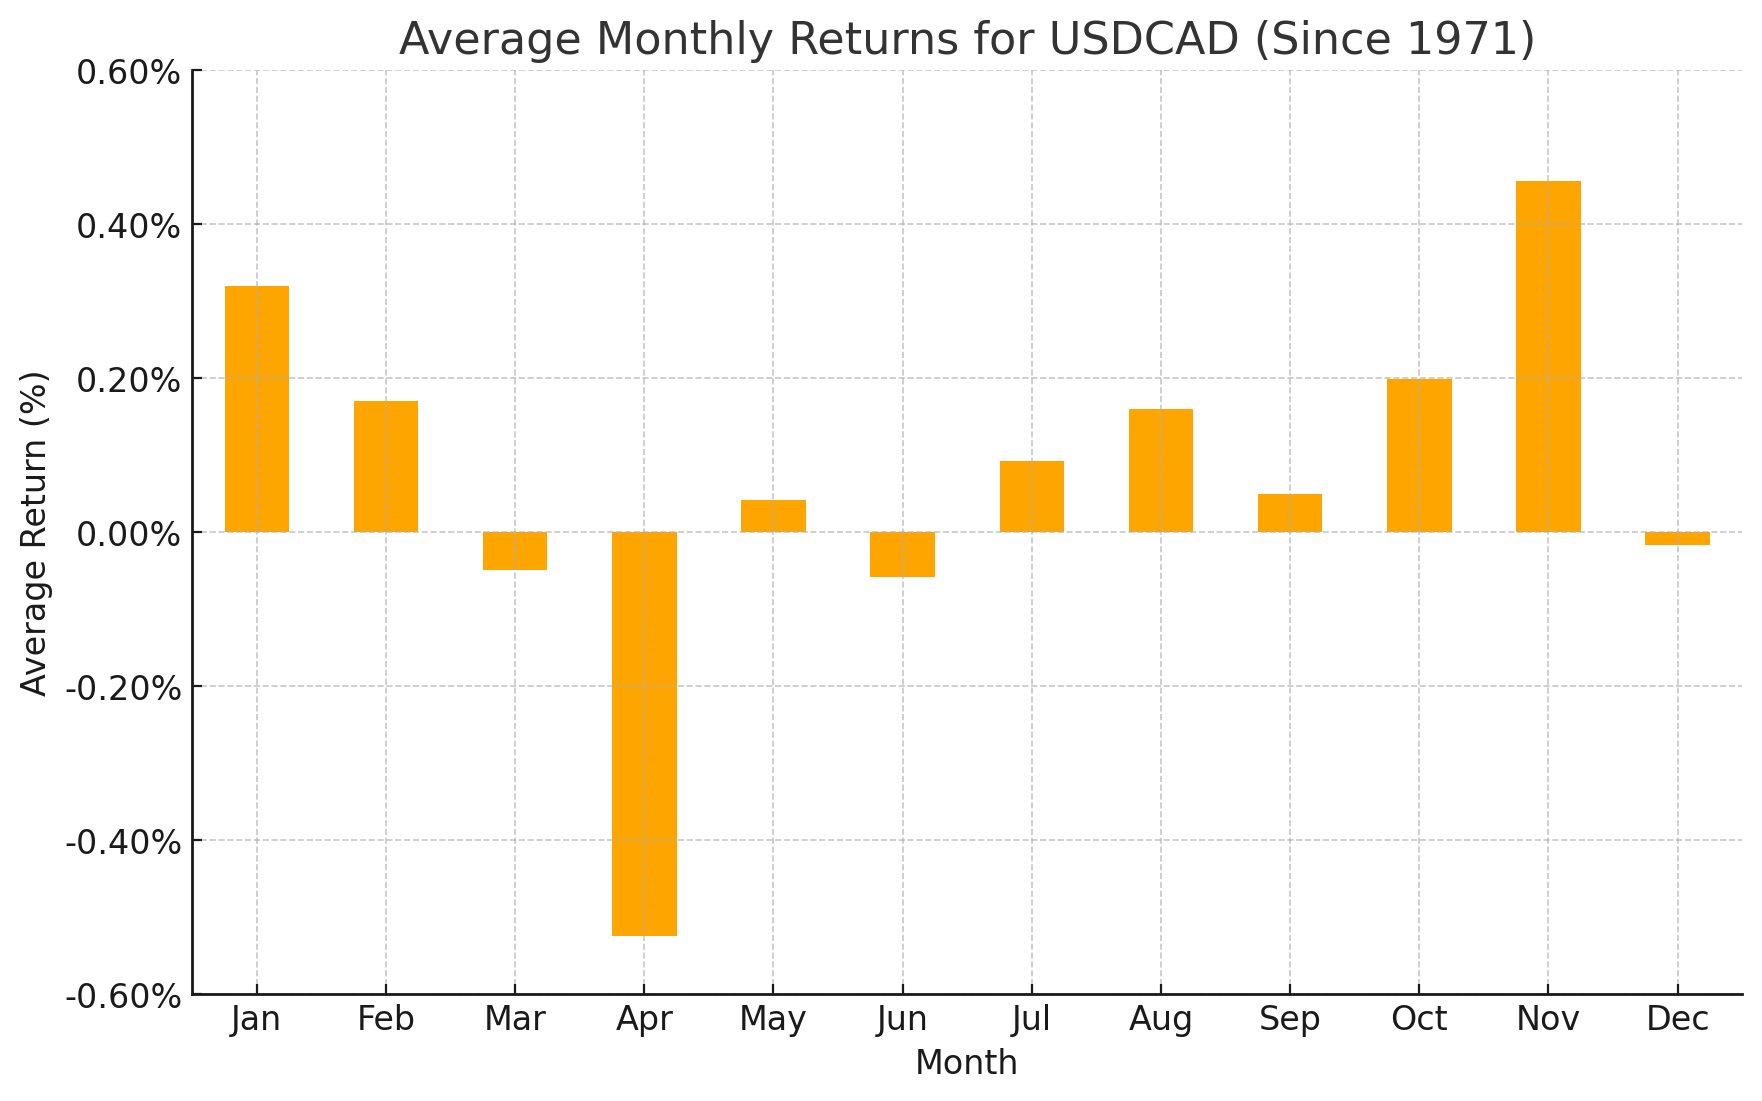
Source: TradingView, StoneX. Please note that past performance is not necessarily indicative of future results.
Last but not least, August has been a modestly positive month for USD/CAD, with an average historical return of +0.16%. The US dollar ticked higher against its Northern rival last month, and put in a series of “higher lows” on the daily chart, hinting at a possible mid-year reversal back to the topside as long as support in the mid-1.3600s continues to put a floor under rates.
As always, we want to close this article by reminding readers that seasonal tendencies are not gospel – even if they’ve tracked relatively closely so far this year – so it’s important to complement this analysis with an examination of the current fundamental and technical backdrops for the major currency pairs.
-- Written by Matt Weller, Global Head of Research
Check out Matt’s Daily Market Update videos on YouTube and be sure to follow Matt on Twitter: @MWellerFX
Latest market news




Open an account in minutes
Experience award-winning platforms with fast and secure execution, and enjoy tight spreads from 0.5 pts on FX and 0.3 pts on indices.
Economic calendar
Web Trader platform
Our sophisticated web-based platform is packed with features.
Related articles
US Core PCE Preview: Stale or Significant for the Fed
Core PCE inflation takes center stage Wednesday, with traders watching for signs of renewed price pressure and clues on whether the Fed could hike again in October.
Japanese Yen Technical Analysis: USD/JPY Support Test into Core PCE
USD/JPY has been a battlefield for the past two months as the force of intervention and the threat of more have given sellers an advantage, even as buyers have continued to bid support on pullbacks. This sets the stage for a massive finish to the week with Core PCE and Non-farm Payrolls.

Australian Dollar Forecast: AUD/USD Four-Week Slide Nears Critical Uptrend Support 9 29 2026
Aussie momentum has deteriorated sharply into quarter-end, with inflation, Core PCE and NFP on tap as AUD/USD closes in on a pivotal technical threshold.

This report is intended for general circulation only. It should not be construed as a recommendation, or an offer (or solicitation of an offer) to buy or sell any financial products. The information provided does not take into account your specific investment objectives, financial situation or particular needs. Before you act on any recommendation that may be contained in this report, independent advice ought to be sought from a financial adviser regarding the suitability of the investment product, taking into account your specific investment objectives, financial situation or particular needs.
StoneX Financial Pte. Ltd., may distribute reports produced by its respective foreign entities or affiliates within the StoneX group of companies or third parties pursuant to an arrangement under Regulation 32C of the Financial Advisers Regulations. Where the report is distributed to a person in Singapore who is not an accredited investor, expert investor or an institutional investor (as defined in the Securities Futures Act), StoneX Financial Pte. Ltd. accepts legal responsibility to such persons for the contents of the report only to the extent required by law. Singapore recipients should contact StoneX Financial Pte. Ltd. at 6826 9988 for matters arising from, or in connection with the report.
In the case of all other recipients of this report, to the extent permitted by applicable laws and regulations neither StoneX Financial Pte. Ltd. nor its associated companies will be responsible or liable for any loss or damage incurred arising out of, or in connection with, any use of the information contained in this report and all such liability is hereby expressly disclaimed. No representation or warranty is made, express or implied, that the content of this report is complete or accurate.
StoneX Financial Pte. Ltd. is not under any obligation to update this report.
Trading CFDs carries a high level of risk that may not be suitable for some investors. Consider your investment objectives, level of experience, financial resources, risk appetite and other relevant circumstances carefully. The possibility exists that you could lose some or all of your investments, including your initial deposits. If in doubt, please seek independent expert advice. Visit www.forex.com/en-sg/terms-and-policies for the complete Risk Disclosure Statement.