





fx analysis technical outlook 9 1492912015
<p>The US Non-Farm Payrolls and Unemployment Rate data came and went this past Friday, leaving in its immediate wake a weaker dollar and significantly stronger […]</p>
Share this:

The US Non-Farm Payrolls and Unemployment Rate data came and went this past Friday, leaving in its immediate wake a weaker dollar and significantly stronger gold prices, as the markets began to doubt that the disappointing employment numbers were sufficient to prompt a 2015 Fed rate hike. While gold kept its gains as of Monday morning, the US dollar was able to claw back much of Friday’s losses and once again show its relative resilience.
EUR/USD
The past week saw EUR/USD continue its prolonged consolidation generally between 1.1100 support to the downside and 1.1300 resistance to the upside. The currency pair briefly rose above 1.1300 on Friday when the dollar plunged immediately after the US employment data was released, but soon retreated off those highs and back down well below 1.1300. As the new trading week begins, EUR/USD continues to be pressured to the downside despite Friday’s weak employment data and expectations of a potentially more dovish Fed. The noted 1.1100 support level continues to serve as the downside level to watch in the event of any breakdown of the current consolidation. Any breakdown below 1.1100 and the 200-day moving average that is currently running directly underneath that level could prompt a return to the long-term bearish bias that has been in place since the current downtrend began in May of last year. In the event of this breakdown, the next major target to the downside is at the key 1.0800 support level. To the upside, the 1.1400 level should continue to serve as major resistance on any significant EUR/USD rebound.
GBP/USD
Like EUR/USD, GBP/USD initially rose this past Friday as the dollar fell after disappointing non-farm payrolls data was released in the US. GBP/USD was able to break above the key 1.5200 level, but only briefly, as it retreated later on Friday. In fact, the past week has seen GBP/USD continue to attempt a climb back above 1.5200 after the prior week’s 2% plunge from the 1.5500 area down to below 1.5200. Early Monday morning saw another attempt to breach 1.5200 resistance, but a worse-than-expected Purchasing Managers’ Index (PMI) reading out of the UK once again pressured the pound. This data could contribute to a further delay of a potential Bank of England rate hike. If the GBP/USD continues to wallow below the 1.5200 level, the next major bearish target is at the 1.5000 psychological support level, which has served as both support and resistance since the beginning of the year. Any further downside move could then begin to target the key 1.4800 support objective. To the upside, on any rebound above 1.5200, the 1.5300 level should serve as a key resistance barrier.
USD/JPY
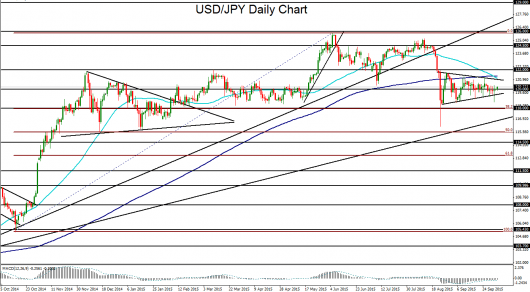
USD/JPY initially spiked below its current triangle pattern this past Friday as the disappointing US employment data prompted an immediate drop in the US dollar and global stock markets. Again, however, this reaction was short-lived, as USD/JPY recovered by the end of the trading day, with the dollar and equities rebounding from their lows. The new trading week has seen a full recovery for USD/JPY back above the key 120.00 level and well inside the noted triangle pattern that has been in place since late August. The 50-day moving average has recently crossed below the 200-day moving average, creating a potential “death cross” technical scenario that could presage further downside for USD/JPY on further global market volatility and a potential flight to the yen. In this event, a breakdown below the triangle pattern could prompt the currency pair to target the next major objectives at the 118.00 and then 116.00 support levels. Upside resistance on any sustained trading above 120.00 continues to reside around the upper border of the noted triangle pattern.
Related tags:
Latest market news




Open an account in minutes
Experience award-winning platforms with fast and secure execution, and enjoy tight spreads from 0.5 pts on FX and 0.3 pts on indices.
Economic calendar
Web Trader platform
Our sophisticated web-based platform is packed with features.
Related articles
This report is intended for general circulation only. It should not be construed as a recommendation, or an offer (or solicitation of an offer) to buy or sell any financial products. The information provided does not take into account your specific investment objectives, financial situation or particular needs. Before you act on any recommendation that may be contained in this report, independent advice ought to be sought from a financial adviser regarding the suitability of the investment product, taking into account your specific investment objectives, financial situation or particular needs.
StoneX Financial Pte. Ltd., may distribute reports produced by its respective foreign entities or affiliates within the StoneX group of companies or third parties pursuant to an arrangement under Regulation 32C of the Financial Advisers Regulations. Where the report is distributed to a person in Singapore who is not an accredited investor, expert investor or an institutional investor (as defined in the Securities Futures Act), StoneX Financial Pte. Ltd. accepts legal responsibility to such persons for the contents of the report only to the extent required by law. Singapore recipients should contact StoneX Financial Pte. Ltd. at 6826 9988 for matters arising from, or in connection with the report.
In the case of all other recipients of this report, to the extent permitted by applicable laws and regulations neither StoneX Financial Pte. Ltd. nor its associated companies will be responsible or liable for any loss or damage incurred arising out of, or in connection with, any use of the information contained in this report and all such liability is hereby expressly disclaimed. No representation or warranty is made, express or implied, that the content of this report is complete or accurate.
StoneX Financial Pte. Ltd. is not under any obligation to update this report.
Trading CFDs carries a high level of risk that may not be suitable for some investors. Consider your investment objectives, level of experience, financial resources, risk appetite and other relevant circumstances carefully. The possibility exists that you could lose some or all of your investments, including your initial deposits. If in doubt, please seek independent expert advice. Visit www.forex.com/en-sg/terms-and-policies for the complete Risk Disclosure Statement.